

 PDF
PDF Citation
 Print
Print


INTRODUCTION
Currently, a significant number of chronic diseases in Korea are related to dietary lifestyles and are the major cause of death among the population. According to the Annual report on cause of death statistics, the prevalence rates of lifestyle-related chronic health conditions in adults aged 30 years or older were high and have been showing a continuously increasing trend. The prevalence rate of obesity was 40.0%, hypertension, 28.3%, diabetes, 13.6%, hypercholesterolemia, 23.9%, and hypertriglyceridemia, 16.7% [12].
Various studies have assessed the relationship between the Healthy Eating Index (HEI), cardiovascular disease (CVD), and death [3]; HEI and the metabolic syndrome [4]; HEI and quality of diet [5], and HEI and nutritional/energy density [6]. A study in a multiethnic cohort reported an inverse association between the HEI-2015 score and all-cause, CVD, and cancer-related mortalities among men and women [7], suggesting that a higher HEI was significantly associated with a lower risk of disease and an improved dietary lifestyle. Fogli-Cawley et al. [8] reported a significant inverse correlation between adherence to Dietary Guidelines for Americans and abdominal obesity, hyperglycemia, hypertriglyceridemia, and high blood pressure in a study involving 5,135 adults aged 28–62 years. In their prospective cohort study with a follow-up period of approximately six years, Kesse-Guyot et al. [9] reported a significant inverse relationship between the consumption of the Mediterranean diet and waist circumference, systolic blood pressure (SBP), and blood triglyceride levels.
The number of single-person households (SPH) in Korea has been on the rise and a sharp increase has been seen over the past five years. SPH accounted for 28.6% of all households in 2017 but increased to 30.2% in 2019, 31.7% in 2020, and 33.4% in 2021. Based on this data, one in three households is a one-person household [10]. Young people in their 20s and 30s who are economically deprived due to unemployment, delay marriage and consequently remain in SPH. Recently, the problem of dying alone has emerged not only among the elderly but also among men in their 50s due to economic problems, divorce, and disease [11].
Recently, middle-aged SPH were observed to include not only singles and divorcees, but also ‘goose fathers’ who live apart from their families to earn and pay for the family living expenses and education of the children [121314]. For men, it is believed that the lack of time with family and living alone are not conducive to maintaining a good, healthy nutritional lifestyle [15]. Several studies have identified the relationship between living alone and a higher risk of developing adverse health conditions, including diabetes, cardiovascular disease (CVD) and related mortality, falls and functional impairment, social isolation, and related mental health disorders [161718]. The cultural and social roles of food and cooking could be a barrier to healthy eating in those living alone [17]. Several studies have reported a decrease in motivation and enjoyment for cooking and/or eating when alone, often indicated by preparing light meals or using ready-to-eat meals [19202122].
However, the previous studies described above analyzed the HEI in all adults; thus, it is hard to say whether their assessment of dietary lifestyle fully reflected the characteristics of SPH and multi-person households (MPH) of middle-aged adults. Therefore, the present study compared the Korean Healthy Eating Index (KHEI) scores of middle-aged adults of SPH and MPH according to their gender and examined the relationship between the scores and chronic conditions.
MATERIALS AND METHODS
Study design
These data were extracted from the Korea National Health and Nutrition Examination Survey (KNHANES), 2016 to 2018, which was conducted by the Korea Centers for Disease Control and Prevention (KCDC). The KNHANES is a complex, stratified, multi-step probability, and cluster survey conducted year-round using a rolling method to sample participants representative of the Korean population. The KNHANES has a cross-sectional design and consists of health interviews, examinations, and nutrition surveys. Details of the KNHANES were previously described by Kweon et al. [23]. The survey protocol was approved by the Institutional Review Board of the KCDC, and given the approval number 2018-01-03-P-A. All participants provided their informed consent.
Among the 6,198 participants aged 40–60 yrs who participated in all three surveys, people with abnormal dietary intakes (less than 800 kcal/day or more than 4,000 kcal/day for men, and less than 500 kcal/day or more than 3,500 kcal/day for women) (n = 278) were excluded [24]. Participants whose data did not include the variables of obesity, hypertension, diabetes, hypertriglyceridemia, and hypercholesterolemia (n = 1,658) and participants with missing sociodemographic variables (n = 149) were also excluded. Finally, 4,113 participants (1,517 men and 2,596 women) were included in the study.
General measurements
Sociodemographic factors such as age, gender, marital status, education, household income, and household size were investigated using a self-reported questionnaire. Data on smoking status, alcohol consumption, and physical activity were collected through health and behavior interviews. Education levels were categorized according to graduation status (elementary school, middle school, high school, or college or higher). Marital status was classified as either married or single, and household income was categorized as low, middle-low, middle-high, or high. Smoking status was classified as present or past/never, and alcohol consumption was classified as non-drinking or drinking. Household size was categorized as either SPH or MPH.
Chronic conditions evaluated in the study
Data on health status included variables related to obesity, hypertension, diabetes, hypertriglyceridemia, and hypercholesterolemia. Body mass index (BMI) was calculated as weight divided by height squared (kg/m2) and used to classify the participants into four weight categories: underweight (BMI < 18.5 kg/m2), normal weight (18.5 ≤ BMI < 23 kg/m2), overweight (23 ≤ BMI < 25 kg/m2), or obese (BMI ≥ 25 kg/m2) [25]. Hypertension was defined as a SBP ≥ 140 mmHg, a diastolic blood pressure (DBP) ≥ 90 mmHg, and/or the current use of antihypertensive medications. Prehypertension was defined as SBP from 120 to 139 mmHg or DBP from 80 to 89 mmHg. Diabetes was defined as a fasting blood glucose (FBG) level of ≥ 126 mg/dL, self-reported based on diagnosis by a physician, and/or the use of hypoglycemic medications or insulin. Impaired FBG was defined as FBG between 100 to 125 mg/dL. Hypertriglyceridemia was defined as triglyceride levels ≥ 200 mg/dL after fasting for > 12 h. Hypercholesterolemia was defined as a fasting total cholesterol level of ≥ 240 mg/dL or taking cholesterol medications [26].
Dietary intakes
Dietary intake data were collected by trained dietitians using the 24-h dietary recall method via a dietary survey. The total energy and nutrient intakes were calculated using a food composition table from the 24-h dietary recall [27]. The total daily energy intake, percentage of energy intake from macronutrients (carbohydrate [CHO], fat, and protein), and the amount of nutrients per 1,000 kcal were evaluated.
KHEI
The KHEI is an indicator developed by the KCDC to assess adherence to the national dietary guidelines and to comprehensively evaluate the dietary lifestyle and quality of Koreans [28]. The KHEI includes 14 components, eight of which evaluate the adequacy of the recommended food and nutrient intakes (eating breakfast and the consumption of multi-grains, total fruits, fresh fruits, total vegetables, vegetables excluding kimchi and pickles, meat, fish, eggs, and legumes, milk, and dairy products), three evaluate the intake of foods and nutrients for which restricted consumption is recommended (percentage of energy intake from sweets and beverages, saturated fatty acids, and sodium), and three evaluate the balance of energy intake (adequate energy intake, and percentage of energy intake from CHO and fats). The maximum possible score on the KHEI is 100 points. Some of the components had a weight of 5 points each (multi-grains, fruits, vegetables, percentage of energy intake from CHO and fats, adequate energy intake); the rest had weights of 10 points, given their importance. The KHEI score was outlined in the KNHANES raw data.
Statistical analysis
All statistical analyses were performed using SAS version 9.4 (SAS Inc., Cary, NC, USA). A complex survey design was used with multistage, stratified, clustered samples and sample weights. Continuous variables, including age, BMI, blood profiles, total energy intake, nutrient intakes, and KHEI scores, were expressed as means ± SE. Categorical variables, including age, marital status, education, household income, alcohol intake, smoking, physical activity, BMI, hypertension, diabetes, hypertriglyceridemia, and hypercholesterolemia, were expressed as frequencies and percentages.
Differences in gender and household size were compared using χ2 tests and a general linear model. To analyze the association between KHEI scores (tertiles) by gender and household size and the prevalence of chronic conditions (obesity, hypertension, diabetes, hypertriglyceridemia, and hypercholesterolemia), the odds ratios (ORs) and 95% confidence intervals (CIs) were calculated by logistic regression analyses. The prevalence of chronic conditions was compared by gender and household size using multiple logistic regression analyses before (Model 1) and after (Model 2) adjusting for variables. Age, marital status, education levels, household income levels, and smoking status, which showed significant differences according to household size, were included as adjustment variables. Statistical significance was set at P < 0.05.
RESULTS
General characteristics of the participants
Table 1 shows the sociodemographic characteristics of the participants according to household size and gender. The mean age of the male participants was 49.43 ± 0.53 yrs in the SPH and 49.34 ± 0.17 yrs in MPH. The mean age of the female participants was 52.07 ± 0.52 yrs in the SPH and 49.54 ± 0.14 yrs in MPH (P < 0.0001). Among both genders, those in SPH were significantly more likely to have low education (P = 0.004 for men; P < 0.0001 for women), low household income (P < 0.0001 for men and women), single status (P < 0.0001 for men and women), and were current smokers (P < 0.0001 for men; P = 0.028 for women) compared to those in MPH. Men in SPH had a significantly lower BMI (P = 0.017) and a lower obesity rate compared to men in MPH (P = 0.003). Among women, the prevalence of hypertension was significantly higher in those from SPH compared to women from MPH (P = 0.004).
Table 1
Sociodemographic characteristics by participants according to household size and gender
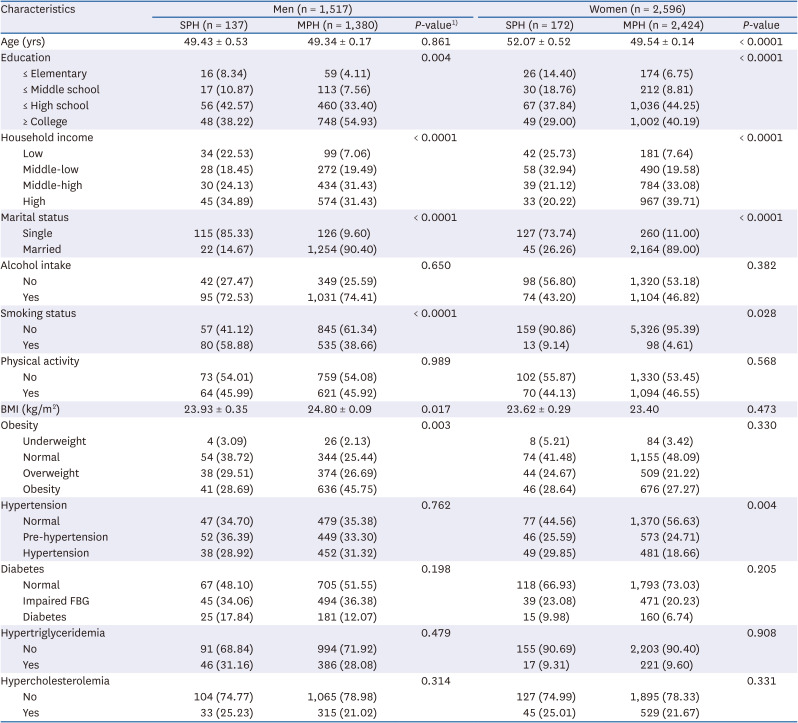
Values are expressed as mean ± SE or numbers (%).
SPH, single-person households; MPH, multi-person households; BMI, body mass index (Underweight: < 18.5 kg/m2; Normal: ≥ 18.5 and < 23 kg/m2; Overweight: ≥ 23.0 and < 25 kg/m2; Obesity: ≥ 25 kg/m2); FBG, fasting blood glucose.
1)The P-value was estimated using the χ2 test and t-test in the complex sample survey data analysis.
Laboratory blood tests and blood pressure measurements of participants
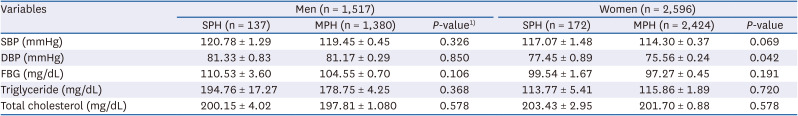
Table 2 shows the laboratory blood test results of the participants including FBG, triglycerides, and total cholesterol according to their household size and gender. The table also shows the blood pressure values of the participants. Women in SPH showed significantly higher DBP (P = 0.042) compared to those in MPH. The other parameters did not show significant differences according to household size and gender.
Table 2
Participant blood parameters according to household size and gender
Daily nutrient intake of participants
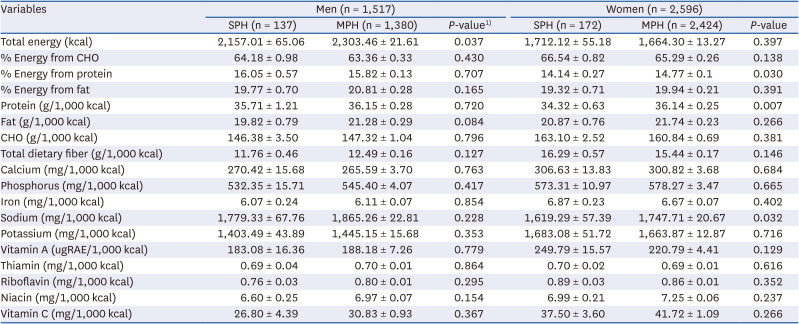
The daily nutrient intakes of the participants are shown in Table 3. Men showed a significant difference in the total energy intake by household size (P = 0.037), but there was no difference in the nutrient intake per 1,000 kcal between groups. In women, the protein energy intake percentage (P = 0.030) and protein (P = 0.007) and sodium densities (P = 0.032) of those in SPH were significantly lower than in women in MPH.
Table 3
Participant nutrient intake according to household size and gender
KHEI of the participants
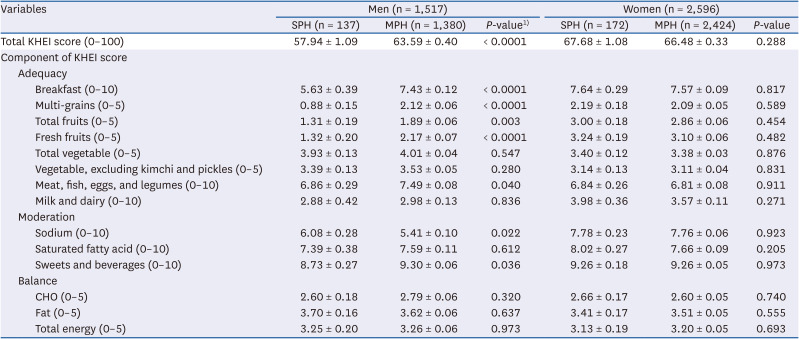
The participants’ KHEI scores are shown in Table 4. Men in SPH showed a significantly lower total KHEI score compared to men in MPH (P < 0.0001). Moreover, men in SPH had lower KHEI component scores for breakfast (P < 0.0001); multi-grains (P < 0.0001); total fruit (P = 0.003); fresh fruit (P < 0.0001); and meat, fish, eggs, and legumes intake (P = 0.040); and a moderate intake of sweets and beverages (P = 0.036) compared to men in MPH. The moderation of sodium intake in SPH was significantly higher than that in MPH (P = 0.022). However, among women, the total or component scores of the KHEI did not differ significantly according to household size.
Table 4
KHEI score of participants according to household size and gender
Relationships between household size and chronic conditions
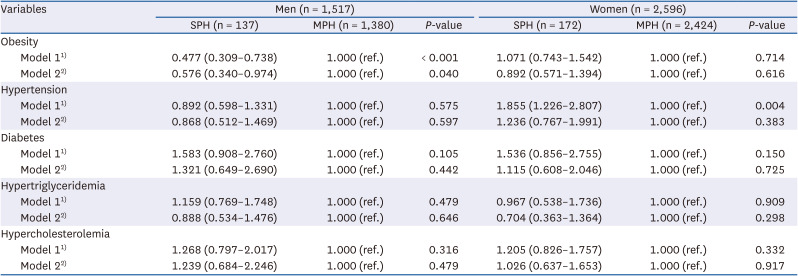
Table 5 presents the ORs for chronic conditions according to household size and gender. The prevalence of obesity was significantly lower among men in SPH as compared to men in MPH (Model 1: OR, 0.477; 95% CI, 0.309–0.738; P < 0.001). The prevalence of hypertension was significantly higher among women in SPH compared to those in MPH (Model 1: OR, 1.855; 95% CI, 1.226–2.807; P = 0.004). After adjusting for confounding factors, men in SPH were significantly associated with a lower prevalence of obesity compared to those in MPH (Model 2: OR, 0.576; 95% CI, 0.340–0.974; P = 0.040).
Table 5
Odds ratios (ORs) for chronic conditions according to household size and gender
Relationship between KHEI and chronic conditions
Table 6 presents the ORs for chronic conditions according to the tertiles of KHEI scores by household size in men. For men, the adjusted ORs for obesity, hypertension, and hypertriglyceridemia with the first tertile of KHEI scores (T1) in SPH compared to the third tertile (T3) group were 4.625 (95% CI, 1.439–14.867), 3.790 (95% CI, 1.040–13.810), and 4.333 (95% CI, 1.372–13.677), respectively, with significant dose-response associations observed in obesity and hypertriglyceridemia (P for trend = 0.012). The adjusted OR for hypertension with the second tertile (T2) group in MPH compared to the T3 group was 1.385 (95% CI, 1.002–1.914). The adjusted OR for hypertriglyceridemia in the T1 group in SPH compared to the T3 group was 1.556 (95% CI, 1.102–2.197), with significant dose-response associations (P for trend = 0.015).
Table 6
ORs for chronic conditions in men according to tertiles of KHEI score by household size
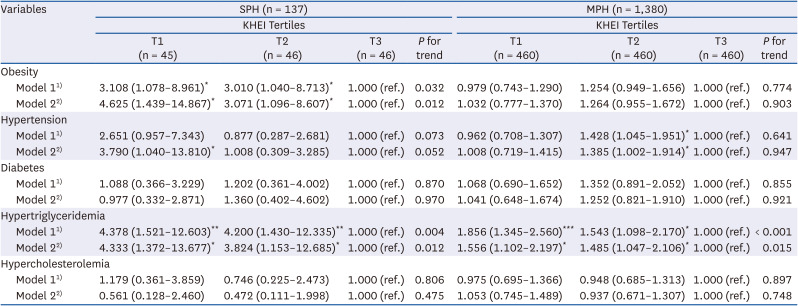
Values are expressed as OR (CI).
SPH, single-person household; MPH, multi-person households; KHEI, Korean Healthy Eating Index; T1, first tertile; T2, second tertile; T3, third tertile; OR, odds ratio; CI, confidence interval.
1)Model 1: crude.
2)Model 2: adjusted for age, marital status, education, household income, and smoking status.
*P < 0.05, **P < 0.01, ***P < 0.001.
Table 7 presents the ORs for chronic conditions according to the tertiles of the KHEI scores by household size in women. The adjusted ORs for obesity and hypertriglyceridemia in the T1 group in SPH compared to the T3 group were 3.223 (95% CI, 1.247–8.332) and 7.134 (95% CI, 1.078–47.188), respectively, with significant dose-response associations (P for trend < 0.05, for both). The adjusted ORs for obesity and hypertension in the T1 group compared to the T3 group in MPH were 1.573 (95% CI, 1.178–2.099) and 1.373 (95% CI, 1.001–1.884), respectively, with significant dose-response associations observed for obesity (P for trend = 0.002).
Table 7
ORs for chronic conditions in women according to tertiles of KHEI score by household size
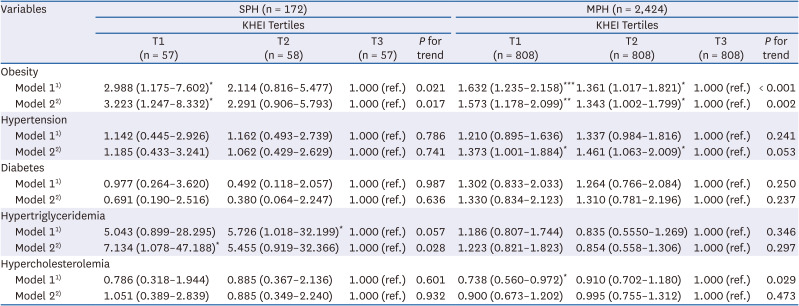
Values are expressed as OR (CI).
OR, odds ratio; CI, confidence interval SPH, single-person household; MPH, multi-person households; KHEI, Korean Healthy Eating Index; T1, first tertile; T2, second tertile; T3, third tertile.
1)Model 1: crude.
2)Model 2: adjusted for age, marital status, education, household income, and smoking status.
*P < 0.05, **P < 0.01, ***P < 0.001.
DISCUSSION
This study was designed to identify the association between the HEI and chronic conditions among middle-aged adults in single households according to gender based on the 2016–2018 KNHANES data. In the case of men, when compared to those in MPH, middle-aged men in SPH had a lower energy intake; total KHEI score; lower breakfast consumption; and poor intake of multi-grains, fruits, protein foods, and sodium and higher intakes of sweets and beverages. When compared to those in MPH, the prevalence risk of obesity was lower in middle-aged men in SPH (Model 2 – adjusted for age, marital status, education, household income, and smoking). However, the lower the KHEI, the higher the risk of obesity and hypertriglyceridemia among middle-aged men in SPH and the higher the risk of hypertriglyceridemia among those in MPH. This indicates that in the case of men in SPH, dietary habits have a greater effect on obesity and hypertriglyceridemia. In the case of women, there were significantly lower protein and sodium intakes among middle-aged women in SPH compared to those in MPH, and no differences were observed in the KHEI scores. Although middle-aged women in SPH showed a higher prevalence of hypertension than those in MPH, when adjusted for variables, we observed no relationship with the risk of hypertension according to household size (Model 2). The lower the KHEI, the higher the risk of obesity and hypertriglyceridemia among middle-aged women in SPH, and the higher the risk of obesity among those in MPH. Women seem to be less affected by eating habits according to household size, but the risk of chronic conditions appears to be influenced by eating habits. It was observed that in single households the effects of eating habits on chronic conditions varied according to gender.
A lack of cooking skills can contribute to the difficulty in preparing meals when alone, a particular risk in bereaved, divorced, or ‘goose father’ individuals previously reliant on their partners for food preparation [22]. The increased likelihood of food insecurity or reduced food access in persons living alone compared to those individuals living together [2930313233] suggests that food costs may be a problem for many people who live alone.
KHEI is an assessment based on the dietary guidelines for Korean adults and dietary reference intakes for Koreans [34] and is used to assess the overall quality of the diet and prevent and manage chronic diseases in Koreans. The KHEI includes components to estimate the adequacy of adherence to the recommended daily diet, as well as components to assess moderation related to the restraining of food intake. The diet quality index components associated with a lower risk of mortality were the higher intake of fruits, vegetables, nuts, and long-chain n-3 fatty acids; lower intake of red meat; and avoidance of high levels of alcohol consumption [35]. In this study, it was found that only men in SPH had a lower diet quality. Men showed a low total KHEI score in SPH, a low intake of breakfast, multi-grains, fruits, and protein foods in the moderate intake section of the score, and a high sweets and beverages intake but low sodium intake in the moderation section of the score. Men may not have adequate skills to prepare or cook food compared to women [22]. Therefore, it might be difficult for men living alone to eat breakfast or consume a variety of fresh foods.
Lee [36] examined the relationship between household type and health outcomes across age groups and reported that household type affects the prevalence of chronic diseases in young and middle-aged people. Moreover, young and middle-aged individuals in SPH, but not the elderly, showed a 2- and 1.4-fold higher risk of morbidity due to chronic diseases, respectively, when compared to individuals in MPH [36]. Meanwhile, a study by Lee and Cho [37] that compared health behavior and disease prevalence between middle-aged individuals in their 40s–50s reported no differences in the prevalence of conditions, such as hypertension and hyperlipidemia, between those in SPH and MPH. Similarly, in the present study, household size was not related to the prevalence of hypertension, diabetes, hypertriglyceridemia, and hypercholesterolemia in both men and women. On the other hand, only the risk of obesity (0.576-fold) in middle-aged men in SPH was lower than that in MPH, which was probably a result of their low energy intake. These results, which are contrary to previous reports, could be caused by differences in age standards, gender, health-related measurement variables, and adjusted variables. Nevertheless, the poor diet quality of middle-aged adults living alone is more of a concern among men than among women and can lead to malnutrition and threaten long-term health. Therefore, interventions to improve diet quality are required in these individuals.
Shin and Lee [38] reported that the prevalence risk of the metabolic syndrome, abdominal obesity, and hypertriglyceridemia decreased in men, while the prevalence of the metabolic syndrome, abdominal obesity, and hypertension decreased in women when the total KHEI scores were higher. In addition, compared to the first quintile of the KHEI, the fifth quintile showed higher total energy intake; higher energy intake from fat; higher intakes of dietary fiber, vegetables, dairy products, protein food, and white grains; significantly lower energy intake from CHO; and lower intakes of alcohol, empty-calorie foods, and refined grains, which indicated that the overall quality of the healthy diet could lower the risk of the metabolic syndrome. Similarly, the results of this study showed that the risks of chronic conditions such as obesity, hypertension, and hypertriglyceridemia were higher in the first tertile compared to the third tertile of the KHEI in both middle-aged men and women, regardless of household size. Better adherence to healthy eating is associated with the increased consumption of whole grains, fruit, vegetables, low-fat dairy foods, lean meats, and legumes and lower intakes of cholesterol, saturated fatty acids, and total fat [39]. This diet was also associated with improved lipid profiles [40].
A study on the relationship between KHEI and estimated cardiovascular age using the KNHANES 2013–2017 data [41] reported that subjects with a high KHEI score had good cardiovascular health compared to those with a low KHEI score. In women with a high KHEI score, the probability of having a healthy estimated cardiovascular age was 1.34-fold higher. Research on the relationship between the HEI and CVD in Chinese people [35] suggests that the intake of various vegetable foods could increase HEI, which could reduce the death rate due to chronic diseases. Also, a study by Neelakantan et al. [35] showed that higher diet index scores were associated with a 14–28% lower risk of CVD and respiratory disease mortality but only a 5–12% lower risk of cancer-associated mortality. In research on the relationship between diet quality and metabolic syndrome based on the KHEI of Korean adults, Shin and Lee [38] reported a significant (approximately 24%) decreased risk of metabolic syndrome in the fifth quintile of the KHEI compared to the first quintile.
Examination of the relationship between the prevalence risk of chronic conditions and the KHEI tertiles of scores by household size among men in SPH showed a higher prevalence risk of obesity (4.625-fold), hypertension (3.790-fold), and hypertriglyceridemia (4.333-fold) in the first tertile compared to the third tertile. Among men in MPH, the prevalence risk of hypertension was 1.385-fold higher in the second tertile compared to the third tertile, while the prevalence risk of hypertriglyceridemia was 1.556-fold higher in the first tertile. Among women in SPH, in comparison with the third tertile, the first tertile showed a higher prevalence risk of obesity (3.223-fold), hypertension (1.185-fold), and hypertriglyceridemia (7.134-fold). Among women in MPH, when compared to the third tertile, the first tertile showed 1.573- and 1.373-fold higher prevalence risks of obesity and hypertension, respectively. In other words, when the quality of diet declined, middle-aged men and women living alone showed a greater increase in the prevalence risk of chronic conditions. Thus, improvement of diet quality by regularly eating breakfast; consuming whole grains, fruits, and high-quality protein; and consuming sweets and beverages in moderation is critical for lowering the prevalence risks of obesity, hypertension, and hypertriglyceridemia, especially for people in SPH with low KHEI values.
This study has several limitations. First, as this is a cross-sectional study, a causal relationship between KHEI and chronic conditions could not be inferred. Second, while conducting the subgroup analysis, the number of samples in the SPH group was too small, so the sample size of the subjects was different between the groups. Third, the results of the simple analysis were presented without adjusting for confounding factors such as the differences in blood profiles, nutrient intakes, and KHEI scores. However, this study presented the results by adjusting for potential confounding factors in the relationship between chronic conditions and KHEI in middle-aged Koreans according to the size of their households. Despite these limitations, this study had several strengths. This is the first study to recognize the relationship between diet quality based on the KHEI and chronic conditions according to household size in a nationally representative sample of Koreans. The recent increase in middle-aged people living in SPH has resulted in differences in dietary lifestyles and habits among both young and elderly people; thus, it is necessary to establish policy-level measures that consider and include these characteristics. Specifically, interventions such as providing breakfast to improve the quality of diet among men in SPH or education for healthy eating behavior such as the intake of a variety of foods are needed. As this study analyzed representative data from the KNHANES, the results could provide basic data for the improvement of dietary lifestyle according to the characteristics of middle-aged adults in SPH.
This study showed the association between KHEI scores and chronic conditions in middle-aged adults according to household size and gender based on data from KNHANES 2016–2018. The results of this study revealed that middle-aged women showed no differences in their total KHEI scores and did not show a relationship between the risk of chronic conditions and their household size. When compared with middle-aged men in MPH, men in SPH had a low obesity risk and an overall low-quality diet, including lower energy intake; total KHEI score; and intake of whole grains, fruits, and protein food, as well as higher sweet and beverage intakes. In addition, when the quality of diet according to the KHEI decreased, the risk of chronic conditions increased in both middle-aged men and women in SPH and MPH. A decline in the quality of diets resulted in an increased risk of chronic conditions among individuals in SPH compared to those in MPH. Specifically, men seem to be more affected by eating habits according to household size. Therefore, targeted active interventions (e.g., providing breakfast, or education for healthy eating behavior) are needed in the dietary lifestyle, specifically of men in SPH to lower the prevalence risks of obesity and hypertriglyceridemia.
 XML Download