

 PDF
PDF Citation
 Print
Print


INTRODUCTION
Increasing studies have revealed a strong association between a varied diet rich in fruit and vegetables with the healthy development of children [123456]. In contrast, unhealthy eating habits are typically related to finicky eating habits with low vegetable consumption and less variety in the diet [789].
The feeding characteristics during infancy affect the formation of eating habits in later childhood and act as an important basis for eating habits during adolescence. Children aged 4 to 7 yrs with a total breastfeeding duration of 12 mon or more consumed vegetables 5–6 times per week [10]. In addition, evidence suggests that infants breastfed for 4–6 mon tend to consume more fruit and vegetables in the first 2 yrs of life and eat a wider variety when they are aged 6–8 yrs [111213]. On the other hand, these studies showed that early introduction to complementary foods before 4 mon was associated with finicky eating habits involving food neophobia and a limited variety of foods [914]. This correlates with dietary diversity because children with fussy eating habits tend to be reluctant to eat, and the intake of other food groups, such as macronutrients, is low [7]. Some studies have estimated that the greater variety of flavors in breastfeeding helps improve the child’s willingness to try new foods during complementary feeding in later life [1011121516]. In contrast, the composition of formula feeding with an unchanging flavor profile is related to the decreased acceptance of flavor and food variety [2].
Although several studies have reported the value of fruit and vegetable consumption and dietary variety in the feeding factors for children, there is little evidence of an association with the feeding characteristics, such as breastfeeding and formula feeding practices and duration, and the timing of introducing breastfeeding and formula feeding. Therefore, this study examined the association of the feeding characteristics and 3 important dietary factors with the consumption of fruits and vegetables and dietary variety and assessed the healthy eating habits of children.
SUBJECTS AND METHODS
Study subjects & data collection
The study subjects participated in surveys in the Korea National Health and Nutrition Examination Survey from 2013 to 2017 with 914 subjects. Those with a birth weight < 2.5 kg (60 subjects) and with missing data on the feeding questionnaire (6 subjects), total energy intake (2 subjects), and weight values (44 subjects) were excluded [217]. Eight hundred and two participants aged 2 to 3 yrs were included in the study. A questionnaire was used to collect information from their parents, such as the demographic characteristics, including age, gender, birth weight, household income, and childcare characteristics. The anthropometry assessments obtained were height, weight, body mass index (BMI), and other parameters. The dietary assessments were conducted using the 24-h recall with food consumption and portion size on the day before the survey by their parents. The nutrient intake was calculated from the daily consumption. The Institutional Review Board (IRB) of the Korea Centers for Disease Control and Prevention approved the study (IRB No. 2013-07CON-03-4C in 2013–2015; 2013-12EXP-03-5C in 2013–2015; 2018-01-03-P-A in 2013–2018), and all participants provided written informed consent.
Definition of feeding group
The feeding questionnaire contained 10 items reported by the parents. These items classified the feeding characteristics as breast and formula feeding, which included respondents (yes or no), duration (in months), and age of the first introduction (in months).
The feeding type was divided into 3 categories: ‘Exclusive breastfeeding,’ ‘Partial breast and formula feeding,’ and ‘Formula feeding,’ respectively. ‘Exclusive breastfeeding’ was defined by the respondents who reported the following: ‘never had formula feeding’ and ‘had breastfeeding.’ ‘Partial breast and formula feeding’ was defined by the respondents who reported the following: ‘had breastfeeding’ and ‘had formula feeding.’ ‘Formula feeding’ was defined by the respondents who reported the following: ‘never had breastfeeding’ and ‘had formula feeding.’
The total breast or formula feeding duration was calculated from the sum of the feeding duration from the following: ‘had breastfeeding’ or ‘had formula feeding’ [18].
The World Health Organization (WHO) recommends the duration of exclusive breastfeeding as no food or drink except for breastfeeding for the first 6 mon of life [1119]. Therefore, the definition of the duration of total feeding was classed into three categories using a reference: ‘less than 6 mon,’ ‘7–11 mon,’ and ‘more than 12 mon’ [17].
Definition of the fruit and vegetable groups and dietary diversity
The fruit and vegetable groups were composed of food items composed through 24-h recall data. To measure the consumption of fruits and vegetables, the groups were classified into 6 categories: ‘non-salted vegetables (NSV),’ ‘salted vegetables (SV),’ ‘fruits (F),’ ‘total vegetables (TV),’ ‘non-salted vegetables + fruits (NSVF),’ and ‘total vegetables + fruits (TVF)’ [23].
The ‘NSV’ group was defined as fresh, canned vegetables and juices consumed during the day, excluding kimchi and pickled vegetables [8]; the ‘SV’ group was defined as kimchi and pickled vegetables. The ‘F’ group was defined as fresh, canned, dried fruit, and juices consumed during the day [8]. The ‘TV’ group was a summation of the consumption of the vegetables, kimchi, and pickled vegetables group, and the ‘TVF’ group was a summation of the consumption of the total vegetables (TV) and fruit (F) group. The ‘NSVF’ group was a summation of the consumption by the non-salted vegetables and fruit group. The food groups were reported as g per day (g/day).
The overall dietary diversity was assessed by calculating the dietary variety score (DVS). The DVS was calculated from the food items composed through 24-h recall data, which was defined by counting the individual number of food items consumed during the day regardless of quantity. On the other hand, the 3 food items, such as drinks, powdered, and dried food items (30 g or less for drinks, 1 g or less for powdered and dried food items), were excluded from the DVS. When subjects consumed another food item, the DVS was increased by one score [2425].
The level of fruit and vegetable consumption and DVS was dichotomized as ‘Low’ and ‘High’ groups using the mean value: ‘TV group (< 78 g/day, ≥ 78 g/day),’ ‘NSV group (< 62 g/day, ≥ 62 g/day),’ ‘F group (< 175 g/day, ≥ 175 g/day),’ ‘NSVF group (< 237 g/day, ≥ 237 g/day),’ ‘TVF group (< 253 g/day, ≥ 253 g/day),’ and ‘DVS group (< 55 g/day, ≥ 55 g/day).’
Statistical analysis
All statistical analyses were conducted using PROC SURVEY in SAS software (version 9.4; SAS Institute, Cary, NC, USA) for the complex sampling design of multistage, stratified, clustered samples, and appropriate sampling weights for the national survey [262728]. The subjects for the feeding factors were estimated by descriptive statistics (mean or proportions) to analyze the differences between the children’s gender (boy/girls) and feeding factors. A χ2 test was used to compare the proportions of categorical variables between the feeding types. The mean of the continuous variables between feeding types was estimated using a generalized linear regression model followed by a Scheffe’s multiple comparison test.
The odds ratio (OR) and 95% confidence interval (CI) were estimated using multivariable logistic regression to determine the association of the feeding characteristics with the consumption of fruit and vegetables and the DVS. Multivariable logistic regression analysis was performed after adjusting for the children’s variables. P-values < 0.05 were considered significant. Most values were truncated to one decimal place without rounding.
RESULTS
General characteristics according to feeding types
Table 1 lists the participants’ feeding types as the mean or numbers and percentages, stratified into exclusive breastfeeding, partial breast and formula feeding, and exclusive formula feeding. A borderline significant difference in the general variables was observed among the participants according to the feeding type. Participants with exclusive formula feeding were more likely to report a higher BMI than the other groups. Regarding the type of care, participants with partial breast and formula feeding were more likely to report a higher rate for the care center than the other groups.
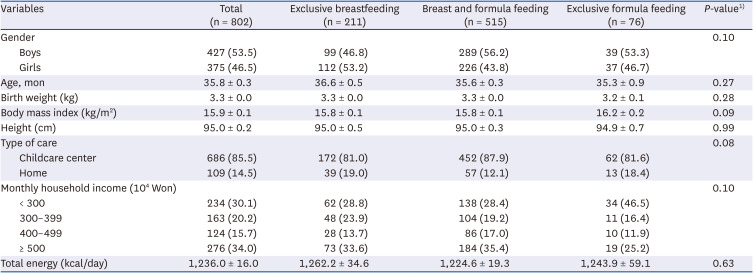
Table 1
General characteristics according to the feeding types
Data of this table indicate the mean ± SE or the number of subjects and its percentage (%).
1)Generalized linear regression and χ2 test were used to assess the significance of the difference in the subject distribution in continuous and categorical variables.
![]()
Supplementary Table 1 lists the participants’ feeding factors as the mean or number and percentage according to gender (boy/girls). In terms of the feeding type, participants with formula feeding were more likely to be boys. No significant difference was observed in the other variables.
Dietary variety and fruit and vegetable intake according to feeding types
Regarding the DVS and the fruit and vegetable intake (Table 2), exclusive formula-fed infants tended to have a lower DVS than exclusively breastfed infants. Participants with exclusive breastfeeding were more likely to report TV consumption than the partial breast and formula feeding groups. In addition, participants with exclusive breastfeeding were more likely to report a higher NSV than the partial breast and formula feeding groups. No significant difference was observed in the other variables.
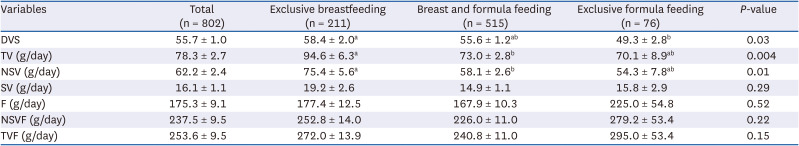
Table 2
Dietary variety and fruit and vegetable intake according to the feeding types
Data from this table indicate the mean ± SE.
DVS, dietary variety score; TV, total vegetables; NSV, non-salted vegetables; SV, salted vegetables; F, fruit; NSVF, non-salted vegetables + fruit; TVF, total vegetables + fruit.
a,bThe significant differences were assessed by generalized linear regression, followed by a Scheffe's multiple comparison test.
![]()
Association of the feeding characteristics with fruit and vegetable consumption and dietary variety
The association of the feeding characteristics with the fruit and vegetable consumption for the TV, NSV, F, NSVF, and TVF groups and the DVS was analyzed using logistic regression. The low/high scores of the mean level of fruit and vegetable consumption were measured by categorizing the subjects into 2 scores: low (< mean) and high (≥ mean) (Table 3). Compared to the feeding type of exclusive breastfed children, exclusive formula-fed children had a significant association with a lower DVS (OR, 0.42, 95% CI, 0.23–0.77). In addition, compared to the duration of total breastfeeding for 6 mon or less, the greater duration of breastfeeding for 12 mon had a significant association with a higher intake of NSVF and TVF (OR, 1.85, 95% CI, 1.20–2.85 and OR, 1.89, 95% CI, 1.22–2.92). A borderline significance in fruit consumption was observed compared to the total breastfeeding duration of 6 mon or fewer. A greater duration of breastfeeding for 12 mon had an association with a higher intake of fruit (OR, 1.52, 95% CI, 1.02–2.27). On the other hand, the early introduction of formula feeding for 4 mon had a significant association with a lower intake of F and NSVF (OR, 0.59, 95% CI, 0.38–0.91 and OR, 0.63, 95% CI, 0.40–0.99).
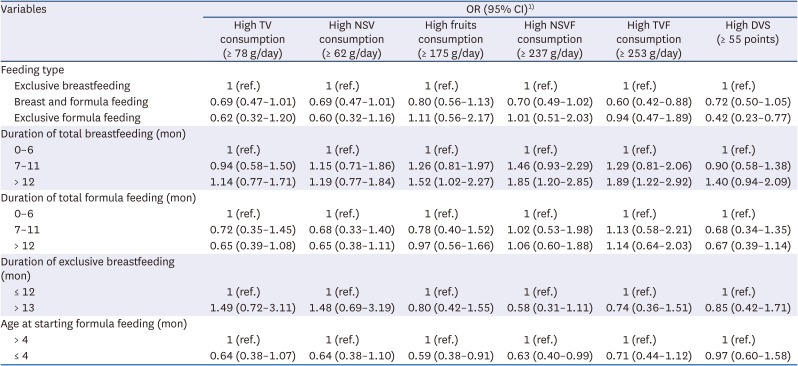
Table 3
Association of the feeding characteristics with fruit and vegetable consumption and dietary variety
OR, odds ratio; CI, confidence interval; DVS, dietary variety score; TV, total vegetables; NSV, non-salted vegetables; NSVF, non-salted vegetables + fruit; TVF, total vegetables + fruit.
1)Adjusted for age, gender, birth weight, household income, education level, total energy.
![]()
DISCUSSION
Breastfeeding is associated with higher fruit and vegetable consumption and dietary variety, whereas formula feeding is associated with lower fruit and vegetable consumption and dietary variety. Accordingly, it will be possible to suggest important factors for healthy infant feeding characteristics in early infancy and healthy eating habits in childhood.
Previous studies suggested the major predictors of children’s healthy eating habits, including adequate dietary quality, i.e., a variety of food groups. This suggests that healthy dietary factors, such as high levels of fruit and vegetable consumption, are associated with a greater variety of diets. In contrast, the lower fruit and vegetable consumption in unhealthy eating habits is associated with a less varied diet [9182930]. According to previous studies, the following 5 food categories were evaluated to assess the association between breastfeeding and dietary diversity: vegetables, fruit, meat and fish, grains and starches, and sweets. A longer duration of breastfeeding was associated with increased dietary variety for vegetables and decreased dietary variety for sweets [2]. On the other hand, longitudinal studies have reported that formula feeding in 14-month-old Australian children was inversely associated with the variety of fruit and vegetables, causing food neophobia because of the reducing acceptance of new foods at 24 mon [30].
Breastfeeding is an interaction that forms a strong link between the mother and infant in the extra-uterine environment, which is similar to the placental link between the mother and fetus before birth [3132]. According to the WHO, exclusive breastfeeding is recommended for 6 mon, and the introduction of complementary foods should be delayed until 6 mon of age [720]. Nevertheless, it is unclear if the early introduction of complementary foods has a positive influence. This is because the developmental readiness of an infant is influenced by the time when complementary foods are introduced [33]. Some studies explained that food acceptance might be influenced by prenatal and postnatal exposures to flavors through the amniotic fluid and breast milk. On the other hand, the formula product has a constant, unchanging flavor profile [21534]. This might be explained by children who breastfeed for longer being exposed to a greater variety of flavors early in life through breastfeeding [35]. Nevertheless, there is little data on the rates of breastfeeding, formula feeding, and the timing of introducing solids to infants.
In summary, this study examined the association between fruit and vegetable consumption and evaluated the dietary variety according to the feeding characteristics of children. On the other hand, this study had several limitations. The generalizability of these associations cannot be inferred owing to the cross-sectional data analysis. In addition, individuals who consume grams per day also consume a weekly frequency of fruit and vegetables. Furthermore, there were no maternal factors according to the feeding characteristics in this study. In interpreting the findings from studies of feeding characteristics and children’s eating habits, maternal dietary choices cannot fully explain the association. Nevertheless, this study analyzed the actual feeding durations through research using data from a large sample in Korea. Hence, the early feeding characteristics play an important role in selecting healthy eating habits for children, such as fruit and vegetable consumption and dietary variety. Moreover, the first few years of life are a critical period for the development of food-acceptance patterns and should be considered when developing nutrition education programs to lead children to develop healthy eating habits of eating a variety of foods.
 XML Download