

 PDF
PDF Citation
 Print
Print


INTRODUCTION
The Korea National Health and Nutrition Examination Survey (KNHANES) reported that the prevalence of diabetes in Koreans over the age of 30 was 8.9% in 2001, 9.1% in 2005 [1], and 11.8% in 2019 [2]. In 2020, diabetes caused a total of 8,456 deaths in Korea, which was the sixth highest cause after cancer, heart diseases, pneumonia, cerebrovascular disease, and intentional self-harm [3]. According to the International Diabetes Federation, the global prevalence of diabetes (based on the age of 20–79) is estimated to increase from 537 million in 2021 to 783 million in 2045. Medical expenditure due to the rise in diabetes is estimated at USD 966 billion dollars per year [4].
A key strategy for diabetic patient management is to reach and maintain glycemic control goals and prevent the occurrence of diabetic complications and slow disease progression with drug treatment, exercise, dietary, and lifestyle modifications [5]. Understanding nutritional information is necessary for healthy eating to make rational choices by identifying food ingredients according to the health status. Diet control, one of the basic methods of managing diabetes, aims to achieve metabolic control by selecting healthy foods [6].
With the enforcement of the US Nutrition Labeling and Education Act of 1994, nutritional information for most packaged foods became mandatory; the nutrition panel has a standardized format with information on total calories and nutrients such as saturated fat, cholesterol, and sodium [7]. In Korea, nutrition labeling was also introduced in 1994 and became compulsory for special purpose foods, health supplements, and nutritional emphasized foods. In 2006, the “Serving Size System” was introduced to the nutritional component labeling unit, and, in 2010, the provision of nutritional information became compulsory for some restaurant menus such as fast food [8].
Previous studies have demonstrated the usefulness of nutrition labeling to help control diet. Studies evaluating the effect of front-of-package nutrition labeling on food purchases reported that it was effective for helping people make healthier food purchase decisions [9]. People using nutrition labeling tended to eat a low-fat diet [10] with high fruit and vegetable intake [11]. Traffic-light nutrition labels could reduce intake of calories, fat, and sodium [12]. With regard to related factors of nutrition labeling use when selecting processed foods for chronically ill patients, both women and men showed higher rates of use of nutrition labeling [13]. Using the US National Health and Nutrition Examination Survey data, people with diagnosed diabetes were more likely to use nutrition facts label for daily food purchase compared with those without diabetes [14]. A previous study with a representative sample of New York City adults showed that hypertension was associated with the nutrition fact label use for sodium information [15]. Korean adults who read nutrition labels were younger, leaner, less likely to be alcohol drinkers or current smokers, and had a lower prevalence of metabolic syndrome [16].
Although labels contain much nutritional information, few studies have investigated various aspects related to the degree of nutrition labeling utilization, such as the awareness, use, and effect on food selection in Korea. There were limited evidence addressing the utilization of nutrition labels focusing on patients with diabetes, including the clinical characteristics of diabetic patients such as disease duration and treatment status. This investigation attempted to identify the utilization status of nutrition labeling according to general characteristics, health-related characteristics, and diabetes-related characteristics for Korean diabetic patients using data from the 7th KNHANES.
Go to : 
MATERIALS AND METHODS
Data source and study population
This study used the data from the 7th KNHANES (2016–2018). The survey aims to produce representative and reliable statistics on the health status, health behavior, and nutritional status of the Korean people. The most recent available population and housing census data at the time of sampling design were used as a sampling frame. A stratified cluster sampling method was used, and city/province, dong/eup/myeon, and housing type (general house/apartment) were used as stratification variables. Twenty households were selected per area using the systematic sampling method. Annually, 192 sample areas and 4,416 households were selected, and the survey was conducted from January to December targeting household members aged ≥ 1 yr [17]. The KNHANES was approved by the institutional review board of the Korea Centers for Disease Control and Prevention (2018-01-03-P-A) and informed consent was obtained from all participants.
A total of 24,269 people participated in the 7th KNHANES (8,150 people in 2016, 8,127 people in 2017, and 7,992 people in 2018). Among them, 19,389 were adults aged ≥ 19 yrs and 1,809 had been diagnosed with diabetes by a doctor. Among them, 222 were excluded due to missing values of nutrition label utilization, and 1,587 people were selected as study subjects.
Variables
General characteristics included gender (men, women), age (< 65 or ≥ 65), residence (urban or rural), marital status (married or single), monthly household income (low, middle-low, middle-high, or high). Monthly household income was divided into quartiles.
Health-related characteristics included drinking frequency (none, ≤ 4/mon, or ≥ 2/wk), smoking status (current smoking, past smoking, or none), walking days (none, < 4 days, or ≥ 4 days), sleep time (< 6 h or ≥ 6 h), family history of diabetes (no or yes), and number of chronic disease (none, 1, or ≥ 2). Family history of diabetes was defined as those in which at least one of the parents or siblings was diagnosed with diabetes. Number of chronic diseases was defined as physician diagnosis history of hypertension, dyslipidemia, stroke, heart disease, osteoarthritis, rheumatoid arthritis, and cancer.
Diabetes-related characteristics included age at diagnosis (< 45 or ≥ 45 yrs), disease duration (< 10 or ≥ 10 yrs), fasting blood sugar level (< 126 or ≥ 126 mg/dL), hemoglobin A1c (< 6.5%, ≥ 6.5%), meal therapy (no, yes), treatment of diabetes (none, insulin treatment, drug or non-drug treatment), and fundus examination (no, yes). Age at diagnosis was divided at years since 45 yrs was known to be a high risk group for diabetes [18], and the disease duration was divided at 10 yrs because the risk of cardiovascular disease was significantly increased after 10 yrs of diabetes diagnosis [19]. Blood samples were collected from the participants fasting after dinner the day before the survey. Fasting blood sugar level was measured using hexokinase UV with a Hitachi Automatic Analyzer 7600-210 (Hitachi, Tokyo, Japan). HbA1c level was analyzed high performance liquid chromatography with a Tosoh G8 (Tosoh, Tokyo, Japan). Meal therapy was defined as a “yes” answer to the question, “Are you controlling your diet for a specific reason?” Fundus examination was defined as a “yes” answer to the question “Have you had an eye examination in the past year to determine whether diabetes-related eye complications have occurred?”
The utilization of nutrition label included awareness (no, yes), use (no, yes), and effect on fool selection (no, yes). Awareness of nutrition labels was defined as a “yes” response to the question “Are you aware of nutrition labeling?” The use of nutrition labels was defined as “yes” response to the question “Do you read nutrition labels when buying or choosing processed foods?” The nutrition label effect on food selection was defined as a “yes” response to the question “Does nutrition labeling affect food selection?”
Analysis
SPSS version 26 (IBM Corp., Armonk, NY, USA) was used for statistical analyses. The characteristics of the study subjects are presented as frequencies and percentages. Chi-square tests were performed to analyze the relationships between subjects' general characteristics, health-related characteristics, diabetes-related characteristics, and nutrition label utilization. Finally, multiple logistic regression analysis was performed to analyze the relevant factors that had a significant effect on the awareness, use, and effect of nutrition labels on food selection, including general characteristics, health-related, and diabetes-related characteristics. Differences were considered significant at P < 0.05.
Go to :
RESULTS
Utilization of nutrition label according to general characteristics
Of the total 1,587 participants, 52.3% were women, and 61.6% were 65 yrs of age or older. And 73.9% lived in urban areas, and 41.1% were responded as low-income level. A total of 48.8% of subjects were aware of nutrition labels, 11.4% used them, and 9.6% were influenced by nutrition labels for food selection. According to the general characteristics, 70.5% were < 65 yrs, 35.2% were ≥ 65 yrs (P < 0.001); 52.5% of participants in cities and 38.3% of participants in rural areas were aware of nutrition labels (P < 0.001). Among the subjects, 14.8% of women and 7.7% of men (P < 0.001), 20.8% of < 65 yrs, and 5.5% of over ≥ 65 yrs (P<0.001) used nutrition labels for food selection. Approximately 13.1% of women and 5.7% of men (P < 0.001), 17.9% of < 65 yrs, and 4.4% ≥ 65 yrs (P < 0.001) were affected by nutrition labels for food selection (Table 1).
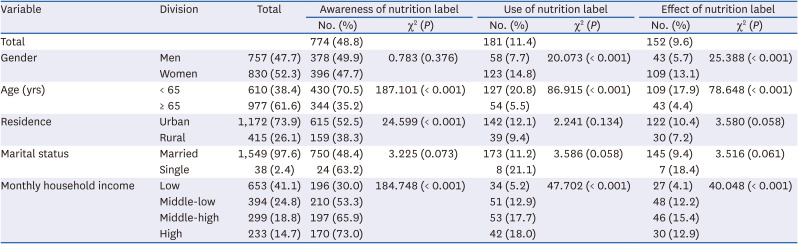
Table 1
Utilization of nutrition label according to general characteristics
![]()
Utilization of nutrition label according to health-related characteristics
According to health-related characteristics, the proportions of nutrition label awareness were 57.7% for those who drank < 4 times a month, 47.5% for those who drank > 2 times a week, and 42.4% for non-drinkers (P < 0.001). Nutrition labels were recognized by 50.0% of those with ≥ 6 h of sleep and 43.7% of those with < 6 h (P < 0.047), 57.9% of those with a family history of diabetes, and 43% of those without (P < 0.001). The proportions of nutrition label use were 14.6% for those who walked ≥ 4 days, 13.1% for those who walked < 4 days, and 5.6% for those who did not walking (P < 0.001); the rates were 13.5% and 10.1% in those with and without a family history of diabetes, respectively (P = 0.037). The proportions of nutrition label effects on food choice were 12.6% in those who drank ≥ 4 times a month, 8.3% in those who drank < 4 times a month, 7.0% in those who drank > 2 times a week (P = 0.008), and 11.4% in non-smokers, 7.9% in smokers, and 6.9% in former smokers (P = 0.020). Overall, 11.5% and 8.3% of those with and without a family history of diabetes, respectively, had their food selection choices influenced by nutrition labels (P = 0.034) (Table 2).
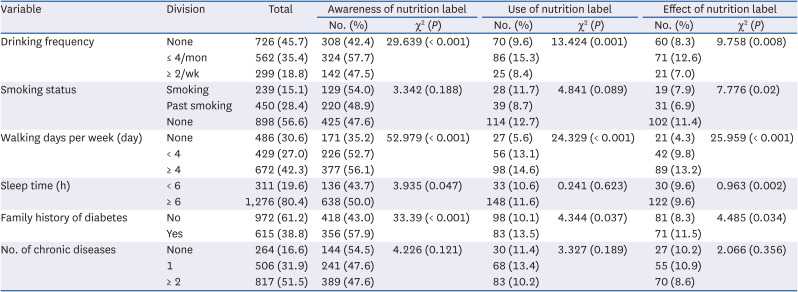
Table 2
Utilization of nutrition label according to health-related characteristics
![]()
Utilization of nutrition label according to diabetes related characteristics
According to diabetes-related characteristics, the proportions of nutritional label awareness were 70.9% in those diagnosed at < 45 yrs and 44.8% in those who were diagnosed ≥ 45 yrs (P < 0.001), and 53.5% in those with diabetes < 10 yrs and 43.1% in those with diabetes ≥ 10 yrs (P < 0.001). Nutrition labeling was recognized in 55.3% of those with meal therapy and 43.6% of those without (P < 0.001), 57% of those who had a fundus examination in the last year and 45.4% in those who did not (P < 0.001). The proportions of nutritional label use were 23% in those diagnosed with diabetes at < 45 yrs of age and 9.3% in those ≥ 45 (P < 0.001), and 14.7% in those with diabetes < 10 yrs and 7.3% in those with diabetes ≥ 10 yrs (P < 0.001). The proportions of nutrition label effect on food selection were 19.3% in those diagnosed with diabetes before age 45 and 7.8% in those diagnosed after age 45 (P < 0.001), and 12.4% in those with diabetes < 10 yrs and 6% in those with diabetes ≥ 10 yrs (P < 0.001). The rates of subjects who selected food based on nutritional label information were 14.6% in those with meal therapy and 5.6% without (P < 0.001), and 14.5% in those with a fundus examination in the previous year, and 7.6% in those without one (P < 0.01) (Table 3).
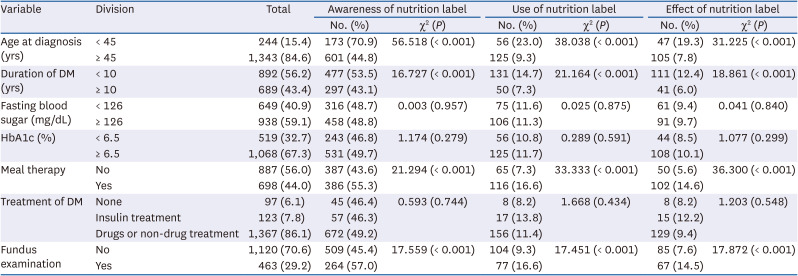
Table 3
Utilization of nutrition label according to diabetes related characteristics
![]()
Related factors with utilization of nutrition label among patients with diabetes
Table 4 presents the related factors to nutritional label utilization using multiple logistic regression analysis. The adjusted odds ratios (aORs) for nutrition label awareness were significantly higher in those with high monthly income (aOR, 4.77, 95% confidence interval [CI], 3.32–6.86), those who walked ≥ 4 days a week (aOR, 1.69, 95% CI, 1.28–2.22), those with a family history of diabetes (aOR, 1.40, 95% CI, 1.11-1.77), those diagnosed before 45 yrs of age (aOR, 2.84, 95% CI, 1.98–4.07), and those with the duration of diabetes < 10 yrs (aOR, 1.54, 95% CI, 1.19–1.94). The aORs for nutrition label use were significantly higher in women (aOR, 4.90, 95% CI, 2.72–8.83), those with high monthly income (OR, 3.08, 95% CI, 1.81–5.24), those diagnosed before age 45 (aOR, 3.27, 95% CI, 2.09–5.12), those with diabetes < 10 yrs (aOR, 2.68, 95% CI, 1.77–4.06), those with meal therapy (aOR, 2.18, 95% CI, 1.52–3.12), and subjects who had a fundus examination (OR, 1.62, 95% CI, 1.13–2.34). The aORs for nutrition label effect on food choice were significantly higher in women (aOR, 5.09, 95% CI, 2.68–9.68), those with high monthly income (aOR, 2.38, 95% CI, 1.31–4.33), those diagnosed before age 45 (aOR, 2.93, 95% CI, 1.81–4.73), those with diabetes < 10 yrs (aOR, 2.81, 95% CI, 1.79–4.43), those with meal therapy (aOR, 2.45, 95% CI, 1.65–3.64), and those who had a fundus examination (aOR, 1.74, 95% CI, 1.18–2.58) (Table 4).
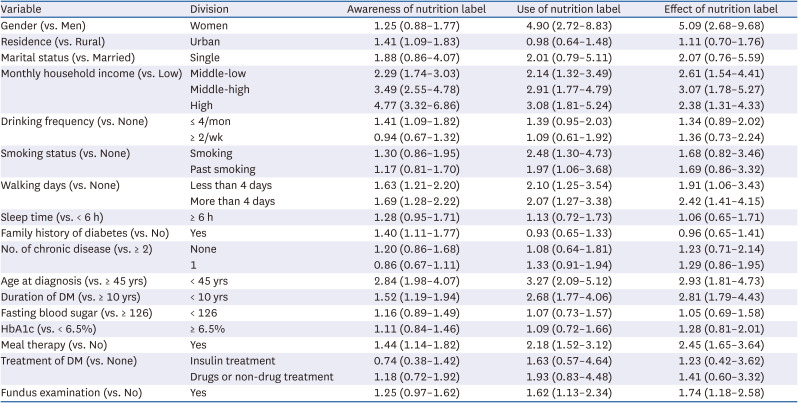
Table 4
Related factors with utilization of nutrition label among patients with diabetes
Data were expressed as adjusted odds ratio (95% confidence interval).
DM, diabetes mellitus; HbA1c, hemoglobin A1c.
![]()
Go to :
DISCUSSION
The appropriate management of diabetic patients requires medication, appropriate eating habits, and a healthy lifestyle. This study was conducted to understand the current status and related factors on nutrition label awareness, use, and their effect on food selection in Korean diabetic patients using data from the 7th KNHANES. The proportions of nutrition label awareness, use, and effect on food selection were 48.8%, 11.4%, and 9.6%, respectively, and nutrition label utilization among diabetic patients was low at < 50% in Korea. According to 2016–2018 KNHANES data, the proportions of nutrition label awareness, use, and effect on food selection were 68%, 22.8%, and 18.3% in adults ≥ 19 yrs. Therefore, nutrition label utilization was lower in patients with diabetes compared to the general adult population.
In a study using data from the 2005–2006 US National Health and Nutrition Examination Survey, the proportion of nutritional label awareness and use among adults with type 2 diabetes, hypertension, and hyperlipidemia was 71.2% compared to 59.9% in adults without disease [20]. In the US, nutritional label information displayed in images rather than text might contribute to the influence on food selection [21]. Although graphical nutrition labeling on the front of Korean processed food packages was made possible in 2009 [22], most nutrition labels are presented only in text. This might make it difficult to recognize or use them quickly due to literacy, numerical value confusion, and other problems. It is therefore necessary to discuss easy-to-understand nutrition labeling so that consumers can use them more easily when choosing food [222324].
Nutritional label awareness, use, and effect on food selection were higher in women than men in this study. This is similar to a previous report that nutrition label use was higher in women compared to men [25]. This may be because women mainly purchase food in the household, and women might be more interested in their body shape and weight control than men [26]. With regard to age, the proportions of nutrition label awareness, use, and effect on food selection were lower in subjects ≥ 65 yrs. Elderly people might lack access to information on nutrition labels or not fully understand them [2728]. There is a need for a nutritional labeling method that is easy to understand and easily communicated to all age groups in consideration of the cognitive abilities and visual acuity of the elderly.
Subjects with lower incomes were less likely to utilize nutrition labels. In previous studies, people who had a larger household income or higher education level were more likely to use nutrition labels [2529]. Also, according to previous studies, people with higher incomes who were more educated were more likely to use nutrition information to choose food. It is known that low income levels, price, taste, and food safety are considered more than health and nutritional importance when making food selections [3031].
Among the health-related characteristic factors, fewer walking days per week was associated with lower use of nutrition labeling. Healthy behaviors were positively associated with other health behaviors [32]. It is thought that people who walk have a higher interest in health and use nutrition labeling in relation to food selection.
Among the diabetes-related characteristics, nutrition label use was lower in those who were diagnosed with diabetes after age 45 and those with disease duration > 10 yrs. In studies with type 2 diabetes, age at diagnosis and diabetes duration were independently associated with macrovascular complications and death [3334]. Because the risk of complications increases when longer duration of diabetes, it is necessary to increase the level of utilization of nutrition labeling to promote good eating habits of patients, particularly those who diagnosed diabetes at older age and have longer duration of disease.
Those conducted a fundus examination in the previous year reported high nutrition label utilization. Diabetic retinopathy is a frequent complication of diabetes, and fundus examination is one of the recommended tests for the detection of diabetic complications. Previous studies reported that meeting diabetes care professionals was an independent predictor for undertaking a fundus examination [3536]. And those who did not receive meal therapy reported low nutrition label utilization. In a previous study of patients with hypertension or diabetes mellitus, those who listened to, practiced, or received nutrition education had a higher rate of use of nutrition labeling [13]. Such programs might include nutrition label education to help guide food selection. Nutrition labeling use was 50% higher when patients with type 2 diabetes, hypertension, or hyperlipidemia were advised to reduce calories by a doctor or other health professional than when they did not receive recommendations [20]. People using nutrition labeling information improved their eating habits by consuming less saturated fat, carbohydrates, and sugar and consuming more fiber [1220]. People with chronic diseases were more aware of nutritional recommendations, and used nutrition labels [37]. Therefore, the use of nutrition labeling as a means of paying attention to health and practicing good eating habits will help diabetic patients properly manage their meals.
The major limitation of this work is that KNHANES is a cross-sectional study; while we were able to identify factors related to nutrition label utilization, we were unable to define a causal relationship. Secondly, food selection and nutritional intake were not investigated. If these aspects are assessed in the future, it would inform the effect of the use of nutrition labels on the nutritional status and food intake of diabetic patients. Third, the KNHANES did not distinguish between type 1 and type 2 diabetes. Since the prevalence of type 1 diabetes in Korea is relatively low [38], most of the patients in this study would have type 2 diabetes. And nutrition management for diabetic patients would be important regardless of the type.
This study identified the utilization status of nutrition labeling among patients with diabetes in Korea using representative and reliable data. Patients with a high income, those who walk multiple times per week, those diagnosed with diabetes at a young age, those with a short disease duration, and those on meal therapy were more likely to utilize nutrition labels. Our findings can be used to set the direction for improving the nutrition labeling system for patients with diabetes and to plan nutrition label use for health care professionals to manage the health of patients with diabetes.
Go to :
 XML Download