Journal List > Nutr Res Pract > v.17(2) > 1516082198

Hyun, Choi, Heo, Ro, Han, and Lee: Comparison between 24-hour diet recall and 24-hour urine collection for estimating sodium and potassium intakes and their ratio among Korean adults

Abstract

BACKGROUND/OBJECTIVES

This study aimed to compare 24-h diet recall (DR) and 24-h urine collection (UC) for estimating sodium and potassium intakes and their ratio (Na/K), identifying factors associated with sodium and potassium intakes and Na/K, and identifying those who were likely to underestimate sodium and potassium intakes by DR.

SUBJECTS/METHODS

A total of 640 healthy adults aged 19–69 yrs completed a questionnaire survey, salty taste assessment, anthropometric measurement, two 24-h DRs, and two 24-h UCs.

RESULTS

The mean sodium and potassium intakes and Na/K were 3,755 mg/d, 2,737 mg/d, and 1.45 according to DR, and 4,145 mg/d, 2,812 mg/d, and 1.57 according to UC, with percentage differences of −9.4%, −2.7%, and −7.6% in the values between the two methods, respectively. Men, older adults, smokers, obese individuals, those who consumed all the liquid in the soup, and those who were found to be salty in the salty taste assessment consumed significantly more sodium; older adults, the heavy- activity group, and obese individuals consumed more potassium; and men, younger adults, smokers, and obese individuals had a significantly higher Na/K, according to UC. Compared with UC, DR was more likely to underestimate sodium intake in older adults, smokers, obese individuals, those who consumed all the liquid in the soup, and those who consumed eating-out/delivery food at least once a day, and potassium intake in older adults, the heavy-activity group, and obese individuals.

CONCLUSIONS

The mean sodium and potassium intakes and Na/K estimated by DR were comparable to those measured by UC. However, the association of sodium and potassium intakes with sociodemographic and health-related factors showed inconsistent results when estimated by DR and UC. Factors influencing the underestimation of sodium intake by DR compared to UC should be further investigated.

INTRODUCTION

High sodium and low potassium diets and a high dietary sodium-to-potassium ratio (Na/K) are associated with hypertension [12], which is a major risk factor for cardiovascular disease, stroke, kidney disease, dementia, and premature death [3456]. Therefore, reducing sodium consumption and increasing potassium consumption are essential for preventing chronic diseases [7].
The 24-h urinary excretion of sodium and potassium is regarded as the gold standard for measuring sodium and potassium intakes accurately and is often used to validate dietary assessment [89]. However, considering the substantial burden and difficulty of complete urine collection (UC), 24-h diet recall (DR) was used to estimate sodium and potassium intakes in a representative Korean population in the Korea National Health and Nutrition Examination Survey (KNHANES).
DR can collect dietary information that is not available from UC [89]. The food sources of sodium and potassium can be identified, and the total energy intake can be estimated using DR. However, it also has several limitations. First, respondents may change their reported information about what they ate, either because of poor memory or on purpose. Second, an inaccurate nutrient database can lead to measurement errors. Sodium content varies greatly depending on the amount of salt used for cooking and at the table; hence, sodium intake is particularly difficult to measure.
In a systematic review, 24-h DR inaccurately measured an individual’s sodium intake compared with 24-h UC and was likely to underestimate intake, especially at a higher level of urinary excretion [10]. However, the 24-h DR used in the NHANES in the USA was useful for estimating sodium intake at the population level compared with 24-h UC [11]. According to the study [11], the reporting accuracy, which was defined as the ratio of DR-estimated sodium intake to UC-estimated sodium intake, was 0.93, 0.90, and 1.02 in men, women, and the body mass index (BMI) < 25 kg/m2 group, respectively. However, it was 0.78 in the BMI > 30 kg/m2 group; thus, DR greatly underestimated sodium intake in obese individuals. Sodium intake based on UC increases with BMI [121314], but results on the association between DR-based sodium intake and BMI are inconsistent [131516].
Sodium intake underestimation by DR in a certain group or inconsistent results on the factors associated with sodium intake when estimated by DR and UC might be caused by underreporting of food intake or certain eating behaviors, which are likely to be overlooked in DR. Although a few studies have tried to show that salt preference or the subjectively evaluated frequency of salty food intake is related to urinary sodium excretion, the relationship has not been demonstrated, partly because of the use of spot urine samples [1718].
Studies on sodium and potassium intakes and Na/K estimated by 24-h UC in a large sample of the Korean population are still limited. Only a few studies have compared the dietary intakes of sodium and potassium measured by 24-h DR and 24-h UC in relatively small Korean samples [1920]. Therefore, this study aimed to compare 24-h DR and 24-h UC for estimating sodium and potassium intakes and Na/K, identifying factors associated with sodium and potassium intakes and Na/K, and identifying those who were likely to underestimate sodium and potassium intakes by DR.

SUBJECTS AND METHODS

Study participants

A cross-sectional survey was conducted at eight research centers in four areas of South Korea (Seoul and the suburbs, Chungcheong, Gyongsang, and Jeolla) from May 2014 to April 2015, and 640 healthy adults aged 19–69 yrs were recruited. The exclusion criteria were as follows: diagnosis of diseases, such as hypertension, heart disease, diabetes, kidney disease, or cancer; medication or diet control; and pregnancy or lactation. All participants were informed of the study purposes and protocols, and they provided written informed consent prior to the start of the study. This study was approved by the Institutional Review Board of Kyungpook National University (IRB 2014-0053).

Questionnaire survey and salty taste assessment

A trained staff member conducted the questionnaire survey and salty taste assessment. Information on sociodemographic characteristics (sex, age, education, and monthly income), health-related habits (smoking and physical activity), and eating behaviors were collected. The two questions on eating behaviors related to high sodium intake were whether the participant consumes all the liquid in the soup and how often the participant eats out or consumes delivery food [2122]. Salty taste assessment was performed using an assessment tool developed by Shin et al. [23].

Anthropometric measurements

Body weight and height were measured to the nearest 0.1 kg and 0.1 cm, respectively, using weight- and height-measurement devices. BMI was calculated by dividing body weight (kg) by height squared (m2). Participants were classified into three BMI categories according to the Asia-Pacific criteria [24]: underweight or normal weight (< 23 kg/m2), overweight (23 to < 25 kg/m2), and obese (≥ 25 kg/m2).

Dietary assessment by 24-h DR

Two nonconsecutive 24-h DRs were conducted by a trained dietitian. One day before the interview, the participants recorded or photographed the foods they ate to improve their recall accuracy. Sodium and potassium intakes estimated by DR were analyzed using the Computer-aided Nutritional Analysis program (version 4.0, The Korean Nutrition Society). The mean daily energy and nutrient intakes were calculated from two 24-h DRs.

24-h UC and analysis

On the day following each DR, 24-h urine samples were collected. Participants were asked to collect all urine during a 24-h period after discarding the first urine of the day and to record a UC sheet. All urine samples were carefully mixed and the total urine volume was measured. Urine volume and creatinine concentration were assessed to validate the completeness of the 24-h UC. The colorimetric and indirect ion-selective electrode methods were used to measure creatinine concentration and urinary sodium and potassium concentrations, respectively. The detailed procedure has been previously reported [25]. The mean value of the two 24-h urine analyses was recorded as the individual’s excretion. Urinary sodium and potassium were converted into dietary intake by dividing their values by 0.86 and 0.77, respectively, based on the assumption that 86% of sodium and 77% of potassium consumed is excreted in the urine [26].

Statistical analysis

Data were analyzed using the Statistical Analysis Software (SAS, version 9.4; SAS Institute Inc., Cary, NC, USA). Data are expressed as frequency distributions or means and standard deviations where appropriate. The χ2 test was used to investigate the differences in the proportions of categorical variables, and an independent t-test or analysis of variance was performed for the differences in the mean energy intake between the groups of sociodemographic characteristics, health-related habits, and eating behaviors. Furthermore, differences in the mean sodium and potassium intakes and Na/K among the groups were tested by analysis of covariance after adjusting for potential confounding factors. When the differences were significant, individual means after adjustment were compared between groups using Tukey’s post hoc test. The correlations of sodium and potassium intakes and Na/K estimated by 24-h DR with those estimated by 24-h UC were examined using Pearson correlation analysis. Statistical significance was set at P < 0.05.

RESULTS

Characteristics of the participants

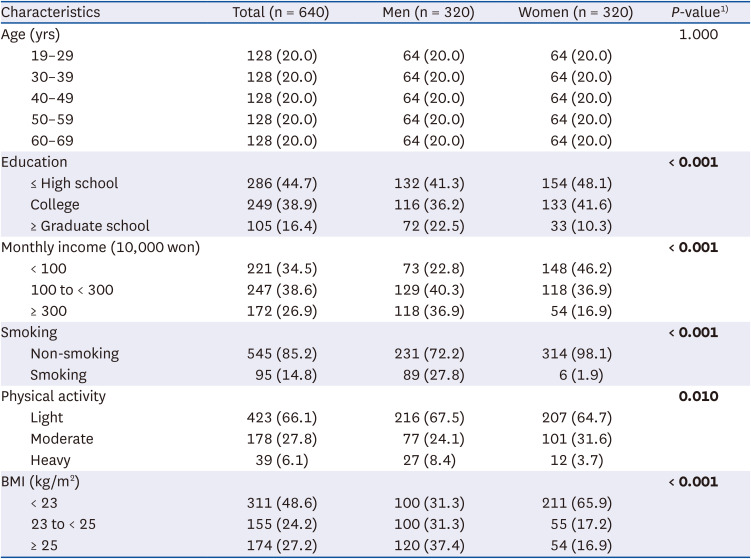
Table 1 lists the participant characteristics. Participants were equally distributed into 5 age groups. Approximately 45% were high school graduates or had a lower educational level, and 34.5% had an income of less than 1,000,000 won. Most (85.2%) were non-smokers and 66.1% engaged in light activities. Moreover, 49.5% had a BMI < 23.0 kg/m2, whereas 27.2% had a BMI ≥ 25 kg/m2. Education, monthly income, smoking, physical activity, and BMI were significantly different between men and women.
Table 1

Characteristics of the subjects

nrp-17-284-i001
Characteristics Total (n = 640) Men (n = 320) Women (n = 320) P-value1)
Age (yrs) 1.000
19–29 128 (20.0) 64 (20.0) 64 (20.0)
30–39 128 (20.0) 64 (20.0) 64 (20.0)
40–49 128 (20.0) 64 (20.0) 64 (20.0)
50–59 128 (20.0) 64 (20.0) 64 (20.0)
60–69 128 (20.0) 64 (20.0) 64 (20.0)
Education < 0.001
≤ High school 286 (44.7) 132 (41.3) 154 (48.1)
College 249 (38.9) 116 (36.2) 133 (41.6)
≥ Graduate school 105 (16.4) 72 (22.5) 33 (10.3)
Monthly income (10,000 won) < 0.001
< 100 221 (34.5) 73 (22.8) 148 (46.2)
100 to < 300 247 (38.6) 129 (40.3) 118 (36.9)
≥ 300 172 (26.9) 118 (36.9) 54 (16.9)
Smoking < 0.001
Non-smoking 545 (85.2) 231 (72.2) 314 (98.1)
Smoking 95 (14.8) 89 (27.8) 6 (1.9)
Physical activity 0.010
Light 423 (66.1) 216 (67.5) 207 (64.7)
Moderate 178 (27.8) 77 (24.1) 101 (31.6)
Heavy 39 (6.1) 27 (8.4) 12 (3.7)
BMI (kg/m2) < 0.001
< 23 311 (48.6) 100 (31.3) 211 (65.9)
23 to < 25 155 (24.2) 100 (31.3) 55 (17.2)
≥ 25 174 (27.2) 120 (37.4) 54 (16.9)
Values are presented as number (%). P-values calculated by χ2 test. Statistically significant P-values are in bold.
BMI, body mass index.

Sodium and potassium intakes and Na/K estimated by DR and UC

Table 2 presents the sodium and potassium intakes and Na/K estimated by DR and UC and the difference between the two methods. The mean sodium and potassium intakes and Na/K were 3,755 mg/d, 2,737 mg/d, and 1.45, respectively, according to DR, and 4,145 mg/d, 2,812 mg/d, and 1.57, respectively, according to UC. The mean differences in the intakes estimated by the two methods were −390 mg for sodium, −75 mg for potassium, and −0.12 for Na/K; the percent differences were −9.4%, −2.7%, and −7.6%, respectively. The Pearson correlation coefficients between the values of the two methods were 0.158 (P < 0.001), 0.325 (P < 0.001), and 0.359 (P < 0.001) for sodium, potassium, and Na/K, respectively.
Table 2

Sodium and potassium intakes and Na/K estimated by diet recall and urine collection (n = 640)

nrp-17-284-i002
Variables Sodium Potassium Na/K
Intake estimated by DR (mg) 3,755 ± 1,519 2,737 ± 1,014 1.45 ± 0.59
Urinary excretion (mmol) 155.0 ± 61.2 55.5 ± 20.6 2.97 ± 1.08
Urinary excretion1) (mg) 3,565 ± 1,408 2,166 ± 804 1.75 ± 0.63
Intake estimated by UC2) (mg) 4,145 ± 1,637 2,812 ± 1,045 1.57 ± 0.57
Mean difference3) (mg) −390 −75 −0.12
Percentage difference4) (%) −9.4 −2.7 −7.6
Correlation5) 0.158*** 0.325*** 0.359***
Values are presented as mean ± SD not otherwise specified.
DR, diet recall; UC, urine collection.
1)Urinary excretion = Na (mmol) × 23; K (mmol) × 39.
2)Intake estimated by UC = Na (mg)/0.86; K (mg)/0.77.
3)Mean difference = Intake estimated by DR – Intake estimated by UC.
4)Percentage difference (%) = {(Intake estimated by DR − Intake estimated by UC)/Intake estimated by UC} × 100.
5)Between the intake estimated by DR and the intake estimated by UC.
***P <0.001 by Pearson correlation analysis.

Sodium intake estimated by DR and UC according to various factors

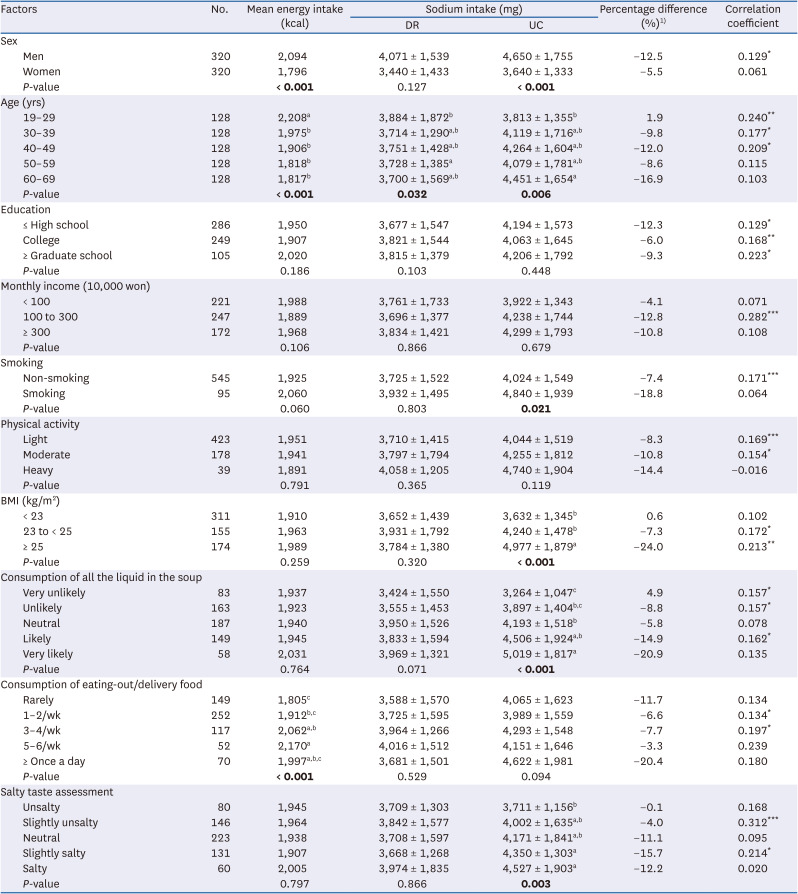
Table 3 presents the sodium intake estimated by DR and UC according to various factors. Energy intake was significantly higher in men, the 19–29 yrs age group, and the frequently eating-out/delivery food consumption group (5–6/wk). Sodium intake estimated by UC was significantly higher in men, older adults, smokers, and obese individuals than in women, the 19–29 yrs age group, non-smokers, and non-obese individuals, respectively, after adjusting for confounding factors. In addition, those who consumed all the liquid in the soup and those who were found to be salty in the salty taste assessment consumed higher sodium than the other groups when estimated by UC. However, DR-estimated sodium intake did not show any differences according to these factors, except for age.
Table 3

Sodium intake estimated by dietary recall and urine collection according to various factors

nrp-17-284-i003
Factors No. Mean energy intake (kcal) Sodium intake (mg) Percentage difference (%)1) Correlation coefficient
DR UC
Sex
Men 320 2,094 4,071 ± 1,539 4,650 ± 1,755 −12.5 0.129*
Women 320 1,796 3,440 ± 1,433 3,640 ± 1,333 −5.5 0.061
P-value < 0.001 0.127 < 0.001
Age (yrs)
19–29 128 2,208a 3,884 ± 1,872b 3,813 ± 1,355b 1.9 0.240**
30–39 128 1,975b 3,714 ± 1,290a,b 4,119 ± 1,716a,b −9.8 0.177*
40–49 128 1,906b 3,751 ± 1,428a,b 4,264 ± 1,604a,b −12.0 0.209*
50–59 128 1,818b 3,728 ± 1,385a 4,079 ± 1,781a,b −8.6 0.115
60–69 128 1,817b 3,700 ± 1,569a,b 4,451 ± 1,654a −16.9 0.103
P-value < 0.001 0.032 0.006
Education
≤ High school 286 1,950 3,677 ± 1,547 4,194 ± 1,573 −12.3 0.129*
College 249 1,907 3,821 ± 1,544 4,063 ± 1,645 −6.0 0.168**
≥ Graduate school 105 2,020 3,815 ± 1,379 4,206 ± 1,792 −9.3 0.223*
P-value 0.186 0.103 0.448
Monthly income (10,000 won)
< 100 221 1,988 3,761 ± 1,733 3,922 ± 1,343 −4.1 0.071
100 to 300 247 1,889 3,696 ± 1,377 4,238 ± 1,744 −12.8 0.282***
≥ 300 172 1,968 3,834 ± 1,421 4,299 ± 1,793 −10.8 0.108
P-value 0.106 0.866 0.679
Smoking
Non-smoking 545 1,925 3,725 ± 1,522 4,024 ± 1,549 −7.4 0.171***
Smoking 95 2,060 3,932 ± 1,495 4,840 ± 1,939 −18.8 0.064
P-value 0.060 0.803 0.021
Physical activity
Light 423 1,951 3,710 ± 1,415 4,044 ± 1,519 −8.3 0.169***
Moderate 178 1,941 3,797 ± 1,794 4,255 ± 1,812 −10.8 0.154*
Heavy 39 1,891 4,058 ± 1,205 4,740 ± 1,904 −14.4 −0.016
P-value 0.791 0.365 0.119
BMI (kg/m2)
< 23 311 1,910 3,652 ± 1,439 3,632 ± 1,345b 0.6 0.102
23 to < 25 155 1,963 3,931 ± 1,792 4,240 ± 1,478b −7.3 0.172*
≥ 25 174 1,989 3,784 ± 1,380 4,977 ± 1,879a −24.0 0.213**
P-value 0.259 0.320 < 0.001
Consumption of all the liquid in the soup
Very unlikely 83 1,937 3,424 ± 1,550 3,264 ± 1,047c 4.9 0.157*
Unlikely 163 1,923 3,555 ± 1,453 3,897 ± 1,404b,c −8.8 0.157*
Neutral 187 1,940 3,950 ± 1,526 4,193 ± 1,518b −5.8 0.078
Likely 149 1,945 3,833 ± 1,594 4,506 ± 1,924a,b −14.9 0.162*
Very likely 58 2,031 3,969 ± 1,321 5,019 ± 1,817a −20.9 0.135
P-value 0.764 0.071 < 0.001
Consumption of eating-out/delivery food
Rarely 149 1,805c 3,588 ± 1,570 4,065 ± 1,623 −11.7 0.134
1–2/wk 252 1,912b,c 3,725 ± 1,595 3,989 ± 1,559 −6.6 0.134*
3–4/wk 117 2,062a,b 3,964 ± 1,266 4,293 ± 1,548 −7.7 0.197*
5–6/wk 52 2,170a 4,016 ± 1,512 4,151 ± 1,646 −3.3 0.239
≥ Once a day 70 1,997a,b,c 3,681 ± 1,501 4,622 ± 1,981 −20.4 0.180
P-value < 0.001 0.529 0.094
Salty taste assessment
Unsalty 80 1,945 3,709 ± 1,303 3,711 ± 1,156b −0.1 0.168
Slightly unsalty 146 1,964 3,842 ± 1,577 4,002 ± 1,635a,b −4.0 0.312***
Neutral 223 1,938 3,708 ± 1,597 4,171 ± 1,841a,b −11.1 0.095
Slightly salty 131 1,907 3,668 ± 1,268 4,350 ± 1,303a −15.7 0.214*
Salty 60 2,005 3,974 ± 1,835 4,527 ± 1,903a −12.2 0.020
P-value 0.797 0.866 0.003
Values are presented as mean ± SD not otherwise specified. P-values calculated by t-test or ANOVA for energy intake; ANCOVA for sodium intake (Sex: adjusted for age and energy intake; Age: adjusted for sex and energy intake; Other variables: adjusted for sex, age, and energy intake). Statistically significant P-values are in bold.
DR, diet recall; UC, urine collection; BMI, body mass index.
1)Percentage difference (%) = {(Intake estimated by DR − Intake estimated by UC)/Intake estimated by UC} × 100.
*P < 0.05, **P < 0.01, ***P < 0.001 by Pearson correlation analysis.
a,b,cMean values with different superscripts within the same category (column) are significantly different between the groups by Tukey’s test.
The mean differences between the two methods were > 15% in the 60–69 yrs age group, smokers, obese individuals, those who consumed all the liquid in the soup, those who consumed eating-out/delivery food at least once a day, and those who were found to be slightly salty in the salty taste assessment. No correlations were found between the intake estimated by the two methods in women, the 50–69 yrs age group, high- and low-income groups, smokers, the heavy-activity group, the BMI < 23 kg/m2 group, and some groups in eating behaviors and salty taste assessment.

Potassium intake estimated by DR and UC according to various factors

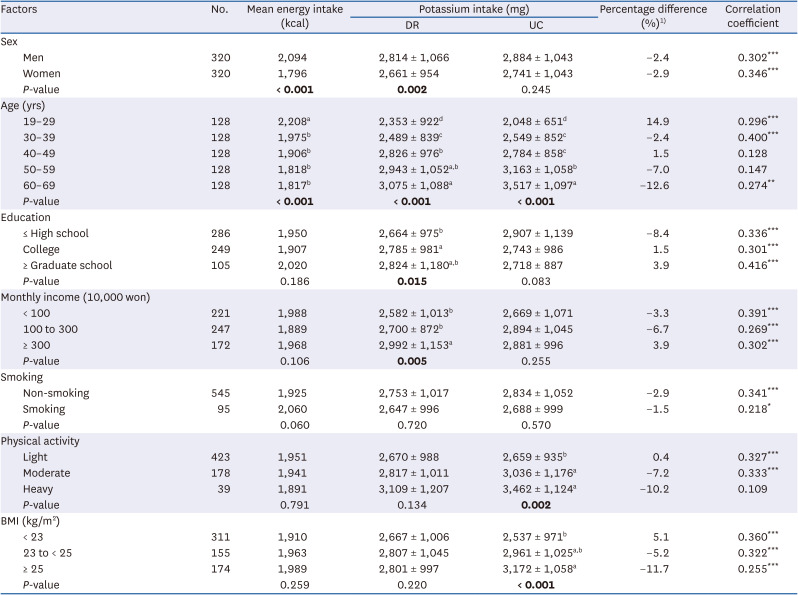
Table 4 shows the potassium intake estimated by DR and UC according to various factors. Potassium intake estimated by UC increased with age, physical activity, and BMI, whereas that estimated by DR was significantly higher in women than in men after adjusting for age and energy intake, and increased with age, education, and monthly income after adjusting for confounding factors. The 60–69 yrs age group, the heavy-activity group, and obese individuals were more likely to underestimate potassium intake. Potassium intake estimated by DR and UC demonstrated significant correlations, except in the 40–59 yrs age group and heavy-activity group.
Table 4

Potassium intake estimated by dietary recall and urine collection according to various factors

nrp-17-284-i004
Factors No. Mean energy intake (kcal) Potassium intake (mg) Percentage difference (%)1) Correlation coefficient
DR UC
Sex
Men 320 2,094 2,814 ± 1,066 2,884 ± 1,043 −2.4 0.302***
Women 320 1,796 2,661 ± 954 2,741 ± 1,043 −2.9 0.346***
P-value < 0.001 0.002 0.245
Age (yrs)
19–29 128 2,208a 2,353 ± 922d 2,048 ± 651d 14.9 0.296***
30–39 128 1,975b 2,489 ± 839c 2,549 ± 852c −2.4 0.400***
40–49 128 1,906b 2,826 ± 976b 2,784 ± 858c 1.5 0.128
50–59 128 1,818b 2,943 ± 1,052a,b 3,163 ± 1,058b −7.0 0.147
60–69 128 1,817b 3,075 ± 1,088a 3,517 ± 1,097a −12.6 0.274**
P-value < 0.001 < 0.001 < 0.001
Education
≤ High school 286 1,950 2,664 ± 975b 2,907 ± 1,139 −8.4 0.336***
College 249 1,907 2,785 ± 981a 2,743 ± 986 1.5 0.301***
≥ Graduate school 105 2,020 2,824 ± 1,180a,b 2,718 ± 887 3.9 0.416***
P-value 0.186 0.015 0.083
Monthly income (10,000 won)
< 100 221 1,988 2,582 ± 1,013b 2,669 ± 1,071 −3.3 0.391***
100 to 300 247 1,889 2,700 ± 872b 2,894 ± 1,045 −6.7 0.269***
≥ 300 172 1,968 2,992 ± 1,153a 2,881 ± 996 3.9 0.302***
P-value 0.106 0.005 0.255
Smoking
Non-smoking 545 1,925 2,753 ± 1,017 2,834 ± 1,052 −2.9 0.341***
Smoking 95 2,060 2,647 ± 996 2,688 ± 999 −1.5 0.218*
P-value 0.060 0.720 0.570
Physical activity
Light 423 1,951 2,670 ± 988 2,659 ± 935b 0.4 0.327***
Moderate 178 1,941 2,817 ± 1,011 3,036 ± 1,176a −7.2 0.333***
Heavy 39 1,891 3,109 ± 1,207 3,462 ± 1,124a −10.2 0.109
P-value 0.791 0.134 0.002
BMI (kg/m2)
< 23 311 1,910 2,667 ± 1,006 2,537 ± 971b 5.1 0.360***
23 to < 25 155 1,963 2,807 ± 1,045 2,961 ± 1,025a,b −5.2 0.322***
≥ 25 174 1,989 2,801 ± 997 3,172 ± 1,058a −11.7 0.255***
P-value 0.259 0.220 < 0.001
Values are presented as mean ± SD. P-values calculated by t-test or ANOVA for energy intake; ANCOVA for potassium intake (Sex: adjusted for age and energy intake; Age: adjusted for sex and energy intake; Other variables: adjusted for sex, age, and energy intake). Statistically significant P-values are in bold.
DR, diet recall; UC, urine collection; BMI, body mass index.
1)Percentage difference (%) = {(Intake estimated by DR − Intake estimated by UC)/Intake estimated by UC} × 100.
*P < 0.05, **P < 0.01, ***P < 0.001 by Pearson correlation analysis.
a,b,c,dMean values with different superscripts within the same category (column) are significantly different between the groups by Tukey’s test.

Na/K estimated by DR and UC according to various factors

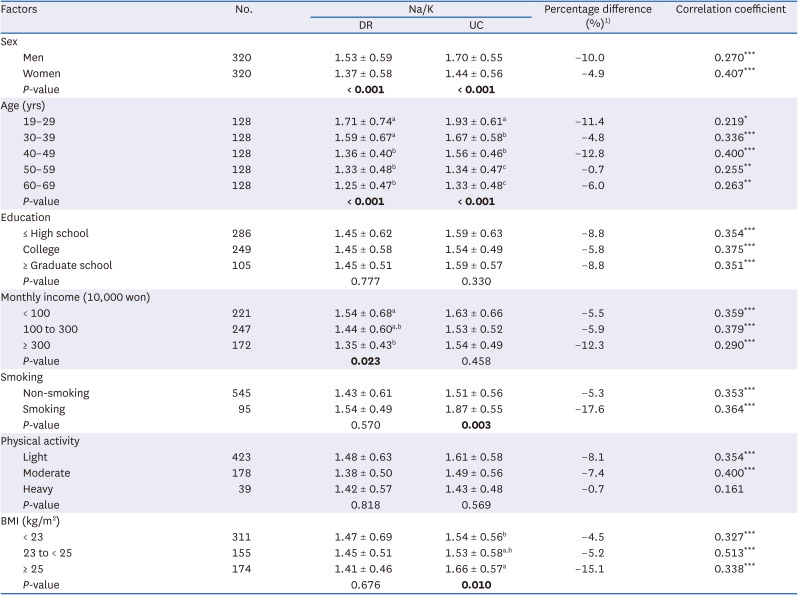
The Na/K values estimated by DR and UC according to various factors are presented in Table 5. Na/K estimated by both methods was consistently higher in men and younger adults than in women and older adults. However, Na/K based on DR was higher in the low-income group, whereas that based on UC was higher in smokers and obese individuals. The DR-estimated Na/K significantly correlated with the UC-estimated Na/K in all groups, except for the heavy-activity group.
Table 5

Na/K estimated by 24-h dietary recall and 24-h urine collection according to various factors

nrp-17-284-i005
Factors No. Na/K Percentage difference (%)1) Correlation coefficient
DR UC
Sex
Men 320 1.53 ± 0.59 1.70 ± 0.55 −10.0 0.270***
Women 320 1.37 ± 0.58 1.44 ± 0.56 −4.9 0.407***
P-value < 0.001 < 0.001
Age (yrs)
19–29 128 1.71 ± 0.74a 1.93 ± 0.61a −11.4 0.219*
30–39 128 1.59 ± 0.67a 1.67 ± 0.58b −4.8 0.336***
40–49 128 1.36 ± 0.40b 1.56 ± 0.46b −12.8 0.400***
50–59 128 1.33 ± 0.48b 1.34 ± 0.47c −0.7 0.255**
60–69 128 1.25 ± 0.47b 1.33 ± 0.48c −6.0 0.263**
P-value < 0.001 < 0.001
Education
≤ High school 286 1.45 ± 0.62 1.59 ± 0.63 −8.8 0.354***
College 249 1.45 ± 0.58 1.54 ± 0.49 −5.8 0.375***
≥ Graduate school 105 1.45 ± 0.51 1.59 ± 0.57 −8.8 0.351***
P-value 0.777 0.330
Monthly income (10,000 won)
< 100 221 1.54 ± 0.68a 1.63 ± 0.66 −5.5 0.359***
100 to 300 247 1.44 ± 0.60a,b 1.53 ± 0.52 −5.9 0.379***
≥ 300 172 1.35 ± 0.43b 1.54 ± 0.49 −12.3 0.290***
P-value 0.023 0.458
Smoking
Non-smoking 545 1.43 ± 0.61 1.51 ± 0.56 −5.3 0.353***
Smoking 95 1.54 ± 0.49 1.87 ± 0.55 −17.6 0.364***
P-value 0.570 0.003
Physical activity
Light 423 1.48 ± 0.63 1.61 ± 0.58 −8.1 0.354***
Moderate 178 1.38 ± 0.50 1.49 ± 0.56 −7.4 0.400***
Heavy 39 1.42 ± 0.57 1.43 ± 0.48 −0.7 0.161
P-value 0.818 0.569
BMI (kg/m2)
< 23 311 1.47 ± 0.69 1.54 ± 0.56b −4.5 0.327***
23 to < 25 155 1.45 ± 0.51 1.53 ± 0.58a,b −5.2 0.513***
≥ 25 174 1.41 ± 0.46 1.66 ± 0.57a −15.1 0.338***
P-value 0.676 0.010
Values are presented as mean ± SD. P-values calculated by ANCOVA (Sex: adjusted for age; Age: adjusted for sex; Other variables: adjusted for sex and age). Statistically significant P-values are in bold.
Na/K, sodium-to-potassium ratio; DR, diet recall; UC, urine collection; BMI, body mass index.
1) Percentage difference (%) = {(Intake estimated by DR – Intake estimated by UC)/Intake estimated by UC} × 100.
*P < 0.05, **P < 0.01, ***P < 0.001 by Pearson correlation analysis.
a,b,cMean values with different superscripts within the same category (column) are significantly different between the groups according to Tukey’s test.

DISCUSSION

In the present study, the mean dietary intakes of sodium and potassium estimated by DR were 3,755 and 2,737 mg/d, respectively, which were higher than or similar to those of representative Korean adults aged ≥ 19 yrs reported in the 2020 KNHANES (3,413 and 2,770 mg/d, respectively) [27]. The mean 24-h urinary excretion of sodium and potassium was 155.0 and 55.5 mmol, respectively. These values are comparable with previous results obtained from a representative population aged 20–65 yrs living in a city in South Korea [28]. As for UC estimation, the dietary intakes of sodium and potassium were 4,145 and 2,812 mg/d, respectively. Therefore, DR underestimated the mean sodium intake by 390 mg compared to UC, and the percentage difference was 9.4%.
Our results are consistent with those of several previous validation studies. NHANES found that sodium intake estimation by DR showed approximately 9% underestimation compared with that by 24-h UC, suggesting that DR is acceptable at the population level [11]. A meta-analysis of 28 studies that examined the validity of DR in measuring the mean sodium intake of a population in comparison with that of UC showed a pooled weighted mean difference of 607 mg/d between the values obtained by the two methods [29]. According to the data from the International Study of Macro- and Micro-nutrients and Blood Pressure (INTERMAP), the percentage differences between the 24-h DR- and 24-h UC-estimated sodium intake were −23.7%, 2.0%, 2.0%, and −2.2% in China, Japan, the UK, and the USA, respectively [30]. The percentage differences (absolute values) in our study were lower than those in China but higher than those in other countries. In Korea, salt and condiments with various sodium contents, such as soy sauce and soybean paste, are often used during cooking without standard recipes or at the table. Nevertheless, our results indicate that DR is valid for estimating the mean sodium and potassium intakes and Na/K in all participants.
According to UC, sex, age, smoking, BMI, consumption of all the liquid in the soup, and salty taste assessment were associated with sodium intake; age, physical activity, and BMI were associated with potassium intake; and sex, age, smoking, and BMI were associated with Na/K. However, the association of DR-estimated sodium and potassium intakes and Na/K with the analyzed factors showed differences.
Sodium intake and Na/K estimated by UC were significantly higher in men than in women, but potassium intake was not significantly different between sexes after adjusting for age and energy intake. According to both methods, after adjusting for sex and energy intake, older adults consumed more sodium and potassium than younger adults, but Na/K was higher in younger adults than in older adults. A previous study based on the 2011–2012 NHANES reported higher Na/K in younger adults [31], possibly because of the lower consumption of fruits and vegetables and higher consumption of processed foods and eating-out/delivery foods [3233]. However, previous results on the association between DR-estimated dietary sodium intake and age have been inconsistent. In Koreans and Japanese, dietary sodium intake increases with age [1634]; in Americans, no difference was reported after adjusting for energy intake [31]. Dietary potassium intake in Japanese is associated with higher age [35]. UC-estimated sodium and potassium intakes and Na/K were not associated with education and income, contrary to previous studies [1636], but DR-estimated potassium intake was higher in the high-education and high-income groups.
Sodium intake and Na/K estimated by UC were significantly higher in smokers than in non-smokers, but no difference was observed in sodium intake estimated by DR. The estimated intake was largely different between the two methods among smokers. Smokers have a greater preference for salty taste and higher sodium intake than non-smokers [3738]. In addition, under-reporting of energy intake is more prevalent among smokers [3940], indicating that sodium intake is possibly underestimated by DR. In the present study, smokers were more likely to consume all the liquid in the soup than non-smokers (Supplementary Table 1). Considering that the liquid component in the soup is high in sodium, those who consume all the liquid in the soup are likely to ingest more sodium than those who do not.
People with heavy activities tended to consume higher sodium and potassium estimated by UC than those with light activities, but sodium intake was not significantly different after adjusting for confounding factors. Okuda et al. [41] reported that physical activity was an important determinant of sodium and potassium excretion in secondary school students. The association between physical activity and the urinary excretion of sodium and potassium should be further investigated.
Sodium and potassium intakes and Na/K estimated by UC were significantly higher in individuals with obesity than in those with normal weight or underweight, but no association was found according to DR. Murakami et al. [13] also reported that BMI was positively associated with UC-estimated but not with DR-estimated sodium intake. Individuals with overweight and obesity under-reported their dietary intake and sodium intake more frequently than those with normal weight [113940]. In our study, sodium and potassium intakes were markedly underestimated in obese individuals. In some studies, obese individuals have altered salt taste perception and preference [4243], which might explain the higher sodium intake estimated by UC than by DR. However, our study found no difference in the salty taste score according to BMI (Supplementary Table 1). Instead, obese individuals were more likely to consume all the liquid in the soup, which might partly explain the large difference in sodium intake between the two methods (Supplementary Table 1). Soup (or stew) is a major constituent of a traditional Korean meal along with cooked rice and side dishes and is also a major contributor to sodium intake in Koreans [44]. Therefore, investigating the amount of liquid consumption in soup is crucial for accurately estimating Korean sodium intake by DR.
The current study has several limitations. First, although urinary excretion of sodium and potassium is often used as a reference to validate dietary methods, it is influenced by other variations, such as biological and analytical factors. Furthermore, although the conversion coefficient (0.86 of sodium and 0.77 of potassium) is widely used to calculate sodium and potassium intakes from urinary excretion, it has not yet been validated in a Korean population. The conversion coefficient of sodium ranges from 0.85 to 0.95, and if we use 0.95 for sodium, the two mean values are almost identical. Second, the participants may not be representative of the general Korean population.
Despite these limitations, our study has several strengths. We recruited relatively large samples from different regions of the country. The survey, implemented in eight different centers, was well coordinated by detailed instructions for quality control. The two 24-h DRs conducted by a trained dietitian and the two 24-h UCs on the day following each DR performed by the participants enabled us to compare sodium and potassium intakes and Na/K estimated by the two methods. In addition, we analyzed the mean differences between the two methods for all participants and evaluated the differences and correlations according to various factors. To our knowledge, this study is the first to estimate potassium intake using 24-h urinary excretion in a Korean population.
In conclusion, the 24-h DR was useful in estimating the mean sodium and potassium intakes and Na/K ratio in all participants in comparison with the 24-h UC. However, the results on the association of dietary sodium and potassium intakes with sociodemographic and health-related factors were inconsistent when estimated by DR and UC. DR was more likely to underestimate sodium intake in older adults, smokers, obese individuals, those who consumed all the liquid in the soup, and those who consumed eating-out/delivery food at least once a day; and potassium intake in older adults, the heavy-activity group, and obese individuals, when compared with UC. Factors influencing the underestimation of sodium intake by DR compared to UC should be further investigated. Nevertheless, men, younger adults, smokers, and individuals with obesity had higher Na/K than women, older adults, non-smokers, and individuals with normal weight or underweight when estimated by UC, indicating that these people should be prioritized in educating the importance of reducing sodium and increasing potassium consumption.

Notes

Funding: This study was supported by a grant (14162MFDS136) from the National Institute of Food and Drug Safety Evaluation, Korea.

Conflict of Interest: The authors declare no potential conflicts of interests.

Author Contributions:

  • Conceptualization: Lee YK.

  • Formal analysis: Lee YK, Hyun T.

  • Funding acquisition: Lee YK, Hyun T, Choi MK, Heo YR, Ro H.

  • Investigation: Lee YK, Hyun T, Choi MK, Heo YR, Ro H.

  • Methodology: Lee YK, Hyun T, Choi MK, Heo YR, Ro H.

  • Supervision: Lee YK.

  • Writing - original draft: Hyun T, Han YH Writing - review & editing.

References

1. Whelton PK. Sodium, potassium, blood pressure, and cardiovascular disease in humans. Curr Hypertens Rep. 2014; 16:465. PMID: 24924995.
2. Ozemek C, Laddu DR, Arena R, Lavie CJ. The role of diet for prevention and management of hypertension. Curr Opin Cardiol. 2018; 33:388–393. PMID: 29771736.
3. Fuchs FD, Whelton PK. High blood pressure and cardiovascular disease. Hypertension. 2020; 75:285–292. PMID: 31865786.
4. Pistoia F, Sacco S, Degan D, Tiseo C, Ornello R, Carolei A. Hypertension and stroke: epidemiological aspects and clinical evaluation. High Blood Press Cardiovasc Prev. 2016; 23:9–18. PMID: 26159677.
5. Barri YM. Hypertension and kidney disease: a deadly connection. Curr Hypertens Rep. 2008; 10:39–45. PMID: 18367025.
6. Turana Y, Tengkawan J, Chia YC, Hoshide S, Shin J, Chen CH, Buranakitjaroen P, Nailes J, Park S, Siddique S, et al. Hypertension and dementia: a comprehensive review from the HOPE Asia Network. J Clin Hypertens (Greenwich). 2019; 21:1091–1098. PMID: 31131972.
7. GBD 2017 Diet Collaborators. Health effects of dietary risks in 195 countries, 1990-2017: a systematic analysis for the Global Burden of Disease Study 2017. Lancet. 2019; 393:1958–1972. PMID: 30954305.
8. McLean RM. Measuring population sodium intake: a review of methods. Nutrients. 2014; 6:4651–4662. PMID: 25353661.
9. Ginos BN, Engberink RH. Estimation of sodium and potassium intake: current limitations and future perspectives. Nutrients. 2020; 12:3275. PMID: 33114577.
10. McLean RM, Farmer VL, Nettleton A, Cameron CM, Cook NR, Woodward M, Campbell NRC. TRUE Consortium (in Ternational Consortium for Quality Research on Dietary Sodium/Salt). Twenty-four-hour diet recall and diet records compared with 24-hour urinary excretion to predict an individual’s sodium consumption: a systematic review. J Clin Hypertens (Greenwich). 2018; 20:1360–1376. PMID: 30298972.
11. Rhodes DG, Murayi T, Clemens JC, Baer DJ, Sebastian RS, Moshfegh AJ. The USDA Automated Multiple-Pass Method accurately assesses population sodium intakes. Am J Clin Nutr. 2013; 97:958–964. PMID: 23553153.
12. Ma Y, He FJ, MacGregor GA. High salt intake: independent risk factor for obesity? Hypertension. 2015; 66:843–849. PMID: 26238447.
13. Murakami K, Livingstone MB, Sasaki S, Uenishi K. Japan Dietetic Students’ Study for Nutrition and Biomarkers Group. Ability of self-reported estimates of dietary sodium, potassium and protein to detect an association with general and abdominal obesity: comparison with the estimates derived from 24 h urinary excretion. Br J Nutr. 2015; 113:1308–1318. PMID: 25782331.
14. Zhou L, Stamler J, Chan Q, Van Horn L, Daviglus ML, Dyer AR, Miura K, Okuda N, Wu Y, Ueshima H, et al. Salt intake and prevalence of overweight/obesity in Japan, China, the United Kingdom, and the United States: the INTERMAP Study. Am J Clin Nutr. 2019; 110:34–40. PMID: 31111867.
15. Song HJ, Cho YG, Lee HJ. Dietary sodium intake and prevalence of overweight in adults. Metabolism. 2013; 62:703–708. PMID: 23357528.
16. Hong JW, Noh JH, Kim DJ. Factors associated with high sodium intake based on estimated 24-hour urinary sodium excretion: the 2009-2011 Korea National Health and Nutrition Examination Survey. Medicine (Baltimore). 2016; 95:e2864. PMID: 26945369.
17. Hashimoto T, Yagami F, Owada M, Sugawara T, Kawamura M. Salt preference according to a questionnaire vs. dietary salt intake estimated by a spot urine method in participants at a health check-up center. Intern Med. 2008; 47:399–403. PMID: 18310970.
18. Otsuka T, Kato K, Ibuki C, Kodani E, Kusama Y, Kawada T. Subjective evaluation of the frequency of salty food intake and its relationship to urinary sodium excretion and blood pressure in a middle-aged population. Environ Health Prev Med. 2013; 18:330–334. PMID: 23233242.
19. Lim H. A study on the sodium and potassium intakes and urinary excretion of adults in Busan. Korean J Community Nutr. 2012; 17:737–751.
20. Kim S, Chung S. Validity of estimating sodium intake using a mobile phone application of 24-hour dietary recall with meal photos. Korean J Community Nutr. 2020; 25:317–328.
21. Jeong Y, Lim H, Kim S, Kim HJ, Son SM. Blood pressure and dietary related risk factors associated with high sodium intake assessed with 24-hour urine analysis for Korean adults. Korean J Community Nutr. 2014; 19:537–549.
22. Lee WJ, Kim HC, Oh SM, Choi DP, Cho J, Suh I. Factors associated with a low-sodium diet: the fourth Korean National Health and Nutrition Examination Survey. Epidemiol Health. 2013; 35:e2013005. PMID: 23807908.
23. Shin E, Lee H, Ahn M, Lee Y. Study on the development and evaluation of validity of salty taste assessment tool. Korean J Nutr. 2008; 41:184–191.
24. World Health Organization, Western Pacific Region. The Asia-Pacific Perspective: Refining Obesity and its Treatment. Sydney: Health Communication Australia;2000.
25. Nam GE, Kim SM, Choi MK, Heo YR, Hyun TS, Lyu ES, Oh SY, Park HR, Ro HK, Han K, et al. Association between 24-h urinary sodium excretion and obesity in Korean adults: a multicenter study. Nutrition. 2017; 41:113–119. PMID: 28760420.
26. Holbrook JT, Patterson KY, Bodner JE, Douglas LW, Veillon C, Kelsay JL, Mertz W, Smith JC Jr. Sodium and potassium intake and balance in adults consuming self-selected diets. Am J Clin Nutr. 1984; 40:786–793. PMID: 6486085.
27. Ministry of Health and Welfare, Korea Disease Control and Prevention Agency. Korea Health Statistics 2020. Korea National Health and Nutrition Examination Survey (KNHANES VII-2). Cheongju: Korea Disease Control and Prevention Agency;2021.
28. Rhee MY, Shin SJ, Park SH, Kim SW. Sodium intake of a city population in Korea estimated by 24-h urine collection method. Eur J Clin Nutr. 2013; 67:875–880. PMID: 23632748.
29. McLean R, Cameron C, Butcher E, Cook NR, Woodward M, Campbell NR. Comparison of 24-hour urine and 24-hour diet recall for estimating dietary sodium intake in populations: a systematic review and meta-analysis. J Clin Hypertens (Greenwich). 2019; 21:1753–1762. PMID: 31769168.
30. Wen X, Zhou L, Stamler J, Chan Q, Van Horn L, Daviglus ML, Dyer AR, Elliott P, Ueshima H, Miura K, et al. Agreement between 24-h dietary recalls and 24-h urine collections for estimating sodium intake in China, Japan, UK, USA: the International Study of Macro- and Micro-nutrients and Blood Pressure. J Hypertens. 2019; 37:814–819. PMID: 30817463.
31. Bailey RL, Parker EA, Rhodes DG, Goldman JD, Clemens JC, Moshfegh AJ, Thuppal SV, Weaver CM. Estimating sodium and potassium intakes and their ratio in the American diet: data from the 2011–2012 NHANES. J Nutr. 2015; 146:745–750. PMID: 26962185.
32. Bae Y. Relationship among practicing healthy diet and metabolic syndrome indicators in adults-from the Korea National Health and Nutrition Examination Survey, 2013~ 2014. J Nutr Health. 2016; 49:459–470.
33. Adams J, Goffe L, Brown T, Lake AA, Summerbell C, White M, Wrieden W, Adamson AJ. Frequency and socio-demographic correlates of eating meals out and take-away meals at home: cross-sectional analysis of the UK national diet and nutrition survey, waves 1-4 (2008-12). Int J Behav Nutr Phys Act. 2015; 12:51. PMID: 25889159.
34. Sugiura T, Takase H, Ohte N, Dohi Y. Dietary salt intake increases with age in Japanese adults. Nutr Res. 2021; 89:1–9. PMID: 33866192.
35. Turin TC, Okuda N, Miura K, Nakamura Y, Rumana N, Ueshima H. NIPPON DATA80/90 Research Group. Dietary intake of potassium and associated dietary factors among representative samples of Japanese general population: NIPPON DATA 80/90. J Epidemiol. 2010; 20:S567–S575. PMID: 20351479.
36. Yamashita M, Tabara Y, Higo Y, Setoh K, Kawaguchi T, Takahashi Y, Kosugi S, Nakayama T, Matsuda F, Wakamura T. Nagahama Study group. Association between socioeconomic factors and urinary sodium-to-potassium ratio: the Nagahama Study. Hypertens Res. 2018; 41:973–980. PMID: 30218050.
37. Lampuré A, Schlich P, Deglaire A, Castetbon K, Péneau S, Hercberg S, Méjean C. Sociodemographic, psychological, and lifestyle characteristics are associated with a liking for salty and sweet tastes in French adults. J Nutr. 2015; 145:587–594. PMID: 25733476.
38. Park NY. Association of smoking with salt taste preference, sodium intake, and the risk of metabolic syndrome in Korean men: a community-based longitudinal study (2001~2010) [master’s thesis]. Cheongju: Chungbuk National University;2015.
39. Pryer JA, Vrijheid M, Nichols R, Kiggins M, Elliott P. Who are the ‘low energy reporters’ in the dietary and nutritional survey of British adults? Int J Epidemiol. 1997; 26:146–154. PMID: 9126514.
40. Johansson L, Solvoll K, Bjørneboe GE, Drevon CA. Under- and overreporting of energy intake related to weight status and lifestyle in a nationwide sample. Am J Clin Nutr. 1998; 68:266–274. PMID: 9701182.
41. Okuda M, Asakura K, Sasaki S, Shinozaki K. Twenty-four-hour urinary sodium and potassium excretion and associated factors in Japanese secondary school students. Hypertens Res. 2016; 39:524–529. PMID: 26935040.
42. Cox DN, Perry L, Moore PB, Vallis L, Mela DJ. Sensory and hedonic associations with macronutrient and energy intakes of lean and obese consumers. Int J Obes. 1999; 23:403–410.
43. Donaldson LF, Bennett L, Baic S, Melichar JK. Taste and weight: is there a link? Am J Clin Nutr. 2009; 90:800S–803S. PMID: 19571216.
44. Yon M, Lee Y, Kim D, Lee J, Koh E, Nam E, Shin H, Kang B, Kim JW, Heo S, et al. Major sources of sodium intake of the Korean population at prepared dish level-based on the KNHANES 2008 & 2009. Korean J Community Nutr. 2011; 16:473–487.
SUPPLEMENTARY MATERIAL

Supplementary Table 1

Eating behavior score and salty taste score according to various factors
nrp-17-284-s001.xls
TOOLS
Similar articles