

 PDF
PDF Citation
 Print
Print


INTRODUCTION
It is well recognized that adolescence is a vital period of transition from childhood to adulthood involving major anatomical, physiological, and social changes between 10 and 19 yrs [1]. This dynamic period of human growth makes adolescents a nutritionally vulnerable group as the pubertal transition during this period is accompanied by a growth spurt with additional needs for macro- and micronutrients. Therefore, it is essential to provide an adequate nutrient intake and a good quality diet to adolescents to ensure their current and long-term health.
Food security issues have now been recognized as a public policy concern across the globe. This is due to their multidimensional nature that causally links the pathway from farm to fork and reflects the complex interaction among and between the individual, household, national and global levels [23]. The Food and Agriculture Organization (FAO) of the United Nations (UN) defines food security as a situation that exists when all people, at all times, have physical, social, and economic access to sufficient, safe, and nutritious food that meets the dietary needs and food preferences of an active and healthy life [4]. The close relationship between poverty and food insecurity drives the focus onto vulnerable groups of people who live below the poverty line [5]. As income levels drop, the prevalence of individuals suffering from food insecurity rises. A United Nations Children’s Fund (UNICEF), Malaysia study that focused on urban poverty and deprivation in low-cost flats in Kuala Lumpur reported that more than 1 in 10 children had less than 3 meals a day and experienced undernourishment [6]. Meanwhile, according to the Adolescent Nutrition Survey (ANS) 2017, the prevalence of adolescents being hungry during the previous month in Kuala Lumpur was 5.7%, which was found to be higher than the overall national prevalence of 3.9% [7]. These findings indicate the fact that food insecurity is prevalent among urban Malaysian adolescents.
Adolescents living in food insecure households have been associated with poorer health status [8] and diet quality [910] compared to those living in food secure households. Furthermore, the risk of malnutrition and certain chronic diseases can increase with an increasing level of food insecurity, which is linked to diets that may be less than optimal [11]. This is specific to the urban poor as limited household resources for food may shift their diet composition and diversity. People who are food insecure are more likely to purchase food that is less nutritious and high in salt, sugar, and fat [12]. A past study also suggested that food insecure children and adolescents between 5 and 18 yrs tend to have nutrient deficiencies, particularly with respect to protein, fat, calcium, phosphorous, and potassium when compared to their food secure counterparts [13].
Studies on the association between food security status and diet quality in Malaysia are limited, especially among adolescents. Existing food security studies have generally targeted rural [1415], adults [16], and the indigenous population [17], where adolescents are often understudied despite their apparent vulnerability, especially among those residing in poor urban areas. Additionally, both food security and malnutrition are now commonly regarded as high-priority objectives for many countries in terms of sustainable development and have also been recognized as such by the UN’ Sustainable Development Goals [18]. Hence, this study aimed to examine the food security status of urban poor adolescents and its association with diet quality. Collectively, a better understanding of the association between food security and diet quality could help develop effective intervention programs to improve food security-related problems among urban poor adolescents.
SUBJECTS AND METHODS
Participants and study design
This cross-sectional study was carried out in 5 low-cost flat complexes (People’s Housing Programme [PPR]) located in Kuala Lumpur, Malaysia. A simple random sampling method was applied for the selection of the 5 PPRs from a list of PPRs (n = 65) provided by the Kuala Lumpur City Town Hall. The minimum sample size of this study was determined using the one-proportion formula by Daniel [19]. The study required a total of 150 subjects, considering a 95% confidence level, 0.05 precision rate, and the 23.5% household food insecurity prevalence in urban Peninsular Malaysia [20]. To compensate for the expected non-response rate of 20%, the sample size was increased to 181 subjects. Malaysian adolescents aged between 13–18 yrs and residing in low-cost flats in Kuala Lumpur for at least one year were eligible to participate in this study. Adolescents with mental or physical disabilities or those who were pregnant or lactating were excluded.
Prior to data collection, authorization was obtained from the residential president of the participating PPR. The convenience sampling method was applied for the recruitment of the subjects whereby the residential President shared e-flyers through social media platforms with the residents of the PPR for the recruitment of the adolescents via the parents. In addition, adolescents were also approached at the residential play areas such as basketball courts and playgrounds. Written informed consent was obtained from the parents/guardians and assent was obtained from the adolescents before the data collection.
The data collection period was from January 2021 to March 2021. The research protocol of this study was approved by the Institutional Ethics Committee (IEC) of UCSI University, Malaysia (Reference code: IEC-2021-FAS-034). Permission to conduct the research was obtained from the Kuala Lumpur City Hall.
Self-administered questionnaire
The first section of the self-administered questionnaire comprised 8 items that sought to obtain sociodemographic background data including sex (male and female), age in years, ethnicity (Malay, Chinese, Indian, and others), educational level (no formal education, primary school, and secondary school), monthly household income (less than MYR1,000, MYR1,000–1,999, MYR2,000–2,500 and more than MYR2,500), household size (2, 3 and 4 or more) and living period in low-cost flats in Kuala Lumpur, Malaysia (less than 12 mon or more than 12 mon).
The household food security status was assessed using the Radimer/Cornell hunger and food insecurity instrument [21] which showed good internal consistency and reliability in this study, with a Cronbach’s alpha coefficient of 0.706. Based on the responses, it categorized the households into 4 food insecurity-based groups based on severity namely household secure, household insecure, individual insecure, and child hunger. The household secure designation referred to a situation where the responses for 10 items included negative answers: “not true” and positive answers: “sometimes true” or “often true.” A food secure situation was when there were negative responses to all items. Positive answers to one or more items from items 1 to 4 were categorized as household food insecure, which was described as anxiety about the household’s food supply and typically occurs first. Positive answers to one or more items from items 5 to 8 indicated individual food insecurity, where the quality and then the quantity of the parent’s food intake were compromised. The most severe level of food insecurity was child hunger which was the case when positive answers were given for items 9 and 10.
Anthropometric measurements
Anthropometric measurements including the body weight and height of the subjects were measured using an Omron HBF 375 Karada Scan Body Composition Monitor (Omron Healthcare Co., Kyoto, Japan) and a stadiometer (Seca model 206; Seca, Hamburg, Germany), respectively. Each subject’s body weight and height were measured twice, and the average was taken as the final measurement. The body mass index-for-age (BAZ) and height-for-age (HAZ) z scores were then calculated to classify the subject’s weight and height status based on the WHO growth reference charts [22].
Dietary intake
The dietary intake of subjects was assessed by using a 2-day 24-h dietary recall of one weekday and one weekend. Subjects were required to recall all the foods and beverages consumed over the past 24 h. This dietary intake section recorded the time of meal consumption, the ingredients, brand names, portion sizes, and food preparation methods. To increase the accuracy of the food portion sizes, subjects were given household measurement indicators such as plates, bowls, glasses (100 mL, 200 mL, and 250 mL), cups (1/8, 1/4, 1/2, and 1), and teaspoons or tablespoons to help them recall the number and quantities of foods and beverages consumed. All the dietary data obtained were analyzed using the Nutritionist Pro® Software Version 4.0 (Axxya Systems, Stafford, TX, USA) based on the food listed in the Malaysian Food Composition Database Nutrient Composition of Malaysian Food [23]. The average intake of dietary calories, macro-and micronutrients was compared with the Malaysian Recommended Nutrients Intake (RNI) for adolescents based on gender and age groups [24].
The diet quality of adolescents was assessed using the Malaysian Healthy Eating Index (HEI) [2526]. The serving size for each food group was determined with modifications of the recommended serving sizes based on the Malaysian food pyramid 2020 [27]. The Malaysian HEI comprised 7 components of food groups (grains and cereals, vegetables, fruits, meat, poultry and eggs, fish and seafood, legumes, and milk and dairy products) and 2 components of nutrients (percentage of energy from fat and sodium intake). The scores for each component ranged from 0 (for lack of compliance) to 10 (for full compliance). The total HEI score was obtained by summing the scores of each of the components. The composite score in percentage terms was calculated using the formula: (Total Score Obtained from 9 Components/9 × 10) ×100%. The possible composite score of the HEI ranged from 0 to 100, with a higher score indicating better diet quality. Based on the total score of 100, the composite score of HEI for an adolescent was divided into 3 categories which were poor diet (< 51%), diet requiring improvement (51–80%), and good diet (> 80%) [26].
Statistical analysis
Data analyses were performed using the IBM SPSS Version 22.0 software (IBM Corp., Armonk, NY, USA). A normality test was carried out using the skewness value (between −2 and +2) among the variables involved in this study [28]. A descriptive statistical analysis was performed to calculate the mean, SD, percentage, and frequency. Mean differences and associations between the components of the Malaysian HEI with household food security status were assessed using the Kruskal-Wallis test and Pearson’s χ2 tests. For the Kruskal-Wallis test, pairwise differences among groups were determined using the Dunn test for multiple comparisons. Multiple linear regression (MLR) analysis was performed to identify whether the food security status contributed to diet quality, with the adjusted model of sociodemographic variables (age, gender, ethnicity, education level, monthly household income, household size) and anthropometric status (BAZ and HAZ). The statistical significance level was set at P < 0.05.
RESULTS
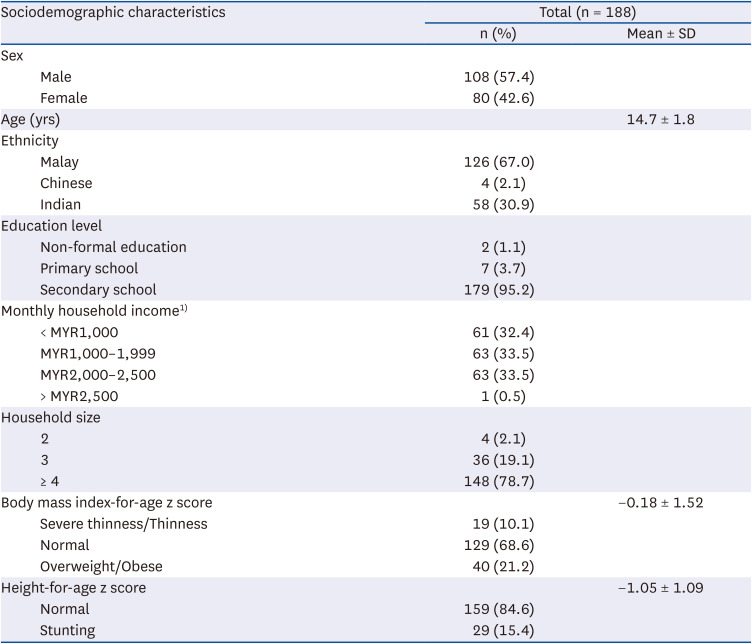
The sociodemographic characteristics of the subjects are presented in Table 1. The present study included 188 subjects with a mean age of 14.7 ± 1.8 yrs. Adolescents were predominantly male (57.4%) and Malay (67.0%). About 95.7% of subjects were receiving secondary education at that time and only 1.1% of the adolescents had never received any formal education. Most of the monthly household incomes fell in the category MYR2,500 or below (99.5%). Also, more than 3-quarters of the adolescents had a household size of more than 4 family members (78.7%). The presence of severe thinness/moderate thinness (10.1%) and overweight/obesity (21.2%) reflected the double burden of malnutrition in the study.
Table 1
Sociodemographic characteristics of the respondents by sex (n = 188)
Food security and dietary intake
Nearly half of the adolescents experienced household food insecurity (47.9%), followed by individual food insecurity (24.5%), household food security (18.6%), and child hunger (9.0%) (Table 2).
Table 2
Dietary intake of urban poor adolescents (n = 188)
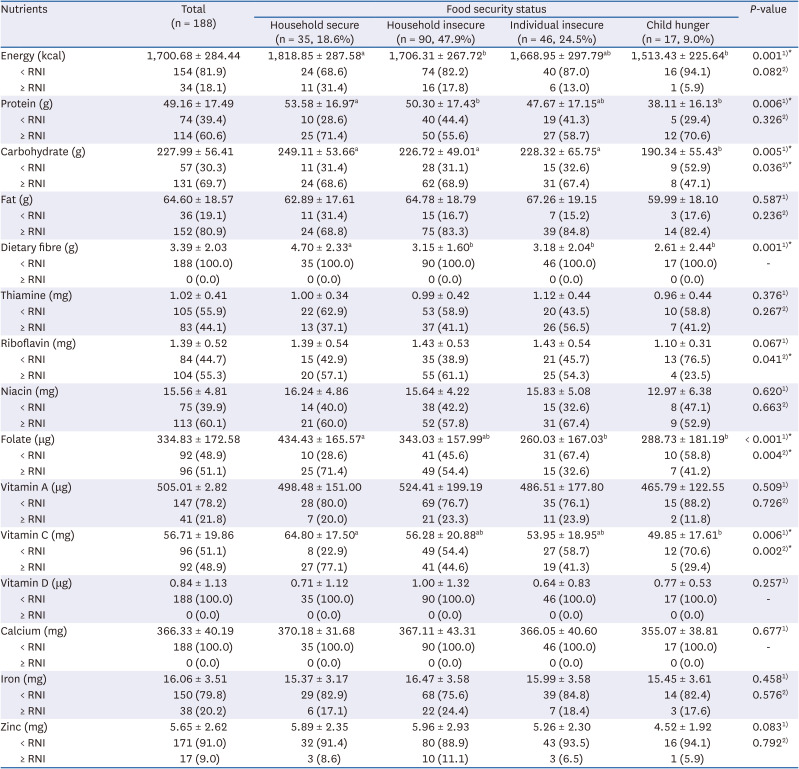
Data were expressed as mean ± SD and n (%) unless otherwise indicated. Recommended Nutrient Intake (RNI) according to National Coordinating Committee on Food and Nutrition (Malaysia) (2017).
1)Significant differences between food security status were measured by Kruskal-Wallis test.
2)Significant associations between food security status were measured by Pearson’s χ2 test.
*P < 0.05.
abcSignificantly group different at P < 0.05.
The overall energy, macro-and micro-nutrient intakes of the adolescents according to their food security status are illustrated in Table 2. The mean energy, protein, carbohydrates, fat, and dietary fiber intakes were 1,700.68 ± 284.44 kcal, 49.16 ± 17.49 g, 227.99 ± 56.41 g, 64.60 ± 18.57 g, and 3.39 ± 2.03 g, respectively. The majority of the adolescents (81.9%) did not meet the RNI requirements for energy intake and dietary fiber intake (100.0%). As for micronutrients, more than half of the adolescents did not meet the RNI requirements for vitamin D (100.0%), calcium (100.0%), zinc (91.0%), iron (79.8%), vitamin A (78.2%), thiamin (55.9%), and vitamin C (51.1%).
In addition, adolescents from both the household insecure (1,706.31 ± 267.72 kcal) and child hunger (1,513.43 ± 225.64 kcal) groups had a significantly lower energy intake compared to those from the household secure group (1,818.85 ± 287.58 kcal) (P = 0.001). A similar trend was also observed for protein intake (P = 0.006). Besides, the intake of carbohydrates (190.34 ± 55.43 g) was significantly lower among adolescents in the child hunger group than those in the household secure group (249.11 ± 53.66 g) (P = 0.005). A similar pattern was observed for folate (P < 0.001) and vitamin C (P = 0.006). As for dietary fiber, the adolescents in the household food secure group (4.70 ± 2.33 g) recorded a significantly higher intake of dietary fiber compared to the other food insecure groups (household insecure: 3.15 ± 1.60 g; individual insecure: 3.18 ± 2.04 g; child hunger: 2.61 ± 2.44 g) (P = 0.001).
In terms of nutrient adequacy, the intakes of carbohydrates (P = 0.036), riboflavin (P = 0.041), folate (P = 0.004), and vitamin C (P = 0.022) were significantly associated with the food security status, indicating that a significantly higher proportion of adolescents in the child hunger group failed to meet the RNI requirements of these nutrients when compared to the other groups (household secure, household insecure and individual insecure).
Diet quality
Generally, the mean score of diet quality was 56.83 ± 10.09, which falls under the category of diets requiring improvement, and only 2.1% of adolescents reported good diet quality intake (> 80) (Table 3). Adolescents were found to have poor adherence to the recommended serving size for most of the food groups and nutrients except for grains and cereals, and meat, poultry, and eggs. The meat, poultry, and egg component (9.99 ± 0.05) had the highest mean score, and the vegetable component (3.47 ± 1.49) had the lowest. This indicates that the adolescents were having one to 2 servings of meat, poultry, and eggs, but less than 3 servings of vegetables. There was a significant difference in the mean HEI score by the food security status wherein the highest was the food secure group (60.63 ± 8.78) compared to the food insecure groups (household insecure: 57.59 ± 9.10; individual insecure: 54.95 ± 11.98; child hunger: 50.13 ± 8.28) (P = 0.001). Adolescents from the child hunger group recorded significantly lower fish and seafood component scores (0.85 ± 2.51) compared to the other groups (P < 0.001). The adolescents from the household food secure groups (6.48 ± 4.14) were found to have significantly higher fruit component scores compared to those in the food insecure groups (household insecure: 4.20 ± 3.98; individual insecure: 3.36 ± 4.39; child hunger: 2.34 ± 3.83) (P = 0.001). Adolescents from both household insecure (9.83 ± 0.61) and child hunger (9.78 ± 0.49) groups reported significantly lower grains and cereals component scores compared to the adolescents from the household secure group (9.97 ± 0.19) (P = 0.023). Adolescents from the individual food insecure group (8.71 ± 1.38) had significantly higher sodium component scores than adolescents from the household secure group (7.57 ± 2.19) (P = 0.025), indicating that adolescents from the food insecure group were more compliant with the national guideline recommendations of having a daily sodium intake of less than 2,000 mg.
Table 3
Total mean score for HEI components of the urban poor adolescents (n = 188)
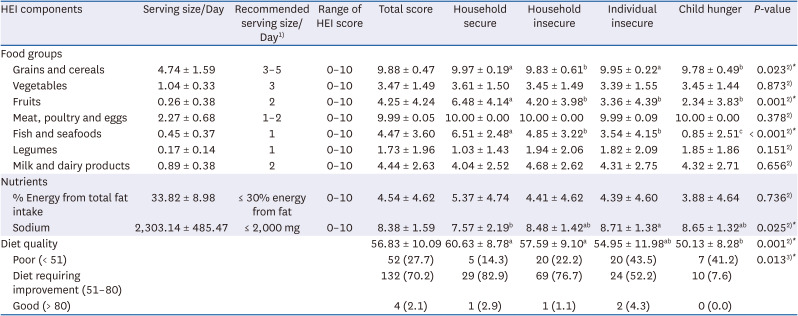
HEI = Healthy Eating Index.
1)Serving size based on recommendations of the Malaysian food pyramid 2020. Data were expressed as mean ± SD.
2)Significant differences between food security status were measured by Kruskal-Wallis test.
3)Significant associations between food security status were measured by Pearson’s χ2 test.
*P < 0.05.
abcSignificantly different at P < 0.05.
Predictor of diet quality
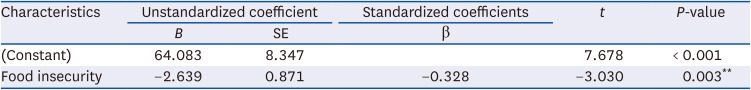
Table 4 shows the predictor of diet quality using the MLR model. A total of 13.3% of the variation in the diet quality was explained by the food security status (F = 2.726; P < 0.01). Adolescents who experienced food insecurity (β = −0.328; P = 0.003) were found to be significantly associated with a poor diet quality score after controlling for covariates.
DISCUSSION
The present study revealed that 81.4% of urban poor adolescents living in Kuala Lumpur, Malaysia experienced household food insecurity. This finding was consistent with previous findings [293031] in which the prevalence of food insecurity was much higher than that of food security among the urban poor. The higher prevalence of food insecurity found in the present study could be attributed to the fact that urban poor households may have limited financial resources for food allocation, forcing them to compromise on the quantity and quality of food [32]. The low-income families with low purchasing power tend to allocate more of their income to purchase staples that are perceived as cheaper and more affordable, accessible, and calorie-dense as a coping mechanism [32]. This explanation is further supported by a study by UNICEF, Malaysia, wherein 97% of the urban poor households in Kuala Lumpur felt that high food prices were the main barrier for families attempting to prepare healthy meals for their children [6]. Additionally, the escalating cost of living in urban areas as well as frequent unexpected expenses makes the urban poor especially vulnerable to uncertainties including food security.
To ensure optimal growth and development during adolescence, it is important to establish healthy and lasting dietary behavior to mitigate the occurrence of preventable malnutrition-related health consequences. However, the diets of Malaysian adolescents have been reported to be nutritionally poor and failed to meet the dietary guidelines for optimal health and well-being [33]. The findings in the present study also reflect a similar situation. The dietary intake data in the present study showed that adolescents had mean energy and dietary fiber intakes that were below the RNI levels. Similar trends in the inadequacy of energy and fiber intake were found in national adolescent studies including the Malaysian Health and Adolescents Longitudinal Research Study or the MyHeARTs study [33] and ANS [7]. The increased consumption of energy-dense foods among poor households living in urban areas was reported in a previous study [32] as one of the coping strategies. In addition, the low dietary fiber intake could be partially explained by the low fruit, vegetables, and legumes consumption in this study as the mean serving sizes for these were shown to have poor adherence to the recommendations of the Malaysian food pyramid 2020 [27]. A previous study highlighted that adolescents were less likely to consume high-fiber food such as vegetables, fruits, and legumes due to their unpleasant taste, and these were less preferred as compared to other food types [3435].
The results of the evaluation of micronutrient intake suggest that more than half of the adolescents had an insufficient intake of certain nutrients such as thiamin, vitamin A, vitamin C, vitamin D, calcium, iron, and zinc. This is especially true for vitamin D and calcium and this is in line with the findings from the MyHeARTs study [33] in which none of the adolescents achieved the RNI levels. These findings were also similar to national studies carried out in European countries [36], Southern Brazil [37], and Korea [38]. This outcome could be explained by the low consumption of milk and dairy products [39] as well as fish and seafood [40] that constitute the major dietary sources of vitamin D. The previous study also found that children from low-income households consumed significantly less milk than children from high-income households [41]. Another possible reason for low vitamin D levels could be insufficient sunlight exposure, which has also been observed in a local study [42]. Vitamin D deficiencies put adolescents, particularly at risk as vitamin D along with calcium plays a critical role in promoting optimal bone mineralization to achieve peak bone mass during growth spurts and development [43]; hence, it is important to address this and to ensure the sufficient intake of vitamin D rich foods, especially among the urban poor.
The present study revealed that the majority of adolescents had vitamin A and vitamin C intakes that were lower than the minimum RNI requirements. The mean intake for both vitamin A and vitamin C was also much lower than that seen in the ANS [7]. Both vitamins are vital for the health of adolescents as these act as powerful antioxidants that support a healthy immune system and help prevent diseases [44]. As for fiber, the low mean food group servings for vegetables and fruits which are also the main sources of vitamin A and vitamin C may help to explain the outcomes. Thiamin insufficiency can result in beriberi, a condition characterized by peripheral nerve problems, cognitive dysfunction, and wasting [45]. The intake of thiamine was found to be low in the present study, and this was similar to the findings in local study [46] and the ANS [7]. This could also be due to the low intake of thiamin-rich foods such as legumes and fish. The dietary iron and zinc intakes were observed to be low in this study and did not meet the RNI levels, a finding similar to that of the MyHeARTs study [33]. The low iron intake could be attributed to a reduction in iron absorption caused by a low vitamin C intake [47]. Even though zinc and iron-rich foods such as meat/poultry and grains/cereals in the current study meet the national recommendation in terms of serving size, both zinc and iron intakes remain insufficient, as observed in the majority of adolescents in the study.
This study found that 27.7% of the adolescents fell under the category of poor diet quality (< 51%) which is much lower than that seen in the previous local studies on adolescents [4849]. In addition, when examining each of the HEI components for food groups based on the mean serving size per day, the adolescents failed to meet the serving sizes recommended by the Malaysian food pyramid 2020 [27] for all food groups, except for meat, poultry, and eggs as well as grains and cereals. A similar outcome was observed in a local study [49] wherein the majority of participants failed to meet the recommended intakes of vegetables, fruit, milk and milk products, fish, and legumes. An evaluation of the percentage of energy from total fat intake and sodium intake showed that the urban poor adolescents in this study consumed more sodium and fat than was recommended in terms of serving size per day. This finding was not surprising given that urban poor communities in general face challenges in accessing healthy food and tend to consume unhealthy foods that are high in calories and low in nutrients [50]. Ultra-processed food and local foods high in oil and salt were also commonly consumed in the urban poor communities, thus increasing fat and salt consumption [51]. A similar outcome was found in the local study [52] in which the majority of adolescents did not meet the recommended range for sodium intake, and this could be a concern as excessive sodium intake was associated with elevated blood pressure, even among children and adolescents [53]. The above leads us to conclude that low dietary diversity was observed among the urban poor adolescents in this study. Nevertheless, the comparison with past findings on diet quality among adolescents has to be interpreted with caution as different cut-off points were used in defining poor diet quality in the past, whereas the current study refers to the latest Malaysian food pyramid 2020 [27] recommendations.
The study findings show a significant association between dietary intake and diet quality with food security status among urban poor adolescents. There was a significant variation in dietary intake with changes in the food security status, particularly for dietary energy, proteins, carbohydrates, dietary fiber, folate, and vitamin C. Urban poor adolescents who experienced food insecurity (household insecure, individual insecure, and child hunger) were reported to consume lower dietary energy, proteins, carbohydrates, dietary fiber, folate, and vitamin C than household food secure adolescents. Besides, riboflavin intake was also found to be significantly associated with food security status. This is reflected in the pattern of food group intake with lower intake of legumes, fruits, fish, and seafood as food insecurity worsened. This finding, however, contradicted the results of the Korea National Health and Nutrition Examination Survey among adolescents [54], which found no significant differences in the intakes of all nutrients by food security status except for dietary intakes of carbohydrates, fats, and saturated fatty acids. This contradiction could be due to the differences in study settings in terms of food accessibility and availability as well as socio-cultural differences in the food consumption patterns and food preparation methods.
In addition to the significant variation in the dietary intake with food security status, this variation was also reflected in the diet quality. There was a significant decrease in the diet quality score with an increase in the severity of food insecurity, particularly for food groups such as grains/cereals, fruits, and fish/seafood. Past studies have reported that the intake of grains and cereals, as well as meat/fish/poultry/legumes, decreased significantly as food insecurity worsened [135556]. Poor adherence to the national guideline recommendations for these food groups as the severity of food insecurity increased could be attributed to financial constraints and rising food prices, which limit the ability to afford a variety of food options [17]. Nonetheless, in the present study, the intake of vegetables and legumes among adolescents was similar regardless of the food security status. This finding is inconsistent with past studies [555657] wherein the food secure groups consumed more vegetables and legumes compared to the food insecure groups. The mean nutrient score of adolescents in the individual insecure group for sodium was significantly higher than those of the household food secure group in the present study. This was contradicted by past studies [54], in which the food security status showed no significant association with sodium intake. These inconsistent findings could be due to differences in the food consumption pattern. Nevertheless, the sodium intake is still considered high in all the groups and is a matter of concern.
In conclusion, food insecurity was associated with poor diet quality among urban poor adolescents in this study. This was consistent with findings from a study among low-income adults in the US, which found that households with very low food security had lower total diet quality scores than households with full food security after controlling for sociodemographic characteristics and total energy intake [58]. Another study from Taiwan revealed similar findings that perceived that food insecurity among children and adolescents from economically disadvantaged households was negatively associated with dietary quality [59]. The rising food prices may have limited healthy food options, leading to a reduction in food consumption among food insecure households and consequently, poor diet quality. Food insecurity makes individuals more vulnerable to a poor quality diet and low essential nutrient intake levels [4]. This is especially the situation among urban poor dwellers [60]. Additionally, low-cost and high-calorie-dense diets are generally common among food insecure households [55]. This growing body of evidence suggests that food insecurity influences multiple aspects of diet quality and can have a significant impact on adolescent health.
This study is not without limitations. This is a cross-sectional study that was unable to establish cause and effect relationships. Furthermore, the results of the study may not be representative of the whole population of adolescents in Malaysia as convenience sampling was used and the present study only focused on the urban poor adolescents in Kuala Lumpur, Malaysia. As the dietary assessment used was a 2-day 24-h dietary recall of one weekday and one weekend, it may not reflect the adolescent’s actual dietary intake. Hence, there is a possibility of recall bias and insufficient dietary data especially for weekdays, resulting in possible under-reporting or over-reporting of dietary intakes. Besides, the impact of coronavirus disease 2019, which was not measured in this study, may also affect the food security and dietary intake of urban poor adolescents and should be assessed in future studies. Despite these limitations, this study provides some valuable information on the food security, dietary intake, and diet quality of urban poor adolescents. Food insecurity and nutrient deficiency represent appreciable concerns for urban poor households in Malaysia. Future research can be conducted in the form of longitudinal studies observing the direct causal effects of the food security status on dietary intake and quality among the urban poor adolescent population.
To conclude, urban poor adolescents in this study had a poor diet quality that requires improvement. Their consumption of nutrients and food groups such as vegetables, fruits, fish and seafood, legumes, and milk and dairy products, as well as total fat and sodium intake did not meet the recommendations of the national guidelines. There was a high prevalence of food insecurity among adolescents in this study which contributed to poor diet quality among the urban poor adolescents. The findings from this study warrant efforts to promote improved dietary intake and quality among adolescents from low-income households. Further longitudinal studies are needed to comprehensively understand this association for the improvement of food insecurity and diet quality among urban poor communities.
 XML Download