

 PDF
PDF Citation
 Print
Print


INTRODUCTION
According to the World Health Organization, diabetes is a non-communicable, fatal disease, the incidence of which is increasing worldwide [123]. According to the statistics on the major causes of death in 2019 published by the Korea National Statistical Office, diabetes was ranked 6, and is considered to be a serious disease [3]. In 2018, the prevalence of diabetes was estimated to be 13.8% (approximately 1 in 7 people) in adults aged 30 yrs, and 27.6% (approximately 3 in 10 people) in those aged 65 yrs [4]. In addition, the prevalence of impaired fasting glucose (IFG) has continuously increased from 17.4% in 2005 to 26.9% in 2018 in adults aged 30 yrs [45].
Currently, most patients with type 2 diabetes mellitus (T2DM) are overweight or obese [6]. In Korea, from 2016 to 2018, the prevalence of overweight (body mass index [BMI] 23.0 to 24.9 kg/m2) and obese (BMI ≥ 25.0 kg/m2) patients with T2DM was 22.9% and 53.2%, respectively [5]. Moreover, obese patients with T2DM require active weight management, and continuous weight loss can improve their blood glucose levels [7].
Diabetes-specific oral nutritional supplements (ONS) are nutritionally balanced products that patients with T2DM can consume to improve their nutritional status and blood glucose levels [8]. After consuming ONS, patients with T2DM with weight loss experienced an increase in albumin level and a decrease in glycated hemoglobin (HbA1c) level, confirming that the nutritional status and glycemic profile were improved [910]. In a study comparing standard ONS, diabetes-specific ONS effectively improved postprandial glucose (PPG) and HbA1c [11].
D-allulose, a C-3 epimer of D-fructose with almost zero calories, accounts for approximately 70% of the sweetness of sucrose and is rarely found in nature [12]. It is used as a sugar substitute and is generally recognized as safe [13]. Furthermore, it has emerged as a functional sweetener with antidiabetic and antiobesity effects [1415]. An animal model of diabetes revealed lowered glucose absorption and insulin resistance and showed PPG reduction while improving the β-cell function of the pancreas, where insulin is secreted upon consumption with allulose [14]. In overweight or obese adults, consuming a non-carbonated beverage with zero calories containing 14 g of allulose daily for 12 weeks resulted in a decrease in body weight and BMI [16].
We noted the effects of diabetes-specific ONS, including allulose, on the body weight and blood glucose levels of overweight or obese patients with T2DM. Interventional studies have reported improved blood glucose levels in participants with T2DM [1718]. However, no studies have yet reported that diabetes-specific ONS leads to weight loss in overweight or obese patients with T2DM. Moreover, no interventional studies have yet investigated the effect on body weight and blood glucose levels of the incorporation of alternative sweeteners into ONS. Therefore, this study aimed to evaluate the efficacy and safety of diabetes-specific ONS containing allulose on blood glucose levels and body weight changes in overweight or obese patients with T2DM after 8 weeks of intervention.
Go to : 
SUBJECTS AND METHODS
Study participants
The inclusion criteria were as follows: participants with T2DM for more than 3 months, BMI in the range of 23–34.9 kg/m2, and age 30–70 yrs. The exclusion criteria were as follows: history of gastrointestinal surgery within the last 6 months, uncontrolled hypertension, renal or liver dysfunction, chronic gastrointestinal disorder, cancer, alcoholism, mental illness, BMI ≤ 22.9 kg/m2 or ≥ 35.0 kg/m2, pregnancy or breastfeeding, allergy or hypersensitivity to ingredients of the test product, and participation in another clinical trial within a month. A total of 33 participants were recruited for this study. Three participants who met the exclusion criteria were excluded. Participants who voluntarily withdrew (n = 3) or violated the study protocol (n = 1) were also excluded from the study. Thus, a total of 26 participants were enrolled in the study.
The study participants were recruited from Kyung Hee University Hospital (Seoul, Korea) between September 2019 and June 2020. The purpose and contents of the study were explained to the participants in detail, and informed consent was obtained. This protocol was approved by the Institutional Review Board (IRB) of Kyung Hee University Medical Center (IRB No. KHUH 2019-04-021) and complied with the Declaration of Helsinki.
Study design and test product
This study was designed as a single-arm, historical-control pilot clinical trial to evaluate the efficacy and safety of ONS for 8 weeks. After recruiting participants who provided written informed consent, efficacy was assessed by monitoring obesity parameters, glycemic profiles, and lipid profiles, and safety was evaluated through monitoring of clinical pathology examination, adverse events, and vital signs at Kyung Hee University Medical Center. The participants maintained their usual lifestyles and visited the clinic at baseline and at weeks 4 and 8.
Participants were instructed to consume 2 packs of diabetes-specific ONS, including allulose (200 kcal/200 mL), instead of breakfast every morning for 8 weeks. We emphasized that the study participants ingested the ONS all at once or in divided quantities by 11 a.m. at the latest every day and refrained from eating other foods in this period. Lunch and dinner were consumed as normal during the intervention period. The test product consisted of 35% carbohydrate, 20% protein, and 45% fat (30.3% of the total energy as monounsaturated fatty acid [MUFA]). The proportions of long- and medium-chain triglycerides were 100% and 0%, respectively. Nutrient composition of diabetes-specific ONS-supplemented allulose (Daesang Life Science, Seoul, Korea; Daesang Corp. Ingredient BU, Seoul, Korea) is listed in Table 1.
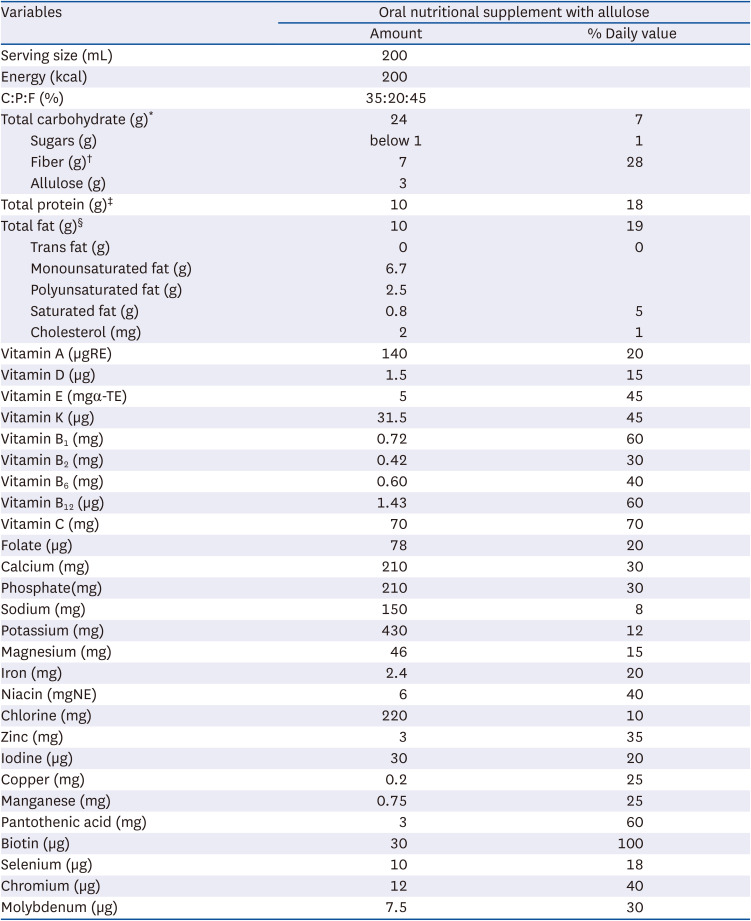
Table 1
Nutrient composition of oral nutritional supplements with allulose
% Daily value, percentage daily values are based on a 2,000 calorie diet; C:P:F, ratio of carbohydrate to protein to fat.
*Maltodextrin, allulose; †Nondigestible maltodextrin, soybean fiber; ‡Sodium caseinate, isolated soybean protein; §Canola oil, sunflower oil.
![]()
Anthropometric measurements and blood pressure
The body composition of the participants was measured at baseline and at 8 weeks. Height was measured using a stadiometer (BSM370; Biospace, Seoul, Korea). Weight and BMI were determined by bioelectrical impedance analysis (InBody720; Biospace). Height and weight were measured to the nearest 0.1 cm and 0.1 kg, respectively. The participants were asked to maintain a state of fasting and to wear light clothing without socks. Waist circumference (WC) and hip circumference (HC) were assessed using a flexible tape. The waist-to-hip ratio (WHR) was calculated as WC divided by HC. Blood pressure was measured in participants sitting comfortably for at least 5 min, with the machine placed at the same level as the heart.
Glycemic profiles
Oral glucose tolerance test (OGTT) results and fasting blood glucose (FBG), serum insulin, C-peptide, and HbA1c levels were collected at baseline and at 8 weeks. Blood samples were collected after an 8 h overnight fast. FBG, OGTT, and HbA1c levels were measured from venous blood in ethylenediaminetetraacetic acid (EDTA)-treated tubes. Glucose levels were determined using an enzymatic colorimetric glucose oxidase assay (ADAMS glucose GA-1171; Arkray, Kyoto, Japan) and HbA1c levels were measured using high-performance liquid chromatography (HLC-723G8; Tosho, Tokyo, Japan). The OGTT was performed by ingesting a 75 g glucose solution, and blood glucose concentrations were measured during the fasting state (0 min) and at 30, 60, 90, and 120 min. Serum insulin and C-peptide were collected from venous blood in serum separate tubes (SST) and measured using radioimmunoassay (Gamma-10; Shinjin Medics, Seoul, Korea). This was also performed by ingesting a 75 g glucose solution, and the concentrations were measured during the fasting state (0 min) and at 30 min. The homeostasis model assessment for insulin resistance (HOMA-IR) was calculated using the following equation [19]:
Biochemical profiles
Venous blood specimens from lipid profiles and clinical pathology examinations were measured at baseline and at 8 weeks and collected from participants who fasted for more than 8 h. Triglyceride (TG), total cholesterol (TC), low-density lipoprotein cholesterol (LDL-C), high-density lipoprotein cholesterol (HDL-C), and free fatty acid (FFA) levels were measured and collected in SST tubes. All blood samples were left to clot at room temperature for approximately 30 min before being centrifuged at 3,000 rpm for 10 min. TG, TC, LDL-C, and HDL-C levels were determined using an enzymatic assay (AU5800; Beckman Coulter, Brea, CA, USA) and FFA levels were measured using colorimetry (Labospect 008AS; Hitachi, Tokyo, Japan).
Dietary assessment
To measure the nutrient intake of the participants based on their usual meals, a 3-day food record was used. The participants were asked to maintain their eating habits until the end of the study. On the baseline day, a well-trained dietitian educated the participants on how to write a 3-day food record, including 2 weekdays and a weekend day. In addition, the dietitian conducted interviews on each visit. The actual amount of intake was compared and rechecked using food models; measuring cups, spoons, and food ingredients; and cooking methods were investigated in detail. Average daily nutrient intake was analyzed using a computer-aided nutritional analysis program (CAN-pro 5.0; Korean Nutrition Society, Seoul, Korea).
Physical activity
Physical activity was evaluated using the Korean version of the International Physical Activity Questionnaire (IPAQ) Short Form, designed to accurately assess physical activity levels [20]. The IPAQ was completed at baseline and after 8 weeks. The participants were required to outline their physical activities over the past 7 days based on their visit. Physical activity was defined as the metabolic equivalent of Task (MET) score. Physical activity time was categorized as follows: vigorous (8 METs × activity min/day × activity day/week), moderate (4 METs × activity min/day × activity day/week), and walking (3.3 METs × activity min/day × activity day/week). The total MET score was calculated as the sum of the vigorous, moderate, and walking MET scores. Physical activity was classified as inactive (< 600 MET-min/week), minimally active (600 ≤ MET-min/week < 3,000), or health-enhancing (≥ 3,000 MET-min/week).
Statistical analysis
We analyzed the per-protocol set. All statistical analyses were performed using SPSS version 25.0 (IBM Corp., Armonk, NY, USA). All variables were tested for normality using the Shapiro-Wilk test, and a paired t-test or Wilcoxon signed-rank test was used to compare the pre- and post-test product consumption changes. Continuous variables are presented as the mean ± SD, and discrete variables are expressed as the n (%). Statistical significance was set at P < 0.05.
Go to :
RESULTS
General characteristics
The general characteristics of the participants who completed the study protocol are shown in Table 2. The mean age was 58.23 ± 6.19 yrs (age range 30–70 yrs), and the proportion of men was 53.80%. Participants spent an average of 2,844.46 ± 2,202.53 MET-min/week and their physical activity level was minimal (600 ≤ MET-min/week < 3,000). The proportions of inactive, minimally active, and health-enhancing patients were 7.69%, 46.15%, and 46.15%, respectively. Of the participants, 46.20% drank alcohol with a mean frequency of 2.04 ± 1.63 times per week and consumed a mean of 6.25 ± 4.21 glasses at a time. Among the participants, 23.08% were smokers who smoked 78.33 ± 36.01 cigarettes per week (approximately 4 packs a week). The proportions of participants with complications and a family history of the disease were 84.62% and 69.23%, respectively.
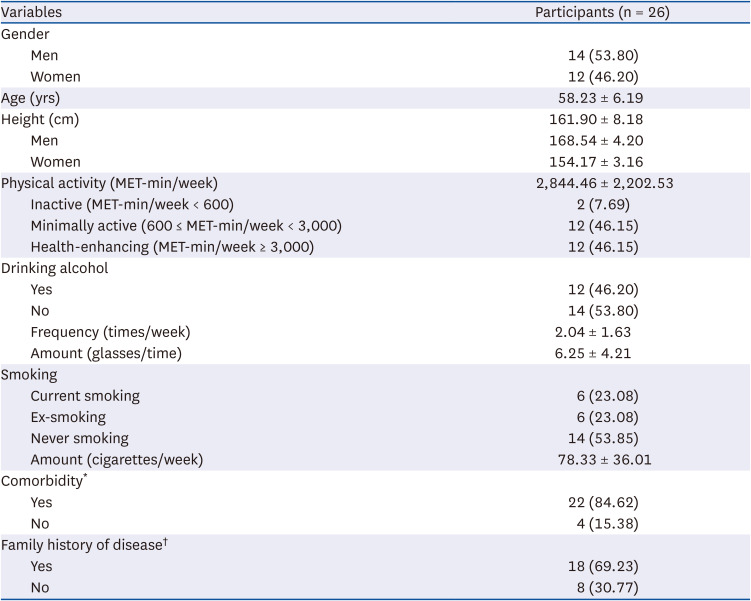
Table 2
General characteristics of the participants at baseline
All values are expressed as mean ± SD or n (%).
MET, metabolic equivalents of task.
*Diabetes mellitus, hypertension, angina, hyperlipidemia, gout, hypothyroidism, diabetic retinopathy, diabetic neuropathy, osteoporosis, spinal stenosis, and renal calculus; †Diabetes mellitus, hypertension, angina, cancer (gastric, pancreatic, prostate, bladder, breast, rectal, liver, lung, and colorectal).
![]()
Obesity-related parameters
Regarding obesity-related parameters (Table 3), body weight significantly reduced during the 8 weeks period in both men and women participants (from 67.20 ± 8.29 kg to 66.43 ± 8.12 kg, P = 0.008). In addition, the BMI decreased from 25.59 ± 1.82 kg/m2 to 25.30 ± 1.86 kg/m2 (P = 0.009). Specifically, the reduction in BMI changed the proportion of participants based on BMI. At baseline, the proportion of participants with normal weight was 0%, which increased to 7.69% at 8 weeks. The WC at 8 weeks was lower than that at the baseline (88.77 ± 7.14 cm vs. 87.46 ± 6.51 cm, P = 0.003). However, the differences in HC and WHR between pre-and post-intervention were not significant. When the participants were classified based on sex, the obesity-related parameters, including weight, BMI, WC, HC, and WHR, were found to decrease post-intervention only in men (weight, δ: −1.01 ± 1.43 kg; P = 0.019; BMI, δ: −0.37 ± 0.52 kg/m2, P = 0.020; WC, δ: −1.68 ± 1.32 cm, P = 0.000; HC, δ: −1.00 ± 1.11 cm, P = 0.006; WHR, δ: −0.01 ± 0.12, P = 0.028).
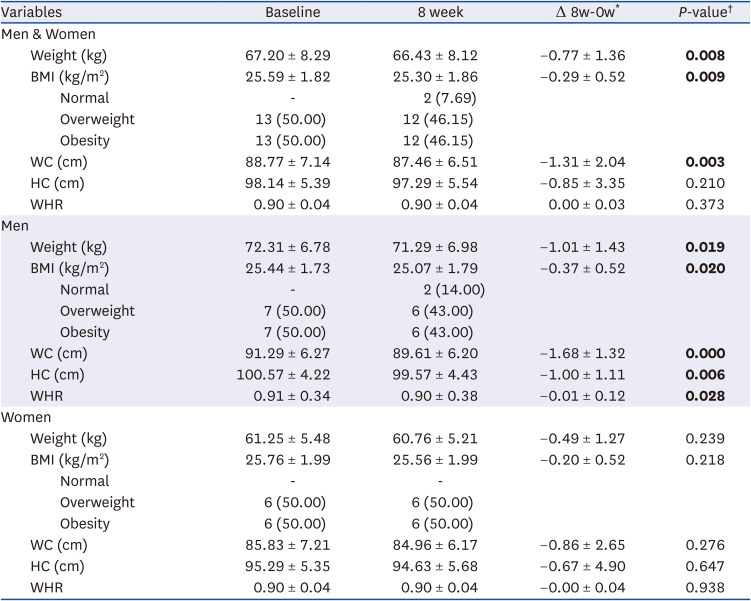
Table 3
Obesity-related parameters of the participants
Values are expressed as mean ± SD.
BMI, body mass index (Normal: ≥ 18.5 kg/m2 and < 23.0 kg/m2, Overweight: ≥ 23.0 kg/m2 and < 25.0 kg/m2, Obesity: ≥ 25.0 kg/m2); WC, waist circumference; HC, hip circumference; WHR, waist hip ratio.
*Subtracting the baseline from the 8-week; †P-value were determined by paired t-test or Wilcoxon signed-rank test. Bold indicates significant at P-value < 0.05.
![]()
Blood biomarkers related to glycemic profiles
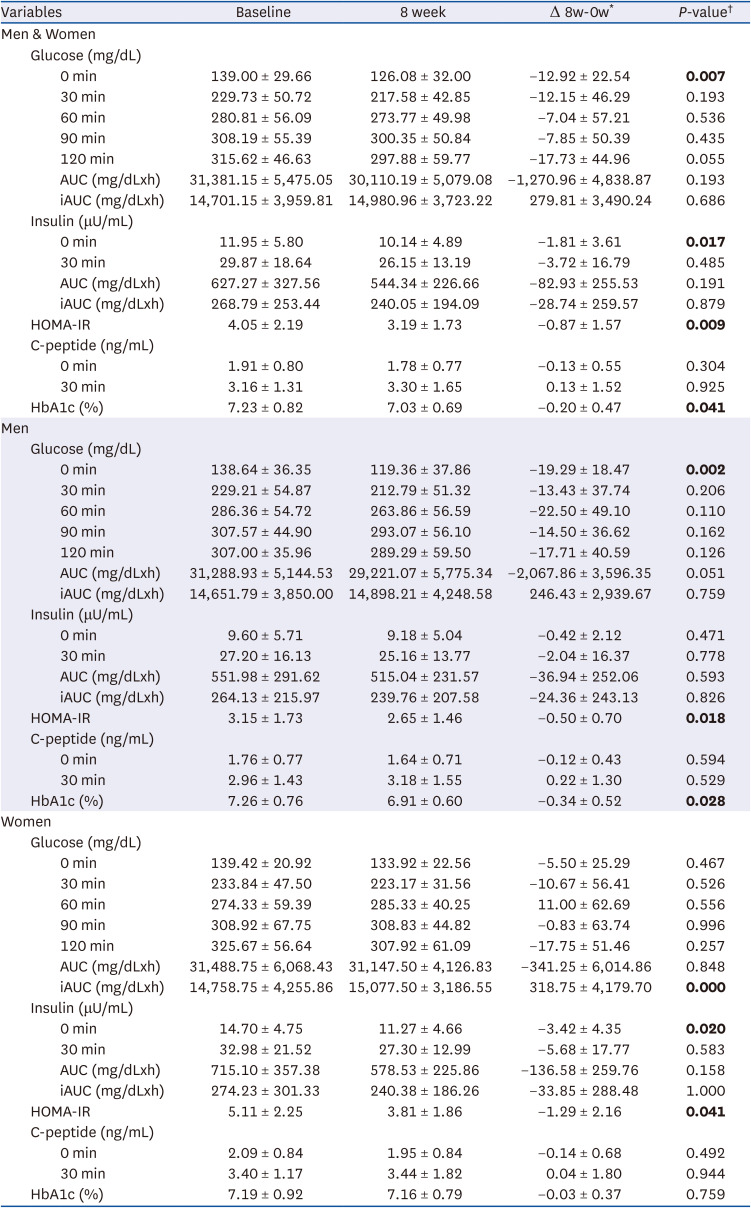
The measured blood biomarkers related to the glycemic profiles are presented in Table 4. FBG significantly decreased from 139.00 ± 29.66 mg/dL to 126.08 ± 32.00 mg/dL after consumption of ONS with allulose (P = 0.007), FBG reduced significantly in men than in women (men, δ: −19.29 ± 18.47 mg/dL, P = 0.002; women, δ: −5.50 ± 25.29 mg/dL, P = 0.467). The PPG response increased constantly to 120 min (315.62 ± 46.63 mg/dL) before the intervention; however, it gradually diminished after reaching a peak at 90 min (300.35 ± 50.84 mg/dL) after the intervention. Although no significant difference was found in the OGTT results at baseline and at 8 weeks, PPG levels after the intervention tended to be lower than those before the intervention (Fig. 1). The area under the curve (AUC) and incremental area under the curve (iAUC) for blood glucose levels did not differ between pre- and post-intervention. However, the iAUC in women showed a significant decrease at 8 weeks (δ: −3.42 ± 4.35 mg/dLxh, P = 0.000). Fasting insulin was significantly reduced at 8 weeks compared to before intervention (11.95 ± 5.80 μU/mL vs. 10.14 ± 4.89 μU/mL, P = 0.017), and showed a decrease in women (δ: −3.42 ± 4.35 μU/mL, P = 0.020). The reduction effect of HOMA-IR (4.05 ± 2.19 vs. 3.19 ± 1.73, P = 0.009) was observed in both men and women (men, δ: −0.50 ± 0.70, P = 0.018; women, δ: −1.29 ± 2.16, P = 0.041) at 8 weeks. HbA1c improved from 7.23 ± 0.82% to 7.03 ± 0.69% (P = 0.041), which decreased only in men (7.26 ± 0.76% vs. 6.91 ± 0.60%, P = 0.028). However, the AUC and iAUC for insulin, postprandial insulin, and C-peptide responses did not differ between pre-and post-intervention.
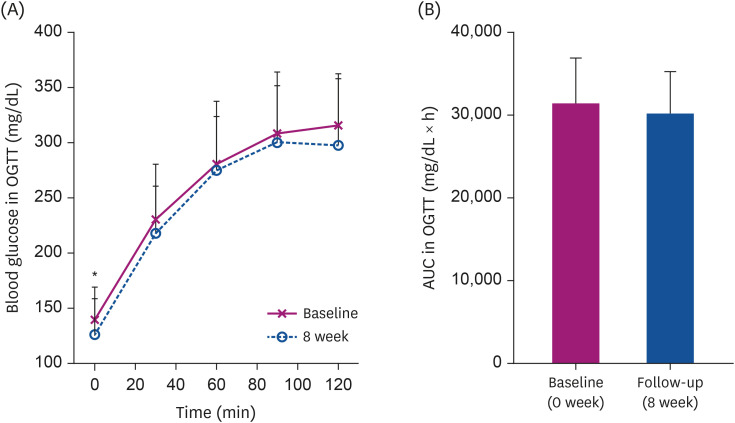 | Fig. 1Change in blood glucose at each time point (A) and in AUC according to consumption (B) among all participants.AUC, area under the curve; OGTT, oral glucose tolerance test.
Significant differences between groups were determined by the paired t-test or Wilcoxon signed-rank test at *P < 0.05.
|
Table 4
Blood biomarkers related to glycemic profiles of the participants
All values are expressed as mean ± SD.
HOMA-IR, homeostatic model assessment-insulin resistance; HbA1c, glycosylated hemoglobin, AUC, area under the curve; iAUC, incremental area under the curve.
*It means subtracting the baseline from the 8-week; †P-value were determined by Paired t-test or Wilcoxon signed-rank test. Bold indicates significant at P-value < 0.05.
![]()
Blood biomarkers related to lipid profiles
There were no significant differences in TC, TG, LDL-C, and FFA levels in either men or women until 8 weeks of intervention (Table 5). HDL-C level was decreased significantly in men than in women (53.14 ± 9.17 mg/dL vs. 47.57 ± 6.26 mg/dL, P = 0.002), and this trend was maintained after 8 weeks of intervention (54.46 ± 11.94 mg/dL vs. 50.65 ± 10.30 mg/dL, P = 0.002). However, it was within the normal ranges.
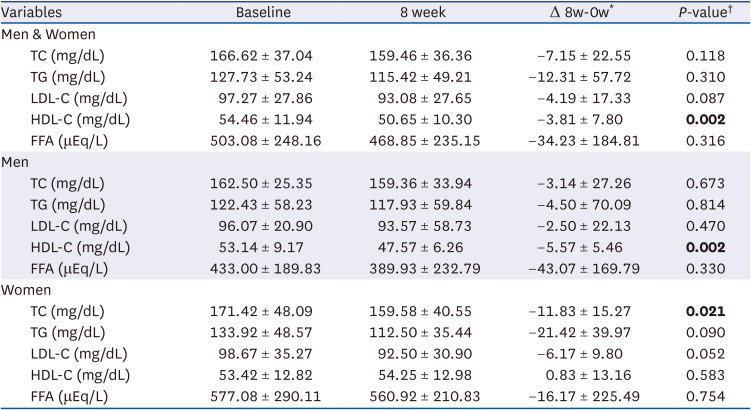
Table 5
Blood biomarkers related to lipid profiles of the participants
All values are expressed as mean ± SD.
TC, total cholesterol; TG, triglyceride; LDL-C, low-density lipoprotein cholesterol; HDL-C, high-density lipoprotein cholesterol; FFA, free fatty acid.
*Subtracting the baseline from the 8-week; †P-value were determined by Paired t-test or Wilcoxon signed-rank test. Bold indicates significant at P-value < 0.05.
![]()
Change in breakfast nutrient intake of men
As breakfast was replaced with ONS, breakfast intake in men was classified based on total daily meals (Table 6). There were no significant difference in calorie intake for breakfast, lunch, and dinner. Protein intake during breakfast was not significantly different before and after the intervention. At the end of the intervention, carbohydrate intake (δ: −36.14 ± 28.05 g, P = 0.002) decreased; however, fiber (δ: 7.02 ± 3.17 g, P = 0.001) and allulose (δ: 5.86 ± 0.54 g, P = 0.000) intake increased. Total fat (9.34 ± 5.96 g vs. 20.58 ± 2.18 g, P = 0.001), MUFA (2.45 ± 2.31 g vs. 13.48 ± 0.32 g, P = 0.001), and polyunsaturated fat (PUFA) (3.67 ± 5.18 g vs. 4.93 ± 0.26 g, P = 0.022) intake increased significantly at 8 weeks. However, cholesterol intake decreased post-intervention compared to pre-intervention (δ: −85.04 ± 118.66 mg, P = 0.004). The ratio of macronutrients at breakfast after the intervention was similar to that of the ONS. For lunch and dinner, no significant change in macronutrient intake was found after 8 weeks of intervention.
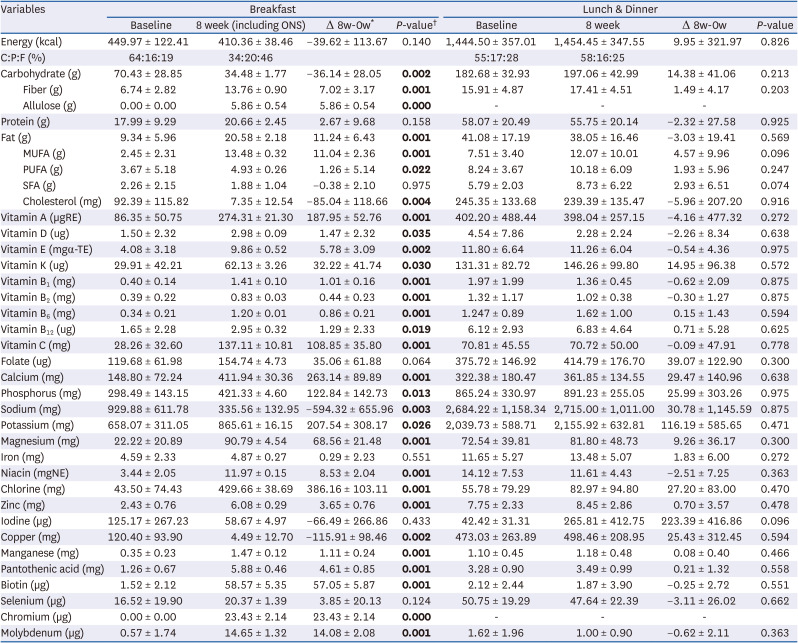
Table 6
Change in nutrient intake of men for breakfast and lunch & dinner
All values are expressed as mean ± SD.
ONS, oral nutritional supplement; MUFA, monounsaturated fat; PUFA, polyunsaturated fat; SFA, saturated fat; C:P:F: carbohydrate to protein to fat ratio.
*It means subtracting the baseline from the 8-week; †P-value were determined within group changes by Paired t-test or Wilcoxon signed-rank test at P < 0.05.
![]()
Change in breakfast nutrient intake of women
The breakfast nutrient intake in women is presented in Table 7. The change in macronutrients was the same as that observed in men. No significant difference were found in the calorie intake before and after the intervention. After 8 weeks of intervention, carbohydrate intake (δ: -15.56 ± 17.62 g, P = 0.015) decreased; however, fiber (δ: 8.13 ± 3.17 g, P = 0.002) and allulose (δ: 6.00 ± 0.00 g, P = 0.001) intake increased. Total fat (10.56 ± 3.35 g vs. 20.00 ± 0.00 g, P = 0.002), MUFA (3.27 ± 2.72 g vs. 13.40 ± 0.00 g, P = 0.002), and PUFA (2.95 ± 1.65 g vs. 5.00 ± 0.00 g, P = 0.005) intake increased significantly post-intervention compared to pre-intervention. However, cholesterol intake decreased at 8 weeks (δ: −122.56 ± 94.26 mg, P = 0.002) compared to pre-intervention. The ratio of macronutrients at breakfast after the intervention was the same as that of the ONS. For lunch and dinner, there were no significant differences in macronutrient intake after intervention.
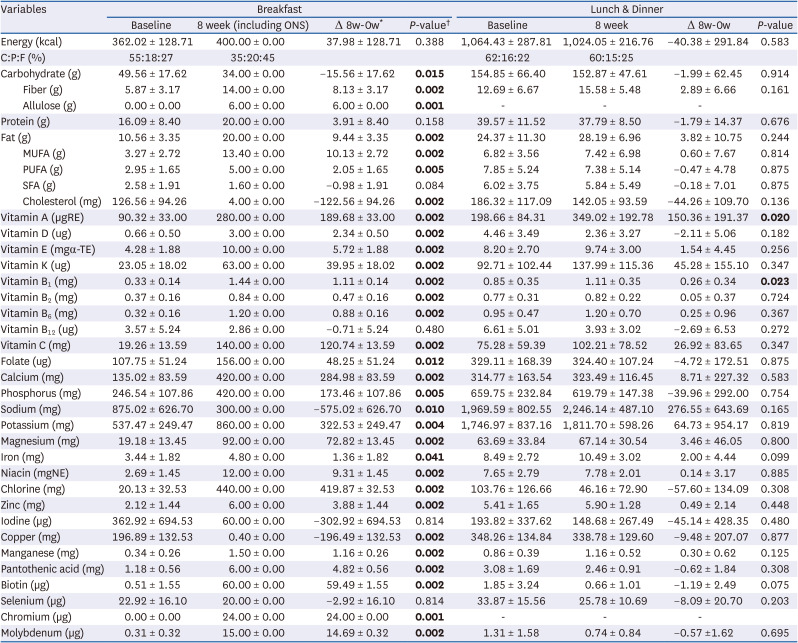
Table 7
Change in the nutrient intake of women for breakfast and lunch & dinner
All values are expressed as mean ± SD.
ONS, oral nutritional supplement; MUFA, monounsaturated fat; PUFA, polyunsaturated fat; SFA, saturated fat; C:P:F: carbohydrate to protein to fat ratio.
*It means subtracting the baseline from the 8-week; †P-value were determined within group changes by Paired t-test or Wilcoxon signed-rank test at P < 0.05.
![]()
Change in the total daily nutrient intake
The total daily nutrient intake of the study participants according to the consumption of diabetes-specific ONS with allulose for 8 weeks was as follows: The total intakes of energy, carbohydrate, and protein were not significantly different before and after the intervention. After 8 weeks of intervention, the fiber intake improved from 20.77 ± 7.65 g to 30.43 ± 4.92 g (P = 0.000). Allulose intake also increased significantly from 0.00 ± 0.00 g to 5.92 ± 0.39 g (P = 0.000). Cholesterol intake decreased from 326.26 ± 189 mg to 200.27 ± 138.70 mg after intervention compared to before intervention (P = 0.002); however, total fat (43.28 ± 18.75 g vs. 53.81 ± 14.23 g, P = 0.005) and MUFA (10.01 ± 4.46 g vs. 23.37 ± 9.05 g, P = 0.000) intake increased significantly at 8 weeks. The percentage of macronutrient intake (carbohydrate, protein, and fat) changed from 58%, 17%, and 25% to 53%, 17%, and 30%, respectively, after consumption of diabetes-specific ONS with allulose. The percentage of carbohydrate intake decreased by 5%, whereas fat intake increased by 5%.
Nutritional intervention improved in the following nutrients: vitamins A, E, K, B1, B2, B6, C, folate, calcium, phosphorus, potassium, magnesium, iron, niacin, chlorine, zinc, copper, manganese, pantothenic acid, biotin, chromium, and molybdenum (P < 0.05). However, no significant changes were observed in the vitamin D, vitamin B12, sodium, iodine, and selenium levels. No serious adverse events developed in any of the participants (data not shown).
Go to :
DISCUSSION
The effect of diabetes-specific ONS with allulose on glycemic control and weight change in overweight or obese participants with T2DM was assessed for 8 weeks. Diabetes-specific ONS containing allulose reduced weight, BMI, and WC. In particular, the proportion of overweight and obese individuals decreased by 3.85% after the intervention (50.00% vs. 46.15%), while the proportion of normal weight increased from 0% to 7.69%. In addition, FBG, fasting serum insulin, HOMA-IR, and HbA1c levels improved significantly.
Although breakfast was replaced with 2 cans of ONS for 8 weeks, there was no difference in breakfast calories before and after the intervention; therefore, weight loss was not considered to be an effect of breakfast intake restriction. The nutritional intake of participants showed significant improvement compared to that before the intervention. Consistent intake of ONS for 8 weeks resulted in nutritional balance, which may have exerted a weight loss effect. However, weight loss was found to be more influenced by men. This result may be partially explained by the fact that some of the women were menopausal; this period is related to weight gain caused by the rapid decrease in the women hormone estrogen [21]. For this reason, it may be more effective for men than for women.
Diabetes-specific ONS have low carbohydrate content and are rich in MUFA [8]. Increasing the MUFA ratio instead of lowering the carbohydrate content in nutritional supplements helps to control blood glucose levels [22]. In previous studies, when patients with T2DM consumed a diabetes-specific formula (DSF) (37% carbohydrate and 32% MUFA of the total energy) for 12 weeks, the FBG, HbA1c, and insulin requirements improved compared to those who consumed the standard formula (SF) (52% carbohydrate and 17% MUFA of the total energy) [2324]. A recent systematic review and meta-analysis reported that DSF, including high MUFA, had a beneficial effect on glycemic control by improving FBG and HbA1c levels compared with formulas containing high carbohydrates in patients with T2DM [25]. Another systematic review reported that DSF effectively improved PPG, HbA1c, and insulin response [26]. Our study product had a MUFA content of 30.3% and a carbohydrate content of 35% of the total energy, similar to that reported in a previous study. As a result, participant’ carbohydrate intake decreased and fat intake increased. However, the intakes of healthy fats, unsaturated fatty acids (MUFA and PUFA), increased, and intakes of unhealthy fats, saturated fat (SFA) and cholesterol, decreased.
Increasing MUFA content is an effective strategy to lower blood glucose by reducing PUFA and SFA intake [24]. High SFA intake increases LDL-C, the cause of atherosclerosis; however, replacing SFA with MUFA and PUFA reduces LDL-C level and lowers the risk of cardiovascular disease [27]. The most important reason for the increase in MUFA content instead of PUFA content is related to the reduction in blood glucose levels. MUFA-rich diet has shown to result in a significant decrease in FBG levels compared to the PUFA-rich diet [28]. A systematic review and meta-analysis reported that a diet high in MUFA reduced both FBG levels and body weight [29]. The ONS used in this study had a higher content of MUFA than PUFA and SFA through modified fat content, which was similar to previous studies on a MUFA-rich diet.
The presence of highly soluble fiber in the diabetes-specific ONS used in this study may also have played a role in improving blood glucose levels. ONS contains non-digestible maltodextrin (soluble fiber) [30] and soybean fiber (soluble and insoluble fiber) [31], and the proportions of soluble and insoluble fibers accounts for 80% and 20%, respectively. Soluble fibers lowers blood glucose by delaying the digestion and absorption of glucose [22], whereas insoluble fibers prevents constipation [32]. Thus, an increase in the content of soluble fibers was considered. Similarly, studies containing 4 g or 2.4 g of soluble fiber in diabetes-specific ONS (200 g) reported a decrease in PPG [33] or in both PPG and HbA1c [34], respectively.
In this study, breakfast was replaced with diabetes-specific ONS for 8 weeks, this change promoted blood glucose control in patients with T2DM and significantly contributed to the improvement in macronutrient and micronutrient intake compared to before the intervention. Similarly, in a study examining blood glucose changes using continuous glucose monitoring (CGM) technology while taking DSF at a set meal among patients with T2DM (typical breakfast vs. morning meal and afternoon snack replaced with DSF vs. morning and bedtime meals replaced with DSF), replacing breakfast with DSF significantly improved morning PPG responses [35]. Furthermore, nighttime glucose variability improved in the group consuming DSF in the morning and afternoon snacks [35], which could be due to the influence of the low-carbohydrate content of breakfast. In a previous study, blood glucose levels were measured in patients with T2DM after consuming a low-carbohydrate breakfast. Five hours after the morning meal, blood glucose levels were the lowest among the daily glycemic changes [36]. In patients with T2DM, morning blood glucose levels were the highest within the day [35]. In particular, hyperglycemia occurs most frequently after breakfast, affecting daily glycemic variability [3738]. This may be due to an increase in both hepatic glucose production and insulin resistance [37].
As a result of classifying nutrient intake into men and women, the daily caloric intake for men and women was approximately 1,900 and 1,400 kcal, respectively, and men consumed approximately 500 kcal more than women. According to the average age of the participants, the 2020 Dietary Reference Intakes for Koreans also differed by 2,200 and 1,700 kcal for men and women, respectively [39]. Considering the caloric intake and balanced caloric intake at each meal, it seems necessary to have a different ONS intake for men and women.
The present study has several strengths. This study is the first to demonstrate the synergistic effect of diabetes-specific ONS containing allulose on lowering blood glucose and weight in patients with T2DM. Moreover, it has a positive effect on weight and blood glucose control without adverse reactions in overweight or obese patients with T2DM. Second, the participants’ compliance was good. To overcome the limitation of ONS being difficult to consume continuously for 8 weeks, we attempted to build rapport with participants and kept in contact with them via messages to confirm that they were taking the supplements every day.
The limitations of this study are that the scale of the study participants was small and there was no control group. However, there was one similar prior study which had no control group that proved the tolerability and safety of the new ONS [40]. However, the participants in this study had T2DM, and lifestyle modifications, including meals, were important in overcoming T2DM. Therefore, setting up a control group was considered a hindrance to participants’ health improvement.
In conclusion, nutritional intervention with diabetes-specific ONS containing allulose confirmed the possibility of improving blood glucose levels and obesity parameters such as FBG, HbA1c, body weight, and BMI. However, as this study did not include a control group, additional well-designed large-scale studies are required to validity these findings in the future.
Go to :
 XML Download