

 PDF
PDF Citation
 Print
Print


INTRODUCTION
Obesity is characterized by the excess accumulation or abnormal distribution of adipose tissue. This disease is a public health problem worldwide; at least one-third adults worldwide are obese, and 70 countries have doubled their prevalence of obesity in the last 25 yrs [1]. Obesity is associated with the presence of inflammation, which is a factor responsible for progressing diverse comorbidities, including insulin resistance (IR) [23].
This diminished ability of cells to respond to the stimulation of insulin or IR is triggered by the chronic inflammatory state and the excessive generation of reactive oxygen species (ROS) in the obese patient [4]. Indeed, the increase in ROS generates oxidative damage in lipids, DNA, and proteins.
One of the proteins reported as susceptible to oxidative damage by ROS is insulin [5]. Insulin oxidation by ROS generates structural changes and the formation of a non-functional insulin polymer [6]. Furthermore, this polymer has been detected in the plasma obtained from obese patients and is correlated with the presence of IR [7]. Diverse findings have established insulin oxidation to IR as a feature of pre-diabetes, and it is the first detectable abnormality in type 2 diabetes mellitus [38].
Dyslipidemia is another metabolic disorder commonly found in obese people, characterized by an imbalance of lipid fractions such as low-density lipoprotein (LDL), triglyceride (TG), and high-density lipoprotein (HDL) [9]. These lipid abnormalities result in comorbidities that, collectively with the inflammation, IR, and oxidative damage, causes development of other pathologies in the obese patient. Although controlling the glucose level in obese patients is important, decreasing the oxidative damage, inflammation, and IR and improving the lipid profile are also crucial.
In the initial phase, IR in the obese patient is associated with physical activity, diet, and pharmacological therapy [1011]. However, other side effects also impact the tolerance and adherence of patients. Interestingly, studies have demonstrated that functional foods represent an alternative in managing the alterations present in obese patients.
Studies have shown that the consumption of foods rich in polyphenols, such as fruits and vegetables, controls the blood glucose [12] and decreases the IR and oxidative stress [13]. Considering this, cocoa is a food rich in polyphenols that is widely consumed in the world.
Theobroma cacao is a tree cultivated in several American countries. The cocoa obtained from these trees form the basis of several highly consumed chocolate products worldwide. Cocoa refers to the fruit from this tree (that has not undergone any transformation) while cocoa powder is processed by the fruit manufacturer. Cocoa powder contains high levels of flavanols (also called polyphenols) which are associated with beneficial effects on health [14151617]. Cocoa mainly contains flavanols as monomers ((−)-epicatechin, (+)-catechin)) and polymers that are comprised of epicatechin subunits (proanthocyanidins), and other minor components represented by phenolic acids, flavanols, and their glycosides. In this study, we evaluate the effect of short-term cocoa consumption (7 days) on IR, lipid profile, inflammation, and oxidative damage in young adults with and without class II obesity.
Go to : 
SUBJECTS AND METHODS
Participants
The study protocol was approved by the Research and Ethics Committee of the Hospital General Yanga from Córdoba, having Institutional Review Board approval number HGC 0012/17-1. A signed informed consent was obtained from all study participants before commencing the study. The study followed the Good Clinical Practice Guidelines and was conducted in accordance with the ethical principles defined by the Declaration of Helsinki 1975, revised in 2013. An estimation of the required sample size was performed by applying the equation N = 2[(Zα + Zβ)]2 × SD2/d2 for studies on the means of groups, where N is the number of participants, Zα = Z at 95%, Zβ = Z at 80%, SD = 0.2 (variance of carbonyl groups that has the reference value) [18], and d = 0.4 (minimum value expected in the change of carbonyl groups). According to this equation, we were required to include 10 participants per study group. All participants were students recruited from the Academic Division of Basic Sciences at the Universidad Juárez Autónoma de Tabasco, México.
Since abnormal glucose metabolism and dyslipidemia have been related to an increased risk of adverse health outcomes (cardiovascular disease, type 2 diabetes, stroke, and metabolic syndrome) in male Mexican adults [1920], this study focused on enrolling men. Considering the possibility of a high drop-out rate of about 50%, 15 men were included per study group. Young adults with and without class II obesity were included because data on the effects of cocoa in these populations are scarce.
Formation of the study groups
This is a before-and-after study where 2 groups of 15 men each were included in the study: normal weight and obese. The participants were classified according to their body mass index (BMI) which was calculated by dividing the body weight in kilograms (kg) by the height in square meters (m2). In accordance with the World Health Organization definitions, participants with a BMI between 18.5–24.9 kg/m2 were considered as normoweight (NW), while the obese participants considered class II obesity (CIIO) had a BMI between 35–39.9 kg/m2 [21]. Anthropometric measurements (weight, age, height, BMI, and blood pressure) were taken in each group. The inclusion criteria were voluntary participation, age between 19 and 25 yrs, self-reported good general health status, and BMI between 18 and 25 kg/m2 or 35 and 40 kg/m2. Exclusion criteria included not signing the informed consent, smokers, subjects receiving treatment with medications, consumption of antioxidants, alcohol, food supplements and/or vitamins during the last 6 months, and presence of an active infection.
Study design and protocol
Based on their BMI, participants were assigned to the 2 groups. The clinical history, anthropometric measurements, and the blood pressure of each participant were obtained. At baseline (Day 0), the participants attended the clinic following an overnight fast (×12 h) for the collection of blood samples to determine the biochemical parameters, establish the homeostasis model assessment of insulin resistance (HOMA-IR), redox status (biomarkers of oxidative damage and antioxidant defenses), and structural changes of serum insulin.
After 24 h, each participant commenced the daily consumption of high-flavanol cocoa (0.375 g/kg body mass in 300 mL water) for 7 days; the NW and CIIO groups received an average of 25 g (1,050 mg of flavonoids) and 39 g (1,638 mg of flavonoids) per day, respectively. These intervention doses were approximately 2 times higher than doses used for observing maximal cardiovascular effects (800 mg of flavonoids) [22] and a moderate benefit on performance in healthy individuals (688 mg/day) [23].
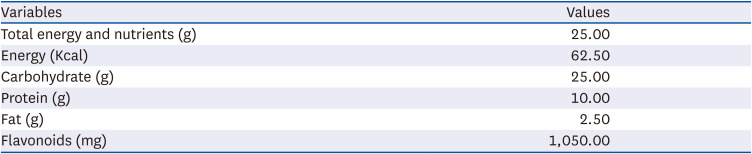
The cocoa powder used in this study was Hershey’s (100% cocoa) which has higher total polyphenols and flavanols. Furthermore, it also comprises the following ingredients: corn syrup solids, sunflower oil, and ≤ 2% food additives (salt, carrageenan, vanillin, aspartame, sodium caseinate, dipotassium phosphate, monoglycerides, acesulfame potassium, diglycerides, soy lecithin, and silicon dioxide) [24]. The nutritional content per 25 g is presented in Table 1. Participants were instructed to consume the appropriate amount of cocoa, not to change their dietary habits during the study, and avoid caffeine, tea, alcohol, red wine, dark chocolate, or dietary supplements of these foods throughout the intervention. On day 8, cocoa was not consumed, and all assessments performed at baseline were repeated.
Blood samples
A total of 10 mL blood was drawn from the antecubital vein of the arm using heparin as an anticoagulant; of this, 4 mL was separated and used to obtain plasma. The plasma was used for analyzing the biochemical parameters (2 mL) and to determine the biomarkers of oxidative stress damage, antioxidant defense, and total antioxidant capacity (TAC) (0.5 mL).
The remaining 6 mL blood was used in the assays to determine the structural changes of recombinant human insulin (see below). The same amount of blood was obtained on day 8, and all assessments performed at baseline were repeated.
Analysis of biochemical parameters
All determinations were measured by colorimetric and kinetic kits using the MINDRAY BS-120 chemistry analyzer. Blood glucose was determined using the GOD-PAP method (Wiener lab/Glicemia enzimática AA/Rosario, Argentina), and insulin levels were determined by an ELISA method (Insulina 6001011; Mex-Lab, Mexico City, Mexico).
HOMA was calculated as follows: [fasting glucose (mg/dL)/fasting insulin (lU/mL)/22.5] [25].
The lipid profile was evaluated by measuring the total cholesterol (Wiener lab/Colestat enzimático AA/Rosario, Argentina) and triglycerides (Wiener lab/TG Color GPO-PAP AA/Rosario, Argentina) using the CHOD-POD and GPO-POD methods, respectively.
High-density lipoprotein (c-HDL) (HDL Colesterol monofase AA; Wiener Lab, Rosario, Argentina) and low-density lipoprotein cholesterol (c-LDL) (LDL Colesterol monofase AA; Wiener Lab) were measured by enzymatic clearance.
C-reactive protein was evaluated by immunoturbidimetric tests (Turbitest AA; Wiener Lab).
Biomarkers of oxidative damage
The separated plasma was used to determine the biomarkers of oxidative damage. Lipid damage was assessed by the quantification of lipoperoxidation products malondialdehyde (MDA) and 4-hydroxynonenal (4-HNE) [26].
MDA was determined using 200 µL of plasma diluted in H2O (1:1) mixed with 650 µL of a solution of 1-methyl-2-phenylindole in a mixture of acetonitrile/methanol (3:1). The reaction was then started by adding 150 µL of 37% hydrochloric acid. Absorbance was measured at 586 nm after incubating the reaction mixture at 45°C for 40 min. A sample blank was included, in which the plasma was replaced by water.
4-HNE was determined following the same procedure of MDA, replacing hydrochloric acid by methanesulfonic acid containing 34 µM Fe+3 and incubated at 45°C for 30 min. The final absorbance at 586 nm was a linear function of the concentrations of both MDA and 4-HNE. Therefore, the 4-HNE concentration was assessed after subtracting the MDA concentration, and the results were expressed as micromolar concentration.
Quantification of the carbonyl groups was established as oxidative damage to proteins. Free carbonyl groups were determined in 50 µL plasma mixed with 500 µL 2,4-dinitrophenylhydrazine (dinitrophenylhydrazine [DNPH] 10 mM in 2.5 M HCl). All samples had their corresponding blank (50 µL plasma in 500 µL 2.5 M HCl). Samples and blanks were incubated for 1 h at room temperature, protected from light and with agitation every 15 min. Subsequently, 1 mL of 5% trichloroacetic acid (TCA) was added to the reaction mix and the solution was centrifuged at 3000 rpm for 10 min. After discarding the supernatant, the precipitate was dissolved in 1 mL 2.5% TCA, centrifuged at 3,000 rpm for 10 min, and the supernatant was discarded. The precipitate was dissolved in 2 mL ethanol/ethyl acetate (1:1, v/v) and centrifuged again (3,000 rpm for 10 min). The supernatant was eliminated and the precipitate was dried for 5 min, dissolved in 1 mL of 6 M guanidine containing 20 mM potassium phosphate at pH 2.3, and incubated for 10 min at 37°C. Absorbance was determined at 370 nm the DNPH formation was determined. The molar extinction coefficient for DNPH (E = 22,000/M−1/cm−1) was used to calculate the concentration of carbonyls [27]. Results are expressed in nmol of osazones/mg of protein. Total protein was measured as a reference parameter according to Lowry’s method [28].
Quantification of antioxidant defenses and antioxidant capacity
Thiol concentration and TAC are considered as a reflection of the antioxidant defense capability. Total thiol concentration was determined in 100 µL of plasma using Ellman’s reagent. The concentration of the thiol groups was measured with a photometric assay at 412 nm, which was calculated from a standard curve constructed using cysteine [29].
TAC in the plasma was assessed by a colorimetric assay kit (Cayman Chemical Company, Ann Arbor, MI, USA) according to the manufacturer’s instructions.
Determination of structural changes of insulin
Structural changes of insulin were determined using recombinant human insulin (IRH; Lily Laboratories, Mexico City, Mexico) and exposing it to the blood obtained from all study participants, according to a method previously described [530]. Briefly, 30 IU (1.5 mg) of native insulin was placed on a 5 cm portion of membrane dialysis tubing with a cut-off of 3,500 Da (Spectrum Laboratories, Inc., Rancho Dominguez, CA. USA). The dialysis tubes were incubated at 37ºC in 6 mL blood (obtained from NW or COII subjects) for 3 h. After incubation, the bags containing the insulin were washed with distilled water. Five microliters (90 µg) of insulin were used to determine the effects of blood on the insulin structure using nondenaturing polyacrylamide gels. Coomassie blue staining of the polyacrylamide gels was performed to assess any changes in the electrophoretic pattern.
Statistical analysis
Data are expressed as the mean ± SE. Student’s t-test was employed to determine intergroup differences. The paired t-test was used to determine intragroup differences before and after cocoa consumption. P-values ≤ 0.05 are considered to be statistically significant. All tests were performed using the Prism 5 software (GraphPad, San Diego, CA, USA).
Go to :
RESULTS
Baseline characteristics of anthropometrics and redox status of the participants
Two groups of participants (NW and CIIO) were included in the study. Each group included 15 participants. Data in Table 2 shows that the anthropometric features of both groups are similar. All participants were homogeneous in age and height. As expected, the obese group had higher weights and the calculation of BMI classified them as CIIO.

Table 2
Anthropometric characteristics, oxidative damage biomarkers, and antioxidant defense of the study groups
Data are shown as mean ± SE and intergroup differences were analyzed by Student’s t-test *P < 0.05.
NW, normoweight; CIIO, class II obesity; BMI, body mass index; DBP, diastolic blood pressure; SBP, systolic blood pressure, MDA, malondialdehyde; 4-HNE, 4-hydroxynonenal; TAC: total antioxidant capacity.
![]()
Since several studies indicate a relationship between obesity, inflammation, and oxidative damage, we decided to analyze the redox state of the participants. Oxidative damage was established by quantification of the respective biomarkers. A major degree of lipid damage was observed in the CIIO group as determined by the high MDA values, compared to the NW group (Table 2). No statistically significant differences were observed in the levels of 4-HNE or protein damage biomarker (carbonyl groups). Considering the antioxidant status, the CIIO group had a lower TAC in comparison with the NW group, but no differences were observed in the concentration of thiol groups (Table 2).
Biochemical and inflammatory markers before cocoa consumption
At baseline, the clinical biochemical parameters of both groups are presented in Table 3. Interestingly, the value of LDL-cholesterol (LDL-C) was higher than the accepted normal values in both groups. In addition, the CIIO group had higher levels of insulin and HOMA-IR as compared with the NW group, indicating the presence of IR (Table 3, baseline values before intervention).
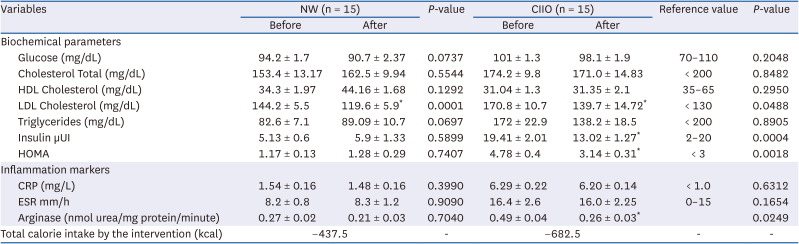
Table 3
Biochemical parameters and inflammatory markers before and after cocoa consumption
Data are expressed as mean ± SE and intragroup differences were analyzed by paired t-test *P < 0.05.
NW, normoweight; CIIO, class II obese; HDL, high-density lipoprotein; LDL, low-density lipoprotein; CRP, C-reactive protein; ESR, erythrocyte sedimentation rate.
![]()
Analysis of the inflammation markers revealed higher levels in the CIIO group as compared to the NW group (Table 3). These data suggest the presence of an inflammatory state in the CIIO group.
Modification of insulin by blood obtained from class II obesity participants
The establishment of IR in the CIIO group and the previous evidence that indicates the capacity of IR blood to modify insulin suggests that blood from these participants have the capacity to modify the hormone insulin. This was determined by analyzing the changes generated in the electrophoretic pattern of the hormone after its incubation with the blood obtained from study participants. After incubation, the hormone was loaded onto 15% nondenaturing polyacrylamide gels and separated by electrophoresis.
Coomassie blue staining of the polyacrylamide gel was performed to assess the electrophoretic pattern of the hormone. Fig. 1A shows the electrophoretic mobility of the hormone at the baseline stage. In all samples, a band of approximately 6 kDa (molecular mass of the insulin) was observed. Importantly, a band of 25 kDa was observed in all the insulin incubated in blood from CIIO participants (Fig. 1A). These data demonstrate the generation of structural changes in the insulin that modifies its electrophoretic mobility.
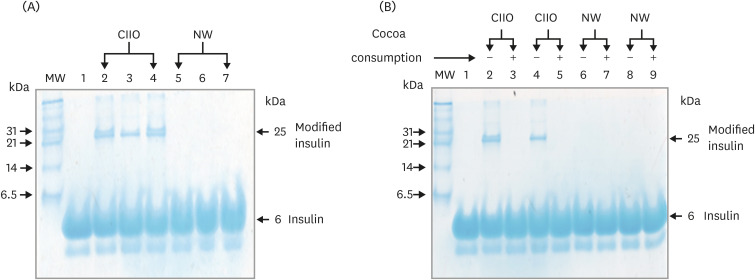 | Fig. 1Modification of insulin after incubation with blood from NW and CIIO participants. (A) Coomassie blue of nondenaturing polyacrylamide gels of insulins incubated in blood. Lane 1 native insulin, lane 2–4 and lane 5–7 are insulin incubated in blood from CIIO and NW subjects, respectively. The arrow indicates an insulin with different electrophoretic mobility and molecular mass of 25 kDa. This band appeared only in the insulin incubated in blood from CIIO participants. MW of the markers (kDa) are given on the left side of the panel. (B) Electrophoretic pattern of insulin after incubation in blood from CIIO and NW participants with and without cocoa consumption. The arrow indicates the insulin modified (25 kDa), which disappears after cocoa consumption.CIIO, class II obese; NW, normoweight; MW, molecular weight.
|
Changes generated by cocoa consumption
To investigate the effect of cocoa consumption on biochemical, inflammation, and oxidative damage biomarkers, NW and CIIO groups consumed an average of 25 and 39 g per day of cocoa for 7 days, respectively. The effects of this intervention are presented in Table 3. Interestingly, amelioration of the LDL-C level was observed in both groups. Furthermore, the improved insulin levels in the CIIO group generated a decrease in the HOMA and in IR (Table 3, values after intervention). Conversely, consumption of cocoa had no effect on CRP and ESR. However, a notable decrease was observed in the arginase activity of the CIIO group; this enzyme plays a critical role in the inflammatory process associated with obesity (Table 3, value after intervention).
We also investigated the effects of the intervention on biomarkers of oxidative damage. As shown in Table 4, consumption of cocoa resulted in reduced oxidative damage biomarkers (MDA and carbonyl groups) and generated an increase of 4-HNE in both groups. These changes were accompanied by an increase in the TAC and decrease in thiol groups (Table 4).
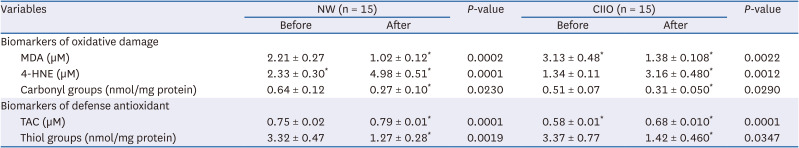
Table 4
Oxidative damage biomarkers and antioxidant defense before and after cocoa consumption
Data are expressed as mean ± SE and intergroup differences were analyzed by Student’s t-test *P < 0.05.
NW, normoweight; CIIO, class II obese; MDA, malondialdehyde; 4-HNE, 4-hydroxynonenal; TAC, total antioxidant capacity.
![]()
It is important to note that the consumption of cocoa also had a positive impact on the molecular damage observed in insulin. Before cocoa consumption, the incubation of insulin with CIIO blood generated a band of 25 kDa in the electrophoretic pattern, which was considered a modification of the hormone (Fig. 1A). Interestingly, this band disappeared in the electrophoretic pattern generated after cocoa consumption. Fig. 1B is a representative polyacrylamide gel showing the electrophoretic pattern obtained before and after cocoa consumption: a band of approximately 6 kDa was present in all samples (insulin); however, the modified insulin band (25 kDa, Fig. 1B, lane 2 and 4) disappeared after cocoa consumption (lane 3 and 5). These data demonstrate the protective effect generated by the consumption of this functional food for insulin.
Go to :
DISCUSSION
In this study, we aimed to investigate the effects of cocoa consumption on the lipid profile, IR, inflammation, and oxidative damage in normal weight and class 2 obesity participants. Cocoa powder contains high levels of polyphenols, mainly catechins, proanthocyanidins, and anthocyanins [31]. These polyphenols are present as monomers (e.g., catechin and epicatechin) and polymers that are comprised of epicatechin subunits (proanthocyanidins), and minor components represented by phenolic acids, flavanols, and their glycosides [31].
Evidence has been provided that cocoa acts as a functional food, where the substances contribute to imparting its beneficial health effects on the cardiovascular [32] and immune systems [33], and therapeutic effects against obesity, metabolic syndrome [34], and cancer [35]. Furthermore, its potential to reduce oxidative stress and decrease oxidative damage to biomolecules [36] supports possible clinical applications.
Our study shows that cocoa consumption for 7 days ameliorates the lipid profile in both, the NW and CIIO groups. Initially, high LDL cholesterol values were obtained in both groups; however, consumption of cocoa caused the levels to decrease. These data are in accordance with previous studies [373839]; indeed, it has been proposed that the LDL-C decrease triggered by flavonoids could involve a mechanism of flavanols-membranes, flavanol-lipids, and flavanol-protein interactions. These interactions probably generate varying effects in the liver and in the digestive tract: an increased expression of LDL receptors [40] and inhibition of LDL biosynthesis [41] in the liver, and inhibition in the cholesterol absorption [42] in the digestive tract. Another important benefit of cocoa consumption is the HOMA reduction in the CIIO group. We observed a significant reduction in fasting serum insulin after the intervention, but no alterations were observed in the fasting glucose level. In this context, excessive circulating insulin is associated with adipose tissue expansion and obesity; however, many researchers have suggested that hyperinsulinemia is a consequence of IR [2], with the related concept that β-cells synthesize and hypersecrete insulin to compensate for the reduced insulin activity. Our study findings suggest that the observed modification of insulin (Fig. 1A) could be related to its reduced action and to hyperinsulinemia. This hypothesis is supported by the evidence that has demonstrated that a modification of insulin hormone decreases its activity [5], and the detection of non-functional insulin complexes in humans [7]. We suggest that the increase in the antioxidant capacity due to cocoa consumption generates a protective effect against the molecular damage to insulin (Fig. 1B), and consequently re-establishes its activity and secretion. Similarly, oxidative damage has widely been implicated in protein misfolding, alteration of the secretion of insulin, and viability of pancreatic beta cells. Indeed, beta cells exhibit high sensitivity to oxidative damage due to the low expression level of antioxidant enzymes [4344]. Considering this, the prevention of oxidative damage to insulin could involve an effect at the pancreatic level. We postulate that cocoa consumption generates an increase of antioxidant enzymes at the pancreatic level, thereby protecting pancreatic beta cells and insulin against oxidative damage. This is supported by the evidence that shows that the treatment of pancreatic beta cells with cocoa phenolic extract [4546] or flavanols (epicatechin) [47] induces an antioxidant enzyme and reduces oxidative damage. In addition, the reduction of oxidative damage biomarker proteins (carbonyl groups) and lipid (MDA) by cocoa consumption also strengthens this proposal.
Finally, it is noteworthy that cocoa consumption results in a reduction in the arginase enzymatic activity in the CIIO group. This reduction is important because elevated arginase activity decreases the NO production by NOS and uncouples NOS, inducing the production of ROS such as superoxide and peroxynitrite [4849]. Furthermore, these ROS activate arginase and other ROS generators, resulting in a feed-forward effect and an exacerbation of the oxidative damage [5051]. For this reason, we suggest that a decrease in the arginase activity could be a consequence of the increased antioxidant capacity induced by cocoa consumption. In fact, we consider that the increase in the antioxidant capacity generates a rupture in the feed-forward effect between ROS production and arginase activation, thereby contributing to reduced oxidative damage.
The present study demonstrates that the consumption of flavonoids-rich cocoa for a short duration (7 days) has beneficial effects on LDL and neutral effects on TG and HDL. Cocoa consumption is also effective in decreasing the IR, oxidative damage, and arginase activity. We therefore conclude that short-term cocoa consumption potentially improves IR and restores a healthy redox status.
This study has some limitations: First, the participant number is small (n = 15); clinical trials are needed to confirm the protective effect of cocoa using larger cohorts. Second, the study recruited young male adults with and without obesity; we acknowledge the necessity to include a female population to establish the cocoa effect in this gender. Third, the absence of a placebo group for comparison and the lack of blinding of subjects and investigators may have led to a certain bias. However, the study is strengthened as the participants were their own control, minimizing the influence of confounding factors. Finally, factors such as age, lifestyle, and the health of subjects can influence results of the study; these factors need to be considered in the interpretation. As there is no previous publication on the beneficial effect of cocoa consumption resulting in decreased IR and the protective effect generated for insulin, we regard these as the strengths of this study.
Go to :
 XML Download