Journal List > J Korean Med Sci > v.38(14) > 1516082167

Kim, Hwang, Heo, Kim, Jung, Kim, Kim, Lee, Park, Song, Lee, Chung, Song, and Yoon: Evaluation of Vancomycin TDM Strategies: Prediction and Prevention of Kidney Injuries Based on Vancomycin TDM Results

Abstract

The current guidelines for therapeutic drug monitoring (TDM) of vancomycin suggest a target 24-hour area under the curve (AUC0-24) of 400 to 600 mg*h/L for serious methicillin-resistant Staphylococcus aureus infections. In this study, the predictabilities of acute kidney injury (AKI) of various TDM target parameters, target levels, and sampling methods were evaluated in patients who underwent TDM from January 2020 to December 2020. The AUC0-24 and trough values were calculated by both one- and two-point sampling methods, and were evaluated for the predictability of AKI. Among the AUC0-24 cutoff comparisons, the threshold value of 500 mg*h/L in the two sampling methods was statistically significant (P = 0.042) when evaluated for the predictability of AKI. Analysis by an receiver operating characteristic curve estimated an AUC0-24 cutoff value of 563.45 mg*h/L as a predictor of AKI, and was proposed as the upper limit of TDM target.

Graphical Abstract

jkms-38-e101-abf001.jpg

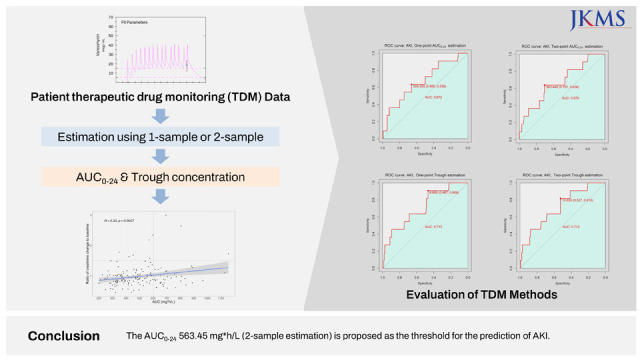
Vancomycin is a glycopeptide antibiotic widely used for the treatment of skin and soft tissue infection, endocarditis, pneumonia, bone and joint infection, and central nervous system infections caused by methicillin-resistant Staphylococcus aureus (MRSA).123 One of the major concerns when using vancomycin is the occurrence of acute kidney injury (AKI).4 The incidence of AKI associated with the use of vancomycin ranges from 12% to 43%, and patients with higher exposure to vancomycin are more likely to experience AKI. The incidence of AKI and the narrow therapeutic index of the drug necessitated therapeutic drug monitoring (TDM).15 The pharmacodynamic parameter currently thought to be the best predictor of effective vancomycin therapeutic activity is the area under the curve over 24 hours to the minimum inhibitory concentration (AUC0-24/MIC).6
The 2020 revised consensus guideline for the use and TDM of vancomycin suggests a target AUC0-24/MIC of 400 to 600 (assuming an MIC of 1 mg/L) for serious MRSA infections.78 The guideline also suggests the collection of two concentrations (trough [Cmin] and peak [Cmax] concentrations) at near steady-state for optimal TDM. The therapeutic effectiveness and safety of the new AUC0-24-based TDM has not yet been explored in detail, and its effect on the incidence of AKI in the clinical setting has yet to be investigated. In this study, we evaluated the predictability of AKI by vancomycin AUC0-24, trough levels and TDM estimation methods and analyzed the cutoff values of AUC0-24 for the prediction of AKI.
This study was a 1-year, retrospective, single-center study to evaluate the pharmacokinetics and incidence of AKI among patients who underwent TDM from January 2020 to December 2020 at the Seoul National University Bundang Hospital. To be included in the study, patients were required to have at least two quantifiable vancomycin concentrations and baseline (measured between −28 and −7 days from the TDM consultation date) estimated glomerular filtration rates (eGFRs) exceeding 60 mL/min/1.73 m2. TDM data were considered as AKI group if the post-TDM creatinine value was either more than 1.5 times that of the baseline value and/or if more than 0.3 mg/dL increase in absolute value was observed.910
The AUC0-24 and trough values were calculated by both one- and two-point sampling methods. AUC0-24 cutoff values of 500, 600, and 700 mg*h/L and trough cutoff values of 15 and 20 µg/mL were evaluated for the predictability of AKI. Receiver operating characteristic (ROC) analysis was performed to evaluate the threshold value of AUC0-24 and trough concentration for the best prediction of the incidence of AKI. Multivariable logistic regression analysis was performed to evaluate the calculated threshold values. Apart from the vancomycin exposure parameters, risk factors that were significant at P = 0.2 in univariate analysis were evaluated in the model. Backward elimination was performed until only variables with P ≤ 0.05 remained. Adjusted odds ratio values were calculated to present the relationship between variables and AKI. All statistical analyses were performed using SAS software version 9.4 (SAS institute, Cary, NC, USA) and Statistical Package R version 4.1.0 (R Foundation for Statistical Computing, Vienna, Austria).
A total of 407 patient’s TDM data which met the inclusion criteria were identified between January 2020 and December 2020. Among them, 161 TDM cases were included in the analysis (Supplementary Fig. 1). Following patients were excluded from the analysis: no creatinine data were available on baseline and/or at the TDM report time (n = 156); AUC and/or trough cannot be calculated by standard method (n = 23); or less than three consecutive doses of vancomycin were administered and/or less than two quantifiable concentrations were available (n = 67). The average vancomycin administration time before TDM consultation were: 8.54 ± 3.52 days and 7.18 ± 0.40 days for no AKI group and AKI group, respectively. Among the cases included in the analysis, AKI was observed in 11 (6.8%) patients (Table 1).
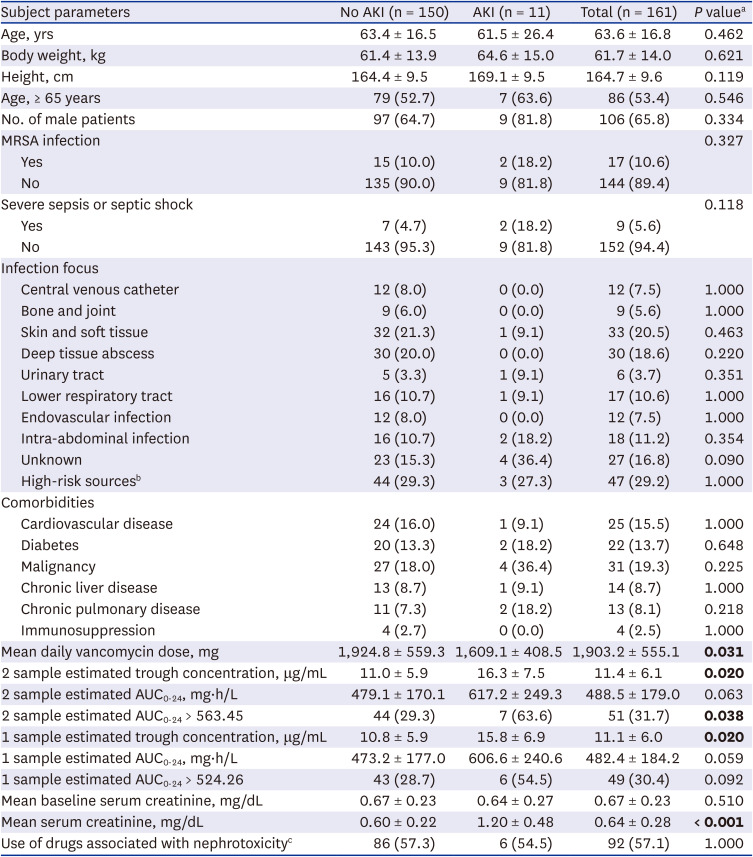
Among the analyzed TDM data, a positive correlation between vancomycin AUC0-24 and the ratio of creatinine change was observed (Supplementary Fig. 2). The estimated AUC0-24 values from both estimation methods were comparable (Supplementary Fig. 3), and trough levels in both the one- and two-point estimation methods were well correlated with the increase in 24-hour AUC (Supplementary Fig. 4). When AUC0-24 cutoff values were evaluated for the correlation between the ratio of creatinine change, only the value of 500 mg*h/L in the two sampling methods was significantly associated with an increase in the creatinine ratio (P = 0.042, Mann–Whitney U test) (Fig. 1). Comparison of trough cutoff values showed comparable predictability of the ratio of creatinine change across all comparisons (Supplementary Fig. 5).
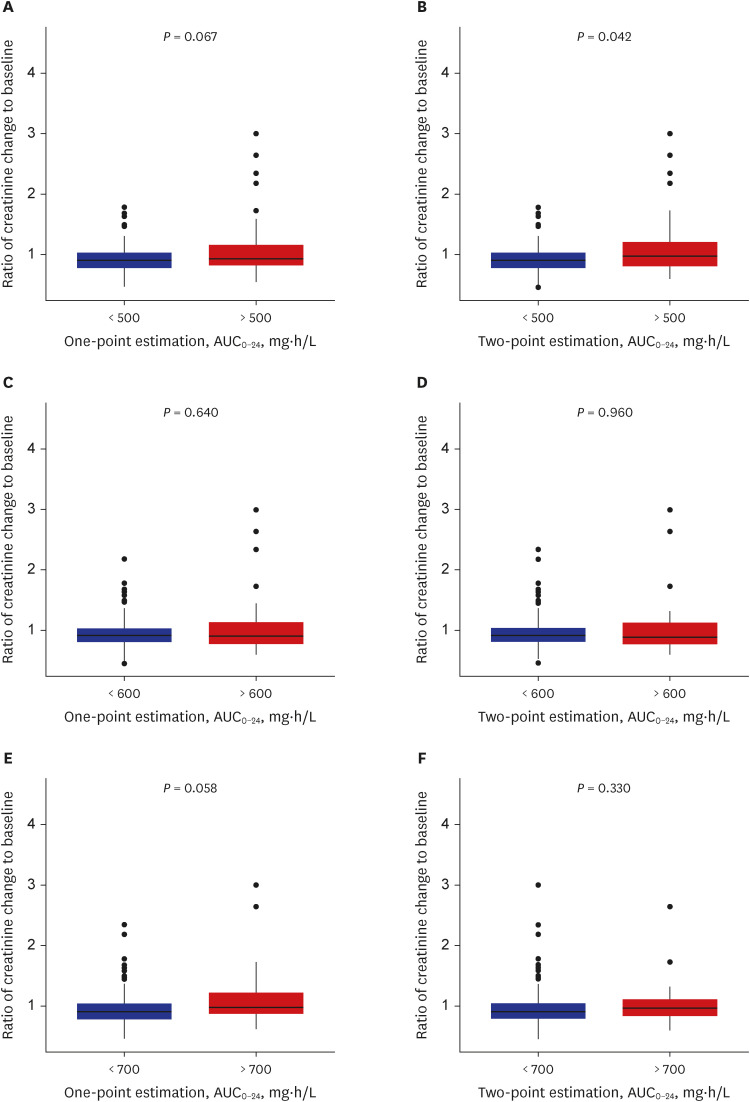
When the threshold values of AUC0-24 and trough concentration was evaluated by ROC curve for the prediction of AKI, AUC0-24 threshold values in both one- and two-sample-based estimations showed similar results (524.26 vs. 563.45 mg*h/L; one- and two-sample-based estimations, respectively), and threshold values for the trough concentration showed mixed results (8.95 and 10.66 µg/mL; one- and two-sample-based estimation, respectively) (Fig. 2). Among the AUC0-24, trough threshold values and other risk factors evaluated by multivariate analysis, AUC0-24 ≥ 563.45 mg*h/L in two-sample-based estimation (odds ratio [OR], 4.33; 95% confidence interval [CI], 1.18–15.87) and trough ≥ 8.95 µg/mL in one-sample-based estimation (OR, 8.47; 95% CI, 1.05–66.67) were significant predictors of AKI (P = 0.027 and P =0.045, respectively) (Supplementary Table 1).
Nephrotoxicity is a widely known adverse side effect associated with the use of vancomycin.111213 To date, collective data suggest a positive correlation between vancomycin trough level (15 and 20 µg/mL) and the risk of AKI, while the accurate association between AUC and the incidence of AKI remains an area of controversy.1415161718 With the release of 2020 revised consensus guidelines suggesting a vancomycin AUC0-24/MIC target of 400 to 600 mg*h/L, the appropriateness of the target AUC0-24/MIC to predict and prevent AKI has become an area of special interest. While there were investigations to set the parameter threshold value for the prediction of AKI, most previous studies relied on a one-point sampling method to calculate the PK parameters, and comprehensive evaluation of different sampling methods and target parameters to predict the incidence of AKI has been absent.151719
In the current study, we aimed to evaluate the newly suggested daily AUC0-24/MIC target of 400-600 mg*h/L in context of the incidence of AKI. When the ROC curve was used to estimate the threshold values of AUC0-24, the one-point method resulted in 524.26 mg*h/L, and the two-point method resulted in 563.45 mg*h/L. This cutoff is comparable to or lower than the previously suggested values between 563 and 1,300 mg*h/L.15171820 Possible explanations for the variability observed between studies include the differences in the TDM methods used for AUC0-24 calculation and patient-clinician disposition. One example of patient-clinician disposition is that if pharmacovigilance is more strictly applied in a study, patients with increasing serum creatinine levels are likely to experience termination of vancomycin dosing, resulting in overprediction of the AUC0-24 cutoff value. In this study, only the first ever conducted vancomycin TDM data are included in the analysis to minimize selection-based bias.
When the ROC curve was used to estimate the threshold value of trough levels, the one-point method resulted in 8.95 µg/mL, and the two-point method resulted in 10.66 µg/mL. This cutoff is lower than the previously suggested therapeutic range of 15 to 20 µg/mL. Possible explanation for the observed discrepancies is that, some of the patients presented with AKI in this study showed comparatively low vancomycin trough concentration (up to 4 patients ranged 5–10 µg/mL, depending on TDM method), and may have contributed to under prediction of threshold value.
In the multivariate analysis, other possible risk factors that may have an effect on the incidence of AKI were investigated along with calculated vancomycin exposure threshold values. No association between risk factors and AKI was observed except AUC0-24 (563.45 mg*h/L) and trough (8.95 µg/mL) threshold values from two- and one-point-based prediction, respectively. This indicates that the calculated threshold values are independent predictors of AKI and may be used as the upper limit of the therapeutic target range.
Our data agreed well with the 2020 revised guidelines for the TDM of vancomycin. The calculated AUC0-24 value of 563.45 mg*h/L (two-point sampling method) compared well with the suggested upper limit of 600 mg*h/L. However, the trough threshold value calculated with a one-point sample was also associated with AKI (albeit inconsistent among sampling methods), and further investigation may be needed to investigate the optimal predictive methods. This result suggests that when a two-sample-based AUC0-24 calculation is not possible, using the trough cutoff value from the single-sampling method may be an alternative method for the TDM of vancomycin and the prediction of AKI. Establishment of a possible upper range of TDM targets allows optimal individualized dosing and dose monitoring of vancomycin to achieve a therapeutic range of drug exposure while minimizing the incidence of adverse events such as AKI.

Ethics statement

This study was approved by the Seoul National University Bundang Hospital Institutional Review Boards (SNUBH, IRBs), and informed consent for individual patients was not acquired [B-2101-663-107, January 2021].

ACKNOWLEDGMENTS

The authors express their gratitude to Sungyeun Bae, Woo Kyung Chung, Yewon Park for their active participation in data collection. The authors also thank the Department of Laboratory Medicine at Seoul National University Bundang Hospital (Seongnam, South Korea) for their help with laboratory analysis.

Notes

Disclosure: The authors have no potential conflicts of interest to disclose.

Author Contributions:

  • Conceptualization: Kim B, Yoon S.

  • Data curation: Hwang S.

  • Formal analysis: Kim B, Heo E, Kim HS, Jung J, Kim ES, Kim HB, Lee K, Park JS, Song J, Lee JH, Chung JY, Song KH, Yoon S.

  • Methodology: Kim B.

  • Supervision: Yoon S.

  • Visualization: Hwang S.

  • Writing - original draft: Kim B.

  • Writing - review & editing: Heo E, Kim HS, Jung J, Kim ES, Kim HB, Lee K, Park JS, Song J, Lee JH, Chung JY, Song KH, Yoon S.

References

1. Liu C, Bayer A, Cosgrove SE, Daum RS, Fridkin SK, Gorwitz RJ, et al. Clinical practice guidelines by the Infectious Diseases Society of America for the treatment of methicillin-resistant Staphylococcus aureus infections in adults and children: executive summary. Clin Infect Dis. 2011; 52(3):285–292. PMID: 21217178.
crossref
2. Choi SH, Lee J, Jung J, Kim ES, Kim MJ, Chong YP, et al. A longitudinal study of adult patients with Staphylococcus aureus bacteremia over 11 years in Korea. J Korean Med Sci. 2021; 36(16):e104. PMID: 33904260.
crossref
3. Kim YS, Kiem S, Yun HJ, Jung SI, Oh WS, Kim SW, et al. Efficacy of vancomycin-beta-lactam combinations against heterogeneously vancomycin-resistant Staphylococcus aureus (hetero-VRSA). J Korean Med Sci. 2003; 18(3):319–324. PMID: 12808315.
crossref
4. Sinha Ray A, Haikal A, Hammoud KA, Yu AS. Vancomycin and the risk of AKI: a systematic review and meta-analysis. Clin J Am Soc Nephrol. 2016; 11(12):2132–2140. PMID: 27895134.
5. Yoo RN, Kim SH, Lee J. Impact of initial vancomycin trough concentration on clinical and microbiological outcomes of methicillin-resistant Staphylococcus aureus bacteremia in children. J Korean Med Sci. 2017; 32(1):22–28. PMID: 27914127.
6. Stoessel AM, Hale CM, Seabury RW, Miller CD, Steele JM. The impact of AUC-based monitoring on pharmacist-directed vancomycin dose adjustments in complicated methicillin-resistant Staphylococcus aureus infection. J Pharm Pract. 2019; 32(4):442–446. PMID: 29554847.
7. Wong-Beringer A, Joo J, Tse E, Beringer P. Vancomycin-associated nephrotoxicity: a critical appraisal of risk with high-dose therapy. Int J Antimicrob Agents. 2011; 37(2):95–101. PMID: 21130609.
crossref
8. Rybak MJ, Le J, Lodise TP, Levine DP, Bradley JS, Liu C, et al. Therapeutic monitoring of vancomycin for serious methicillin-resistant Staphylococcus aureus infections: a revised consensus guideline and review by the American Society of Health-System Pharmacists, the Infectious Diseases Society of America, the Pediatric Infectious Diseases Society, and the Society of Infectious Diseases Pharmacists. Am J Health Syst Pharm. 2020; 77(11):835–864. PMID: 32191793.
crossref
9. Gameiro J, Agapito Fonseca J, Jorge S, Lopes JA. Acute kidney injury definition and diagnosis: a narrative review. J Clin Med. 2018; 7(10):307. PMID: 30274164.
crossref
10. Na KR, Kim HR, Ham Y, Choi DE, Lee KW, Moon JY, et al. Acute kidney injury and kidney damage in COVID-19 patients. J Korean Med Sci. 2020; 35(28):e257. PMID: 32686373.
crossref
11. Filippone EJ, Kraft WK, Farber JL. The nephrotoxicity of vancomycin. Clin Pharmacol Ther. 2017; 102(3):459–469. PMID: 28474732.
crossref
12. Kato H, Hagihara M, Okudaira M, Asai N, Koizumi Y, Yamagishi Y, et al. Systematic review and meta-analysis to explore optimal therapeutic range of vancomycin trough level for infected paediatric patients with gram-positive pathogens to reduce mortality and nephrotoxicity risk. Int J Antimicrob Agents. 2021; 58(2):106393. PMID: 34174409.
crossref
13. Suzuki A, Hamada Y, Ikeda H, Tanaka H, Yanagihara M, Namiki M, et al. Comparison of trough concentration and area under the curve of vancomycin associated with the incidence of nephrotoxicity and predictors of a high trough level. J Infect Chemother. 2021; 27(3):455–460. PMID: 33144145.
crossref
14. van Hal SJ, Paterson DL, Lodise TP. Systematic review and meta-analysis of vancomycin-induced nephrotoxicity associated with dosing schedules that maintain troughs between 15 and 20 milligrams per liter. Antimicrob Agents Chemother. 2013; 57(2):734–744. PMID: 23165462.
crossref
15. Chavada R, Ghosh N, Sandaradura I, Maley M, Van Hal SJ. Establishment of an AUC0-24 threshold for nephrotoxicity is a step towards individualized vancomycin dosing for methicillin-resistant Staphylococcus aureus bacteremia. Antimicrob Agents Chemother. 2017; 61(5):e02535-16. PMID: 28242672.
crossref
16. Bellos I, Daskalakis G, Pergialiotis V. Relationship of vancomycin trough levels with acute kidney injury risk: an exposure-toxicity meta-analysis. J Antimicrob Chemother. 2020; 75(10):2725–2734. PMID: 32417905.
crossref
17. Neely MN, Youn G, Jones B, Jelliffe RW, Drusano GL, Rodvold KA, et al. Are vancomycin trough concentrations adequate for optimal dosing? Antimicrob Agents Chemother. 2014; 58(1):309–316. PMID: 24165176.
18. Ingram PR, Lye DC, Tambyah PA, Goh WP, Tam VH, Fisher DA. Risk factors for nephrotoxicity associated with continuous vancomycin infusion in outpatient parenteral antibiotic therapy. J Antimicrob Chemother. 2008; 62(1):168–171. PMID: 18334494.
crossref
19. Chattaweelarp T, Changpradub D, Punyawudho B, Thunyaharn S, Santimaleeworagun W. Is early monitoring better? Impact of early vancomycin exposure on treatment outcomes and nephrotoxicity in patients with methicillin-resistant Staphylococcus aureus infections. Antibiotics (Basel). 2020; 9(10):672. PMID: 33020463.
crossref
20. Lodise TP, Patel N, Lomaestro BM, Rodvold KA, Drusano GL. Relationship between initial vancomycin concentration-time profile and nephrotoxicity among hospitalized patients. Clin Infect Dis. 2009; 49(4):507–514. PMID: 19586413.

SUPPLEMENTARY MATERIALS

Supplementary Table 1

Predictors of AKI on multivariate analysis
jkms-38-e101-s001.doc

Supplementary Fig. 1

Disposition of subject data.
jkms-38-e101-s002.doc

Supplementary Fig. 2

Scatterplot of vancomycin daily AUC0-24 calculated by two-point estimation and Creatinine ratio. Y axis represents ratio of creatinine measured at time near the TDM consultation date to base creatinine. Vertical and horizontal lines represent proposed AUC0-24 target value and cut-off value for prediction of nephrotoxicity, respectively. The R and P values represent Pearson correlation and significance, respectively.
jkms-38-e101-s003.doc

Supplementary Fig. 3

Scatterplot and regression line for vancomycin daily AUC0-24 calculated by one-point and two-point estimation. Grey area represents 95% confidence interval.
jkms-38-e101-s004.doc

Supplementary Fig. 4

Scatterplot and regression line for vancomycin trough level and AUC0-24 calculated by (A) one and (B) two-point estimation. Grey area represents 95% confidence interval.
jkms-38-e101-s005.doc

Supplementary Fig. 5

Vancomycin trough concentration and the ratio of creatinine change to baseline calculated by one- and two-point estimation. Each plot was stratified by vancomycin trough levels of (A, B) 15 and (C, D) 20 μg/mL. The P values represent Mann–Whitney U test results.
jkms-38-e101-s006.doc
Fig. 1

Vancomycin daily AUC0-24 and the ratio of creatinine change to baseline calculated by one- and two-point estimation. Each plot was stratified by AUC0-24 levels of (A, B) 500, (C, D) 600, and (E, F) 700 mg∙h/L. The P values represent Mann–Whitney U test results.

AUC0-24 = area under the curve over 24 hours.
jkms-38-e101-g001
Fig. 2

ROC curve for estimation of (A, B) AUC0-24 and (C, D) trough cutoff values for AKI prediction. The AUC shown in the figure represents the area under the ROC curve.

ROC = receiver operating characteristic, AUC0-24 = area under the curve over 24 hours, AKI = acute kidney injury.
jkms-38-e101-g002
Table 1

Demographic data and base characteristics

jkms-38-e101-i001
Subject parameters No AKI (n = 150) AKI (n = 11) Total (n = 161) P valuea
Age, yrs 63.4 ± 16.5 61.5 ± 26.4 63.6 ± 16.8 0.462
Body weight, kg 61.4 ± 13.9 64.6 ± 15.0 61.7 ± 14.0 0.621
Height, cm 164.4 ± 9.5 169.1 ± 9.5 164.7 ± 9.6 0.119
Age, ≥ 65 years 79 (52.7) 7 (63.6) 86 (53.4) 0.546
No. of male patients 97 (64.7) 9 (81.8) 106 (65.8) 0.334
MRSA infection 0.327
Yes 15 (10.0) 2 (18.2) 17 (10.6)
No 135 (90.0) 9 (81.8) 144 (89.4)
Severe sepsis or septic shock 0.118
Yes 7 (4.7) 2 (18.2) 9 (5.6)
No 143 (95.3) 9 (81.8) 152 (94.4)
Infection focus
Central venous catheter 12 (8.0) 0 (0.0) 12 (7.5) 1.000
Bone and joint 9 (6.0) 0 (0.0) 9 (5.6) 1.000
Skin and soft tissue 32 (21.3) 1 (9.1) 33 (20.5) 0.463
Deep tissue abscess 30 (20.0) 0 (0.0) 30 (18.6) 0.220
Urinary tract 5 (3.3) 1 (9.1) 6 (3.7) 0.351
Lower respiratory tract 16 (10.7) 1 (9.1) 17 (10.6) 1.000
Endovascular infection 12 (8.0) 0 (0.0) 12 (7.5) 1.000
Intra-abdominal infection 16 (10.7) 2 (18.2) 18 (11.2) 0.354
Unknown 23 (15.3) 4 (36.4) 27 (16.8) 0.090
High-risk sourcesb 44 (29.3) 3 (27.3) 47 (29.2) 1.000
Comorbidities
Cardiovascular disease 24 (16.0) 1 (9.1) 25 (15.5) 1.000
Diabetes 20 (13.3) 2 (18.2) 22 (13.7) 0.648
Malignancy 27 (18.0) 4 (36.4) 31 (19.3) 0.225
Chronic liver disease 13 (8.7) 1 (9.1) 14 (8.7) 1.000
Chronic pulmonary disease 11 (7.3) 2 (18.2) 13 (8.1) 0.218
Immunosuppression 4 (2.7) 0 (0.0) 4 (2.5) 1.000
Mean daily vancomycin dose, mg 1,924.8 ± 559.3 1,609.1 ± 408.5 1,903.2 ± 555.1 0.031
2 sample estimated trough concentration, μg/mL 11.0 ± 5.9 16.3 ± 7.5 11.4 ± 6.1 0.020
2 sample estimated AUC0-24, mg∙h/L 479.1 ± 170.1 617.2 ± 249.3 488.5 ± 179.0 0.063
2 sample estimated AUC0-24 > 563.45 44 (29.3) 7 (63.6) 51 (31.7) 0.038
1 sample estimated trough concentration, μg/mL 10.8 ± 5.9 15.8 ± 6.9 11.1 ± 6.0 0.020
1 sample estimated AUC0-24, mg∙h/L 473.2 ± 177.0 606.6 ± 240.6 482.4 ± 184.2 0.059
1 sample estimated AUC0-24 > 524.26 43 (28.7) 6 (54.5) 49 (30.4) 0.092
Mean baseline serum creatinine, mg/dL 0.67 ± 0.23 0.64 ± 0.27 0.67 ± 0.23 0.510
Mean serum creatinine, mg/dL 0.60 ± 0.22 1.20 ± 0.48 0.64 ± 0.28 < 0.001
Use of drugs associated with nephrotoxicityc 86 (57.3) 6 (54.5) 92 (57.1) 1.000
Data are presented as mean ± standard deviation or number (%).
AKI = acute kidney injury, MRSA = methicillin-resistant Staphylococcus aureus, AUC0-24 = area under the curve over 24 hours.
aCategorical parameters: Fisher's exact test; continuous parameters: Mann-Whitney U test.
bHigh-risk sources include endovascular infection, lower respiratory tract infection and intra-abdominal infection.
cFollowing agents were classified as drugs associated with nephrotoxicity: nonsteroidal anti-inflammatory drugs, acyclovir, aminoglycosides, amphotericin B, beta lactams, pentamine, quinolones, rifampin, sulfonamides, adefovir, cidofovir, tenofovir, indinavir, cyclosporine, tacrolimus, angiotensin-converting enzyme inhibitors, angiotensin receptor blockers, cisplatin, diuretics, contrast dye, proton pump inhibitors, and vasopressor medicines.
TOOLS
Similar articles