Abstract
Background
Genome-wide association studies (GWAS) on type 2 diabetes mellitus (T2DM) have identified more than 400 distinct genetic loci associated with diabetes and nearly 120 loci for fasting plasma glucose (FPG) and fasting insulin level to date. However, genetic risk factors for the longitudinal deterioration of FPG have not been thoroughly evaluated. We aimed to identify genetic variants associated with longitudinal change of FPG over time.
Methods
We used two prospective cohorts in Korean population, which included a total of 10,528 individuals without T2DM. GWAS of repeated measure of FPG using linear mixed model was performed to investigate the interaction of genetic variants and time, and meta-analysis was conducted. Genome-wide complex trait analysis was used for heritability calculation. In addition, expression quantitative trait loci (eQTL) analysis was performed using the Genotype-Tissue Expression project.
Results
A small portion (4%) of the genome-wide single nucleotide polymorphism (SNP) interaction with time explained the total phenotypic variance of longitudinal change in FPG. A total of four known genetic variants of FPG were associated with repeated measure of FPG levels. One SNP (rs11187850) showed a genome-wide significant association for genetic interaction with time. The variant is an eQTL for NOC3 like DNA replication regulator (NOC3L) gene in pancreas and adipose tissue. Furthermore, NOC3L is also differentially expressed in pancreatic β-cells between subjects with or without T2DM. However, this variant was not associated with increased risk of T2DM nor elevated FPG level.
Type 2 diabetes mellitus (T2DM) is diagnosed based on discrete values of fasting plasma glucose (FPG) and glycosylated hemoglobin (HbA1c). Metabolic dysregulation presents as a continuum of abnormal glucose level that is above normal glucose level and include prediabetes and diabetes. There has been a number of studies that investigated the natural course in the development of T2DM [1]. Based on a prospective cohort specifically designed to study the trajectories of diabetes, those who progressed to diabetes had elevated FPG level 10 years before the development of diabetes compared to those who remained normal glucose tolerance [2]. There seems to be a rapid increase in FPG 2 to 6 years before diagnosis of diabetes [2,3]. In addition, FPG level increased as age increases, at a rate of 12.6 to 19.8 mg/dL per age decade [4]. However, there might be individual variation in the rate of longitudinal glucose change. This is also suggested by the fact that only about 25% of prediabetes subjects progress to T2DM in 5 years of follow-up [5]. The genetic contribution on this longitudinal change in FPG level has not been thoroughly investigated.
Genome-wide association studies (GWAS) on T2DM have identified more than 400 distinct genetic loci associated with T2DM [6,7] and nearly 120 loci for FPG and fasting insulin level [8]. However, it should be noted that genetic loci for FPG and T2DM does not show complete overlap [6]. This discrepancy could be due to multiple factors including different range of glycemia studied for FPG and T2DM, interaction by environmental factors, and most of the studies being cross sectional in nature. Although there have been several studies that investigated the genetic association for longitudinal change in FPG [7], there has not been a locus that reached genome-wide significance.
Therefore, the main interest lies in dependence of longitudinal change in FPG on genetic variants, and their interaction with time. To this end, there are two popular methods to deal with repeated measurements: linear mixed model (LMM) and generalized estimating equations (GEE). LMM allows for correlation within subject to vary by a specific pattern which produces models that better fit the data. Additionally, subjects with missing outcome and different numbers of visits can be included as long as the time intervals are correctly specified in the model. Because LMM uses maximum likelihood estimation, it is robust against data which is missing at random [9]. GEE has the same advantages as LMM as it allows correlation structures through working correlation matrix and it can take several types of covariates. However, the main difference is that GEE only provides population average estimates and not individual level information for random effects. Since it requires complete data or missing completely at random, it is less robust than LMM in missing data scenarios [9,10].
In this study, we hypothesized that using LMM will allow us to investigate the impact of genetic variants on FPG and its longitudinal change in an East Asian population. For this end, we used two large-scale cohorts, Korea Genome and Epidemiology Study (KoGES) and Gene-Environment Interaction and phenotype (GENIE) cohort, to perform GWAS using LMM and meta-analyzed the results.
The KoGES [11] was initiated in 2002, and 6,122 individuals who did not have T2DM at baseline examination were investigated [2]. The participants consisted of 2,847 males and 3,275 females, with age at baseline range of 40 to 69 years. FPG and post-challenge 2-hour plasma glucose were measured every 2 years from 2001 to 2012. The diagnosis of T2DM was defined according to the American Diabetes Association (ADA) criteria: FPG ≥126mg/dL; post-challenge 2-hour plasma glucose ≥200mg/dL after a 75-g oral glucose load; and HbA1c ≥6.5%. The subjects were followed up for 11 years on average, and the minimum and maximum follow-up time were 6 and 12 years, respectively. During the follow-up period, 790 participants developed incident T2DM, and their FPG levels after the first diagnosis of T2DM were not included in the analyses.
The GENIE cohort consisted of 7,999 participants who had visited Seoul National University Hospital Healthcare System Gangnam Center between 2003 and 2015 for health check-up. A total of 4,406 participants (2,604 males and 1,802 females) who did not have T2DM at their baseline visit were considered for inclusion in the present analyses. The number of visits to the Gangnam Center varied among the participants, and those who visited the center more than three times, but less than 13 times were ultimately including in our analysis. The participants were followed up for 6 years on average. The number of visits to the Gangnam Center varied among the participants, and those who visited the center more than three times, but less than 13 times were ultimately including in our analysis. The participants were followed up for 6 years on average. Most of them had annual or biennial visit for health check-up. Although follow-up intervals were not matched to those of KoGES, we used the same year-unit for follow-up duration in both cohorts. T2DM was diagnosed according to the ADA definition as described above. During the follow-up period, 237 participants developed incident T2DM and their FPG values after the first incidence of T2DM were excluded.
Genome-wide genotyping on the KoGES and GENIE cohorts was performed using the Affymetrix genome-wide human single nucleotide polymorphism (SNP) Array 5.0 and Affymetrix KOR_v1.0, respectively [12]. Variant calling was conducted with K-medoid algorithm approach [13]. We excluded any SNP marker with more than 5% missingness, minor allele frequency <0.05, deviation from Hardy-Weinberg equilibrium P<1.00×10⁻⁶, and any subjects with more than 5% missing genotype calls and sex inconsistency. Genotype data was managed with PLINK (whole genome data analysis toolset) and ONETOOL (a tool for family-based big data analysis) [14]. Imputation was conducted with IMPUTE2 (a computer program for phasing observed genotypes and imputing missing genotypes) using the cosmopolitan reference panel from 1000 Genomes Project phase 3. We used weighted genetic score using imputed genotype probabilities by IMPUTE2. Any imputed SNPs with imputation quality scores <0.4 were excluded. After quality control, 3,758,649 and 3,692,736 SNPs were used for association analyses of longitudinal change in FPG in the KoGES cohorts and GENIE cohorts, respectively. Supplementary Table 1 shows the number of variants in each annotation group categorized by ANNOtate VARiation (ANNOVAR) [15]. Intergenic SNPs and intronic SNPs accounted for 55% and 36% of the total, respectively, with 6% contributed by exonic non-coding RNA. Genotype dosage scores obtained from IMPUTE2 were used for association testing [16].
Association analyses were performed with LMM using the lme4 package in R v.3.4.1 [17] with two random effects, intercept and slope over time, for each subject and correlations between two random effects were allowed. We considered several models and the best model was selected by Akaike’s information criterion. We tested a number of different models based on the following criterions: (1) whether to allow correlations between two random effects, intercept and slope over time, for each subject; (2) whether to consider the inverse variance of each time point dataset as weights; (3) whether to adjust body mass index (BMI) as covariate. The selected model has two random effects for intercept and slope over time for each subject, with nonzero correlations between them. SNP, sex, baseline age, BMI, elapsed time on FPG, the ten principal component scores, and the SNP-by-time interaction were included as covariates. For the j-th measurement of the i-th subject, our LMM for both the KoGES and GENIE cohorts can be expressed by
Once the LMMs were applied to both the KoGES and GENIE cohorts, their P values were combined with inverse variance-weighted meta-analyses using METAL software (http://csg.sph.umich.edu/abecasis/metal) [18]. The threshold for statistical significance in this model was P<5.00×10⁻⁸, which is conventionally considered to reflect genome-wide significance. Selection of an appropriate suggestive significance threshold was P<1.00×10⁻⁵. To verify no inflation in the statistical significance, genomic inflation factor (GIF) was calculated and the GIF close to 1 means no genomic inflation in the GWAS [19]. The SNP based heritability value reflects the relative proportion of phenotypic variance explained by all observed common SNPs. SNP based heritabilities of the average and annual increment of FPG were estimated with genome-wide complex trait analysis (GCTA) v1.91.7 [20]. To estimate SNP heritability of FPG, we first fit the linear model (LM) for repeatedly observed FPG of each subject as follows:
where indicates the average of the ith subject’s age at different time points, and βi0 and βi1 indicate the expected FPG when Ageij= and the average annual increment, respectively. and were estimated for all subjects in both cohorts and were analyzed with GCTA. and were used as the outcome variable, and and sex were used as covariates.
We explored the expression quantitative trait loci (eQTL) for our GWAS result in the tissues associated with FPG or T2DM using publicly available Genotype-Tissue Expression (GTEx) datasets [21]. Pancreas and adipose tissues, which are known to have a significant influence on FPG or T2DM, were mainly targeted. The candidate gene’s expression was compared for T2DM based on Gene Expression Omnibus (GEO) database of GSE25724 [22]. The platform for GSE25724 is GPL96, [HG-U133A] Affymetrix Human Genome U133A Array, which includes seven normal pancreatic islets subjects and six T2DM pancreatic islets subjects. Gene differential analysis was performed using the ‘limma’ R package (R Foundation for Statistical Computing, Vienna, Austria). Furthermore, Combined Annotation Dependent Depletion (CADD) score was calculated to predict the scoring the deleteriousness of single nucleotide variants as well as insertion/deletions variants in the human genome. CADD score of 10 or greater means top 10% probable functional variants [23].
To investigate whether the already well-known variants of T2DM and FPG are also related to longitudinal change of FPG, we utilized publicly available data via the The DIAbetes Genetics Replication And Meta-analysis (DIAGRAM) consortium (http://diagram-consortium.org/), and GWAS summary results [6,8]. We identified variants associated with T2DM and FPG in genome-wide significance using conditional analyses as implemented in GCTA using GWAS results from 898,130 European-descent individuals [6] and trans-ethnic meta-analyses [6,8]. In total, 231 T2DM-related variants and 38 FPG-related variants were targeted and we considered Bonferroni-controlled P=2.20×10⁻⁴ and P=1.30×10⁻³ as significance threshold, respectively. In total, 231 T2DM-related variants and 38 FPG-related variants were targeted and we considered Bonferroni-controlling multiple-testing procedures [24].
Statistical power to detect effect size 0.1 to 0.5 with sample size of 10,528 at the genome-wide significant level (P=5.00×10⁻⁸) is calculated using QUANTO software version 1.2.4 (https://quanto.software.informer.com) [25].
All datasets involving human subject or genotype data must be approved by the Institutional Review Board (IRB) of the Seoul National University Hospital (H-1704-073-845). The authors assert that all procedures contributing to this work comply with the ethical standards of the relevant national and institutional committees on human experimentation and with the Helsinki Declaration of 1975, as revised in 2008. Written informed consent was obtained from all patients.
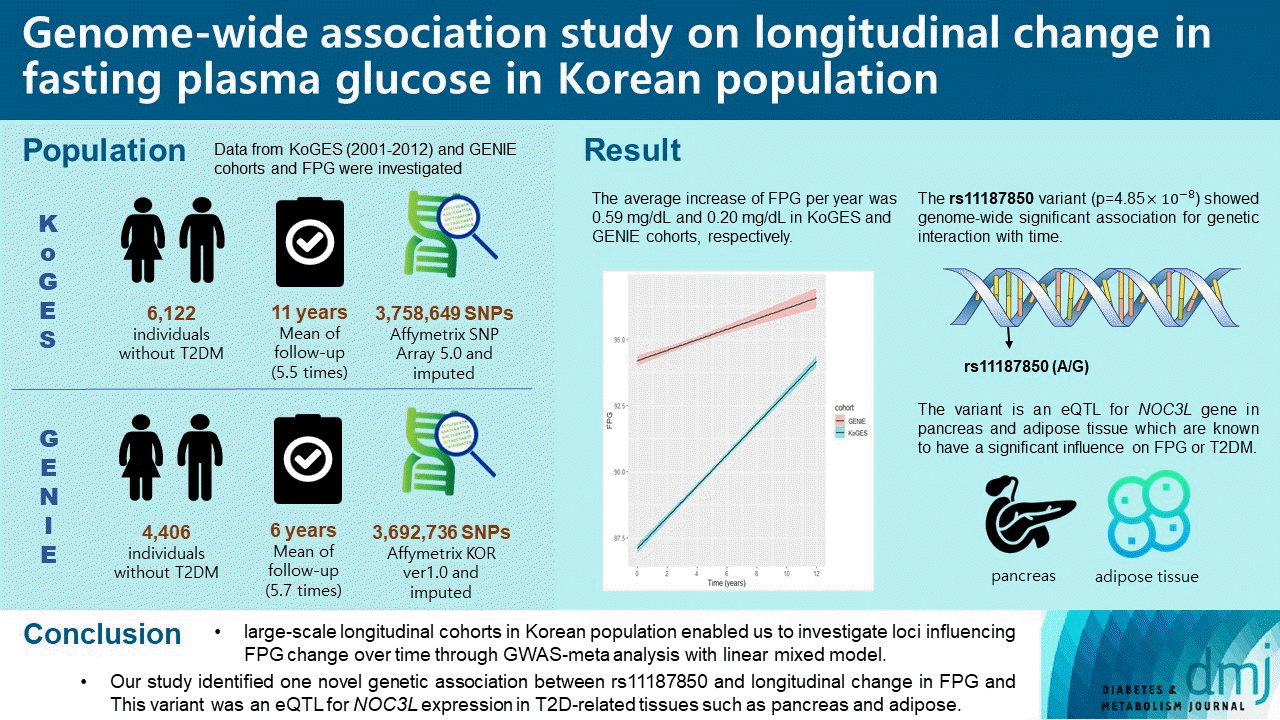
A total of 6,122 subjects in the KoGES cohort were investigated at regular intervals of every 2 years, whereas the 4,406 individuals in the GENIE cohort attended voluntary annual health screening. The baseline characteristics of each cohort are described in Table 1. The proportion of male subjects was 46% and 59% in the KoGES and GENIE cohort, respectively. During the follow-up period, approximately 10% and 5% of participants developed T2DM in the KoGES and GENIE cohort, respectively. The mean age at baseline was 51.5 years in KoGES, which was 5.8 years older than that of the GENIE cohort (45.7 years). The mean BMI was 24.4 kg/m2 in the KoGES and 23.1 kg/m2 in the GENIE. The mean FPG of the KoGES cohort at baseline was 84.1 mg/dL, which is about 9.8 mg/dL lower than that of the GENIE cohort (93.9 mg/dL). The trend of FPG change over time for the two cohorts is plotted in the Supplementary Fig. 1. The average increase of FPG per year was 0.59 mg/dL and 0.20 mg/dL in KoGES and GENIE cohorts, respectively. Information on genotyping platform and number of variants analyzed are presented in Table 1.
We conducted GWAS meta-analysis using KoGES and GENIE cohorts. First, we investigated genetic variants associated with repeated measures of FPG using LMM as it allows to test both main effect of SNP and SNP×time interaction effect with longitudinal data. A total of four genetic variants were associated with repeated measure of FPG levels with genome-wide significance (P<5.00×10⁻⁸) using the LMM. These include rs78529- 720 (P=2.90×10⁻¹⁶) near glucose-6-phosphatase catalytic subunit 2 (G6PC2) and ATP binding cassette subfamily B member 11 (ABCB11), rs895636 (P=2.00×10⁻⁸) near six homeobox 3 (SIX3), rs2971670 (P=8.34×10⁻²⁰) in glucokinase (GCK), and rs12222793 (P=4.30×10⁻¹⁰) near melatonin receptor 1B (MTNR1B) (Table 2). All of these variants have been reported previously to be strongly associated with FPG level [26-30]. Furthermore, the reported results show a trend in the same direction as observed in our study. Compared to single time point approach like LM analysis, multiple observations per person for LMM increase the power to detect a statistically significant genetic loci associated with FPG (Supplementary Table 2) [31]. This is evidenced by the fact that all four variants had lower P in LMM compared to LM. Quantile-quantile (Q-Q) plot and Manhattan plot for the genetic association using LMM of repeated measures of FPG revealed no evidence for inflation of the test statistics (GIF=1.016) (Fig. 1A and B). The regional association plots theses genetic loci are shown in Supplementary Fig. 2.
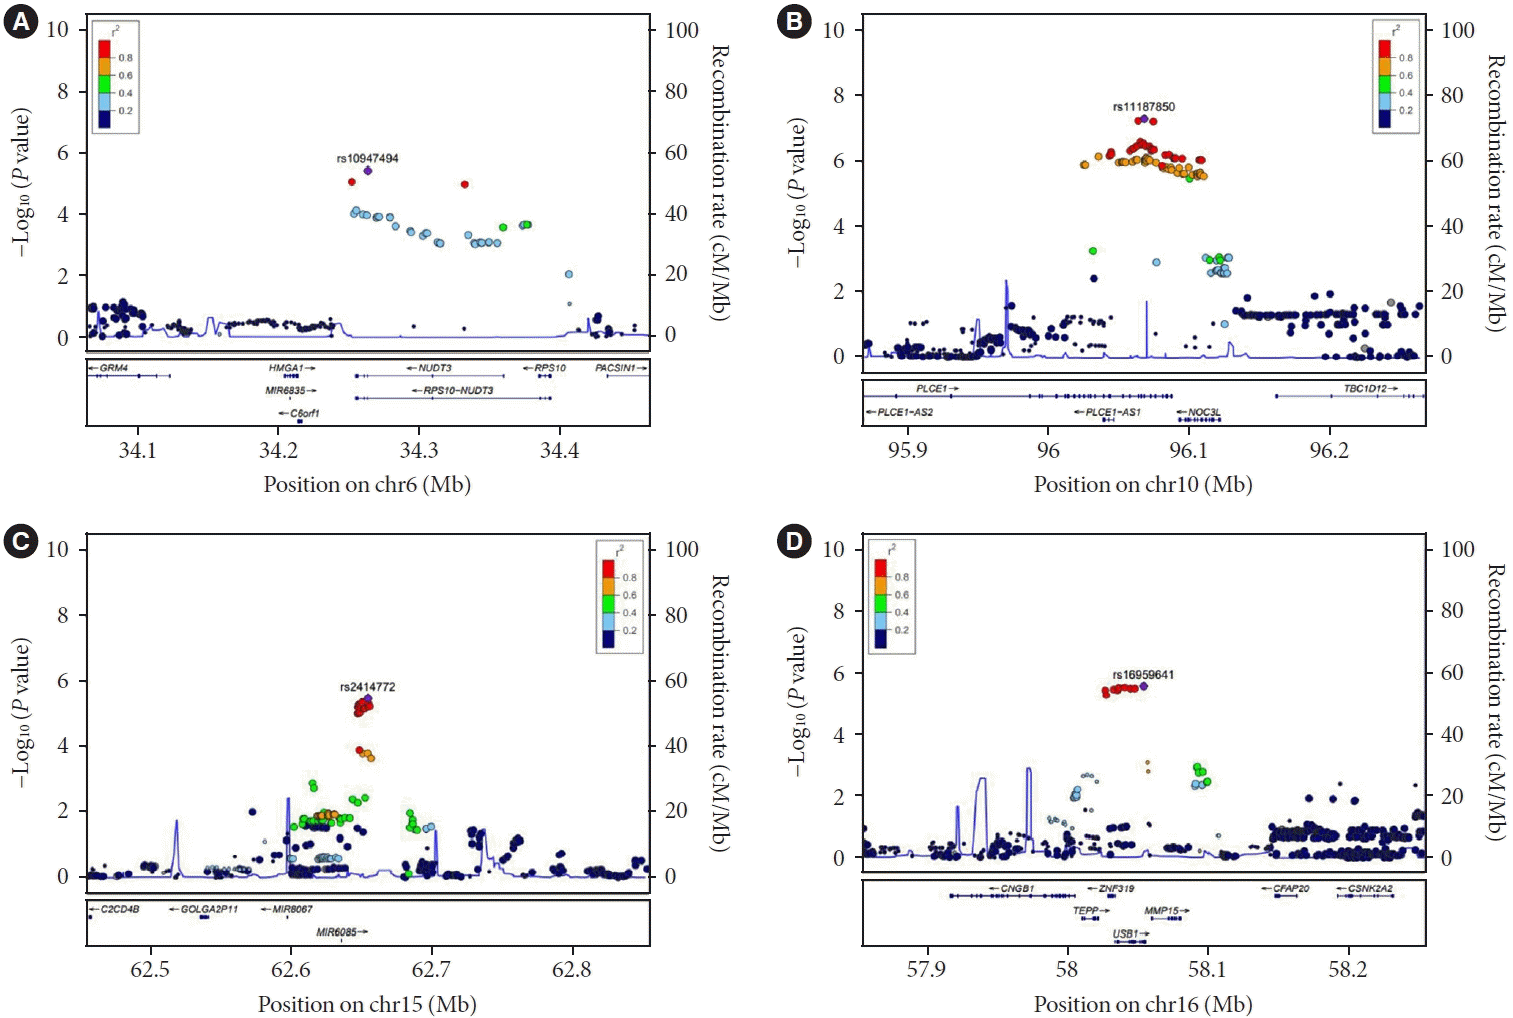
We further investigated genetic variants associated with longitudinal change in FPG using LMM SNP×time interaction term. The statistical model that was used had good control of type 1 error as evidenced by Q-Q plot (GIF=0.999) and Manhattan plot as shown in (Fig. 1C and D). We found one novel SNP, rs11187850, near phospholipase C epsilon 1 (PLCE1) to be associated with longitudinal change in FPG with genomewide significance (P=4.85×10⁻⁸) with CADD score of 10.18. In addition, three variants had suggestive evidence for an association (P<1.00×10⁻⁵): rs10947494 (P=3.64×10⁻⁶) near nudix hydrolase 3 (NUDT3), rs2414772 (P=6.30×10⁻⁶) near microRNA 6085 (MIR6085), and rs16959641 (P=2.64×10⁻⁶) near U6 snRNA biogenesis phosphodiesterase 1 (USB1) (Table 3). Regional association plots are shown using linkage disequilibrium information from Asian 1,000 Genomes in Fig. 2.
We fitted a simple LM with FPG as the outcome variable and follow-up time as the independent variable, categorized by the three genotypes (AA/AG/GG) of the rs11187850 variant which showed genome-wide significant association. The alternative allele, G, was significantly associated with increased slope of FPG over time in both cohorts as shown in Supplementary Fig. 3. Individuals with AG and GG genotype showed larger FPG increase of 0.183 mg/dL and 0.366 mg/dL per year compared to those with AA genotype, respectively. We further investigated whether SNP rs11187850 was associated with risk of T2DM and increased FPG. Although this variant was nominally associated with increased risk of T2DM (P=2.91×10⁻⁶) and increased FPG level (P=4.75×10⁻⁴) in LMM it did not pass the genome-wide significance threshold. Interestingly, this variant was an eQTL for NOC3 like DNA replication regulator (NOC3L) in pancreas (P=2.20×10⁻¹¹), adipose-subcutaneous (P=6.40×10⁻¹¹), and adipose-visceral (P=2.70×10⁻⁶) in GTEx. Decreased expression of NOC3L gene is also associated with islet dysfunction (estimate of the log2-fold-change corresponding to the non-diabetic is −1.217 and P=8.25×10⁻⁴) in GEO datasets (GSE25724).
A limited number of known genetic variants of T2DM, and FPG were nominally associated (P<0.05) with longitudinal change in FPG (Table 4). Among the already known 231 T2DM-related variants, five SNPs (rs2296172 [P=3.42×10⁻³] in MACF1, rs243021 [P=3.37×10⁻²] near LOC101927285 and MIR4432H, rs864745 [P=4.90×10⁻²] near JAZF1, rs10965250 [P=2.93×10⁻³] near CDKN2B-AS1 and DMRTA1 and rs9552911 [P=4.89×10⁻²] near SGCG) showed association with the SNP×time interaction effect. Among the already known 38 FPG-related variants, three SNPs (rs6943153 [P=3.44×10⁻²] near GRB10, rs10811661 [P=5.10×10⁻³] near CDKN2B-AS1 and DMRTA1 and rs2293941 [P=2.90×10⁻²] near PDX1-AS1) had an association with longitudinal change of FPG. However, none of the variants were significant when Bonferroni correction was applied. These findings suggest that the variants associated with T2DM or FPG do not have a significant impact on longitudinal change in glucose level over time.
Our study has statistical power of 80% with a type 1 error rate of 5.00×10⁻⁸ to detect genetic variants, having at least effect size of 0.28 (i.e., 0.28 standard deviation unit difference in the change of FPG over time) in the longitudinal change of FPG (Supplementary Fig. 4). The reason for the difficulty in identifying the SNPs affecting the change in FPG over time can be illuminated based on the GCTA analysis results. As shown in Supplementary Table 3, the GCTA estimated a 10% (P=3.52×10⁻³) marginal influence of the SNP effect, whereas the influence of the SNP-by-time interaction was only 4% (P=7.58×10⁻²). Based on these results, genetic effects on longitudinal change of FPG are likely small.
In this study, the genetic association of longitudinal change in FPG was analyzed in a total of 10,528 Koreans free from T2DM using KoGES, a large-scale community-based prospective cohort, and GENIE, a hospital-based longitudinal routine health checkup cohort. Since the FPG was repeatedly measured for a long period of time and the number of total measurements of each participants was inconsistent, the analysis was conducted using the LMM method, which is known to have better performance than GEE in this situation [9,10]. Our study population was relatively homogeneous and FPG was measured regularly in 2 years interval for KoGES, both of which lead to increased statistical power. We found a novel association between rs11187850 and longitudinal changes in FPG which passed the genome-wide significance threshold. This variant was associated with NOC3L expression level in pancreas and adipose tissue. Known genetic variants of FPG and T2DM were not associated with longitudinal change in FPG. To the best of our knowledge, our study is the first in non-Europeans to provide a comprehensive assessment of genetic risk factors of longitudinal change in FPG using GWAS meta-analysis.
Using LMM for repeated measure of FPG, we identified four known genetic variants associated FPG and one variant significantly associated with SNP×time interaction. The rs11187850 G allele was associated with more rapid deterioration of FPG over time. Interestingly, this variant was associated with metabolic traits of diastolic blood pressure (P=1.37×10⁻¹⁹), systolic blood pressure (P=2.80×10⁻¹⁵), hypertension (P=8.20×10⁻¹²), and ascending aorta diameter (P=1.50×10⁻⁹) in Europeans [32-35]. Even though it was located in an intron of PLCE1, this variant was actually associated with expression level of NOC3L. It has been shown that the NOC3L gene is involved in adipocyte differentiation and glucose metabolism [36,37]. Taken together, it could be possible that rs11187850 affects longitudinal change in FPG by regulating NOC3L gene expression in metabolically active tissue such as pancreas and adipose tissue. However, replication of our finding and further functional investigations are required. There was no other genetic variant that was associated with longitudinal change in FPG due to limited statistical power. In addition, it could be possible that unlike static FPG level that is more affected by genetic variants, its longitudinal change could be more affected by environmental factor.
One of the questions we tried to address during this study was whether genetic variants associated longitudinal change in FPG also affect risk of T2DM or degree of hyperglycemia and vice versa. Although the rs11187850 variant showed nominal association for increased static level of FPG or risk of T2DM, it did not reach genome-wide significance. In addition, we were not able to observe a compelling evidence that previously validated genetic variants of FPG or T2DM affect longitudinal changes in FPG. Even though there were five variants of T2DM and three variants of FPG that were nominally associated with longitudinal change in FPG, they were not significant after adjusting for multiple comparison. Our findings suggest that the biological mechanisms or the genetic determinants of FPG itself or T2DM may be different from that of the longitudinal change in FPG.
When we compare our results with that of the European study which investigated nine cohorts to identify genetic variants association with change in FPG over time, none of the variants with suggestive association (P<5.00×10⁻⁶) were replicated in our study (P>0.05) [38]. Furthermore, the SNP rs11187850 discovered in this study was not replicated in Europeans (P=0.769). There may be several reasons for the discrepancy. First, the statistical method applied in the two studies were different. We used LMM for each repeated measure, but in the European study the longitudinal patterns of FPG were summarized into an individual slope and was analyzed using LM. Our research method has the effect of reducing the variance of the error term by considering more measurements. In addition, we adjusted for baseline BMI which might impact longitudinal change in FPG. Second, there could be ethnic difference in genetic impact and their interaction with environment on longitudinal change in FPG. It has been shown that relative contribution of β-cell dysfunction and insulin resistance could be different between East Asians and Europeans [11]. In addition, it has been shown that there are ancestry specific variants, such as rs2233580 in PAX4, that affect T2DM and related phenotypes only in East Asians [39].
The present study has certain limitations. First, as shown in the GCTA analysis, genome-wide SNP interaction with time explained only a limited portion of the total variance of the longitudinal change in FPG. Considering that only one SNP associated with longitudinal change in FPG was detected, and four SNPs associated with FPG were identified among many previously reported variants, the current sample size may be insufficient to elucidate additional SNP interaction with time. Second, the two cohorts used in the analysis had subtle difference in clinical characteristics, regarding age, BMI, FPG at baseline, follow-up time, and incidence of T2DM as the KoGES was a community-based cohort and the GENIE was a hospital health checkup cohort in an urban area. For the GENIE cohort, FPG measurement interval varied individually and the follow-up duration was shorter compared to the KoGES. Nevertheless, the fact that the direction of the effect size of the suggestive variants were all estimated to be the same in both cohorts means that our results are noteworthy. Third, since the genotyping platforms of the two cohorts had different genomic coverage for common variants (84.8% for KoGES and 95.4% for GENIE), there would have been variants that were not captured in both cohorts. If we were able to use the most updated genotype platform for the two cohorts, more significant variants affecting the longitudinal change of FPG might have been identified.
In conclusion, large-scale longitudinal cohorts in Korean population enabled us to investigate loci influencing FPG change over time through GWAS-meta analysis with LMM. Our study identified one novel genetic association between rs11187850 and longitudinal change in FPG. This variant was an eQTL for NOC3L expression in T2DM-related tissues such as pancreas and adipose. Further studies are required to validate our findings and to understand the details of the biological mechanisms underlying this association. Through these efforts, we hope to derive novel insights on preventing progression of hyperglycemia and development of diabetes.
SUPPLEMENTARY MATERIALS
Supplementary materials related to this article can be found online at https://doi.org/10.4093/dmj.2021.0375.
Notes
REFERENCES
1. Tabak AG, Jokela M, Akbaraly TN, Brunner EJ, Kivimaki M, Witte DR. Trajectories of glycaemia, insulin sensitivity, and insulin secretion before diagnosis of type 2 diabetes: an analysis from the Whitehall II study. Lancet. 2009; 373:2215–21.
2. Heianza Y, Arase Y, Fujihara K, Hsieh SD, Saito K, Tsuji H, et al. Longitudinal trajectories of HbA1c and fasting plasma glucose levels during the development of type 2 diabetes: the Toranomon Hospital Health Management Center Study 7 (TOPICS 7). Diabetes Care. 2012; 35:1050–2.
3. Meigs JB, Muller DC, Nathan DM, Blake DR, Andres R; Baltimore Longitudinal Study of Aging. The natural history of progression from normal glucose tolerance to type 2 diabetes in the Baltimore Longitudinal Study of Aging. Diabetes. 2003; 52:1475–84.
4. Chia CW, Egan JM, Ferrucci L. Age-related changes in glucose metabolism, hyperglycemia, and cardiovascular risk. Circ Res. 2018; 123:886–904.
5. Zhang X, Gregg EW, Williamson DF, Barker LE, Thomas W, Bullard KM, et al. A1C level and future risk of diabetes: a systematic review. Diabetes Care. 2010; 33:1665–73.
6. Mahajan A, Taliun D, Thurner M, Robertson NR, Torres JM, Rayner NW, et al. Fine-mapping type 2 diabetes loci to singlevariant resolution using high-density imputation and islet-specific epigenome maps. Nat Genet. 2018; 50:1505–13.
7. Flannick J, Mercader JM, Fuchsberger C, Udler MS, Mahajan A, Wessel J, et al. Exome sequencing of 20,791 cases of type 2 diabetes and 24,440 controls. Nature. 2019; 570:71–6.
8. Liu CT, Raghavan S, Maruthur N, Kabagambe EK, Hong J, Ng MC, et al. Trans-ethnic meta-analysis and functional annotation illuminates the genetic architecture of fasting glucose and insulin. Am J Hum Genet. 2016; 99:56–75.
9. Sikorska K, Rivadeneira F, Groenen PJ, Hofman A, Uitterlinden AG, Eilers PH, et al. Fast linear mixed model computations for genome-wide association studies with longitudinal data. Stat Med. 2013; 32:165–80.
10. Little RJA, Rubin DB. Statistical analysis with missing data. 3rd ed. Hoboken: John Wiley & Sons;2020.
11. Ohn JH, Kwak SH, Cho YM, Lim S, Jang HC, Park KS, et al. 10-Year trajectory of β-cell function and insulin sensitivity in the development of type 2 diabetes: a community-based prospective cohort study. Lancet Diabetes Endocrinol. 2016; 4:27–34.
12. Moon S, Kim YJ, Han S, Hwang MY, Shin DM, Park MY, et al. The Korea Biobank Array: design and identification of coding variants associated with blood biochemical traits. Sci Rep. 2019; 9:1382.
13. Seo S, Park K, Lee JJ, Choi KY, Lee KH, Won S. SNP genotype calling and quality control for multi-batch-based studies. Genes Genomics. 2019; 41:927–39.
14. Song YE, Lee S, Park K, Elston RC, Yang HJ, Won S. ONETOOL for the analysis of family-based big data. Bioinformatics. 2018; 34:2851–3.
15. Wang K, Li M, Hakonarson H. ANNOVAR: functional annotation of genetic variants from high-throughput sequencing data. Nucleic Acids Res. 2010; 38:e164.
16. Howie BN, Donnelly P, Marchini J. A flexible and accurate genotype imputation method for the next generation of genome-wide association studies. PLoS Genet. 2009; 5:e1000529.
17. Team RC. R: A language and environment for statistical computing. Vienna: R Foundation for Statistical Computing;2013.
18. Willer CJ, Li Y, Abecasis GR. METAL: fast and efficient metaanalysis of genomewide association scans. Bioinformatics. 2010; 26:2190–1.
19. Bacanu SA, Devlin B, Roeder K. The power of genomic control. Am J Hum Genet. 2000; 66:1933–44.
20. Yang J, Lee SH, Goddard ME, Visscher PM. GCTA: a tool for genome-wide complex trait analysis. Am J Hum Genet. 2011; 88:76–82.
21. GTEx Consortium. The Genotype-Tissue Expression (GTEx) project. Nat Genet. 2013; 45:580–5.
22. Dominguez V, Raimondi C, Somanath S, Bugliani M, Loder MK, Edling CE, et al. Class II phosphoinositide 3-kinase regulates exocytosis of insulin granules in pancreatic beta cells. J Biol Chem. 2011; 286:4216–25.
23. Kircher M, Witten DM, Jain P, O’Roak BJ, Cooper GM, Shendure J. A general framework for estimating the relative pathogenicity of human genetic variants. Nat Genet. 2014; 46:310–5.
24. Bland JM, Altman DG. Multiple significance tests: the Bonferroni method. BMJ. 1995; 310:170.
25. Gauderman WJ. Sample size requirements for matched casecontrol studies of gene-environment interaction. Stat Med. 2002; 21:35–50.
26. Dupuis J, Langenberg C, Prokopenko I, Saxena R, Soranzo N, Jackson AU, et al. New genetic loci implicated in fasting glucose homeostasis and their impact on type 2 diabetes risk. Nat Genet. 2010; 42:105–16.
27. Kim YJ, Go MJ, Hu C, Hong CB, Kim YK, Lee JY, et al. Largescale genome-wide association studies in East Asians identify new genetic loci influencing metabolic traits. Nat Genet. 2011; 43:990–5.
28. Li X, Shu YH, Xiang AH, Trigo E, Kuusisto J, Hartiala J, et al. Additive effects of genetic variation in GCK and G6PC2 on insulin secretion and fasting glucose. Diabetes. 2009; 58:2946–53.
29. Prokopenko I, Langenberg C, Florez JC, Saxena R, Soranzo N, Thorleifsson G, et al. Variants in MTNR1B influence fasting glucose levels. Nat Genet. 2009; 41:77–81.
30. Hu C, Zhang R, Wang C, Yu W, Lu J, Ma X, et al. Effects of GCK, GCKR, G6PC2 and MTNR1B variants on glucose metabolism and insulin secretion. PLoS One. 2010; 5:e11761.
31. Furlotte NA, Eskin E, Eyheramendy S. Genome-wide association mapping with longitudinal data. Genet Epidemiol. 2012; 36:463–71.
32. Evangelou E, Warren HR, Mosen-Ansorena D, Mifsud B, Pazoki R, Gao H, et al. Genetic analysis of over 1 million people identifies 535 new loci associated with blood pressure traits. Nat Genet. 2018; 50:1412–25.
33. Gazal S, Loh PR, Finucane HK, Ganna A, Schoech A, Sunyaev S, et al. Functional architecture of low-frequency variants highlights strength of negative selection across coding and non-coding annotations. Nat Genet. 2018; 50:1600–7.
34. Zhu Z, Wang X, Li X, Lin Y, Shen S, Liu CL, et al. Genetic overlap of chronic obstructive pulmonary disease and cardiovascular disease-related traits: a large-scale genome-wide cross-trait analysis. Respir Res. 2019; 20:64.
35. Pirruccello JP, Chaffin MD, Chou EL, Fleming SJ, Lin H, Nekoui M, et al. Deep learning enables genetic analysis of the human thoracic aorta. Nat Genet. 2022; 54:40–51.
36. Johmura Y, Watanabe K, Kishimoto K, Ueda T, Shimada S, Osada S, et al. Fad24 causes hyperplasia in adipose tissue and improves glucose metabolism. Biol Pharm Bull. 2009; 32:1656–64.
37. Tominaga K, Johmura Y, Nishizuka M, Imagawa M. Fad24, a mammalian homolog of Noc3p, is a positive regulator in adipocyte differentiation. J Cell Sci. 2004; 117(Pt 25)(Pt 25):6217–26.
38. Liu CT, Merino J, Rybin D, DiCorpo D, Benke KS, BraggGresham JL, et al. Genome-wide association study of change in fasting glucose over time in 13,807 non-diabetic European ancestry individuals. Sci Rep. 2019; 9:9439.
39. Kwak SH, Chae J, Lee S, Choi S, Koo BK, Yoon JW, et al. Nonsynonymous variants in PAX4 and GLP1R are associated with type 2 diabetes in an East Asian population. Diabetes. 2018; 67:1892–902.
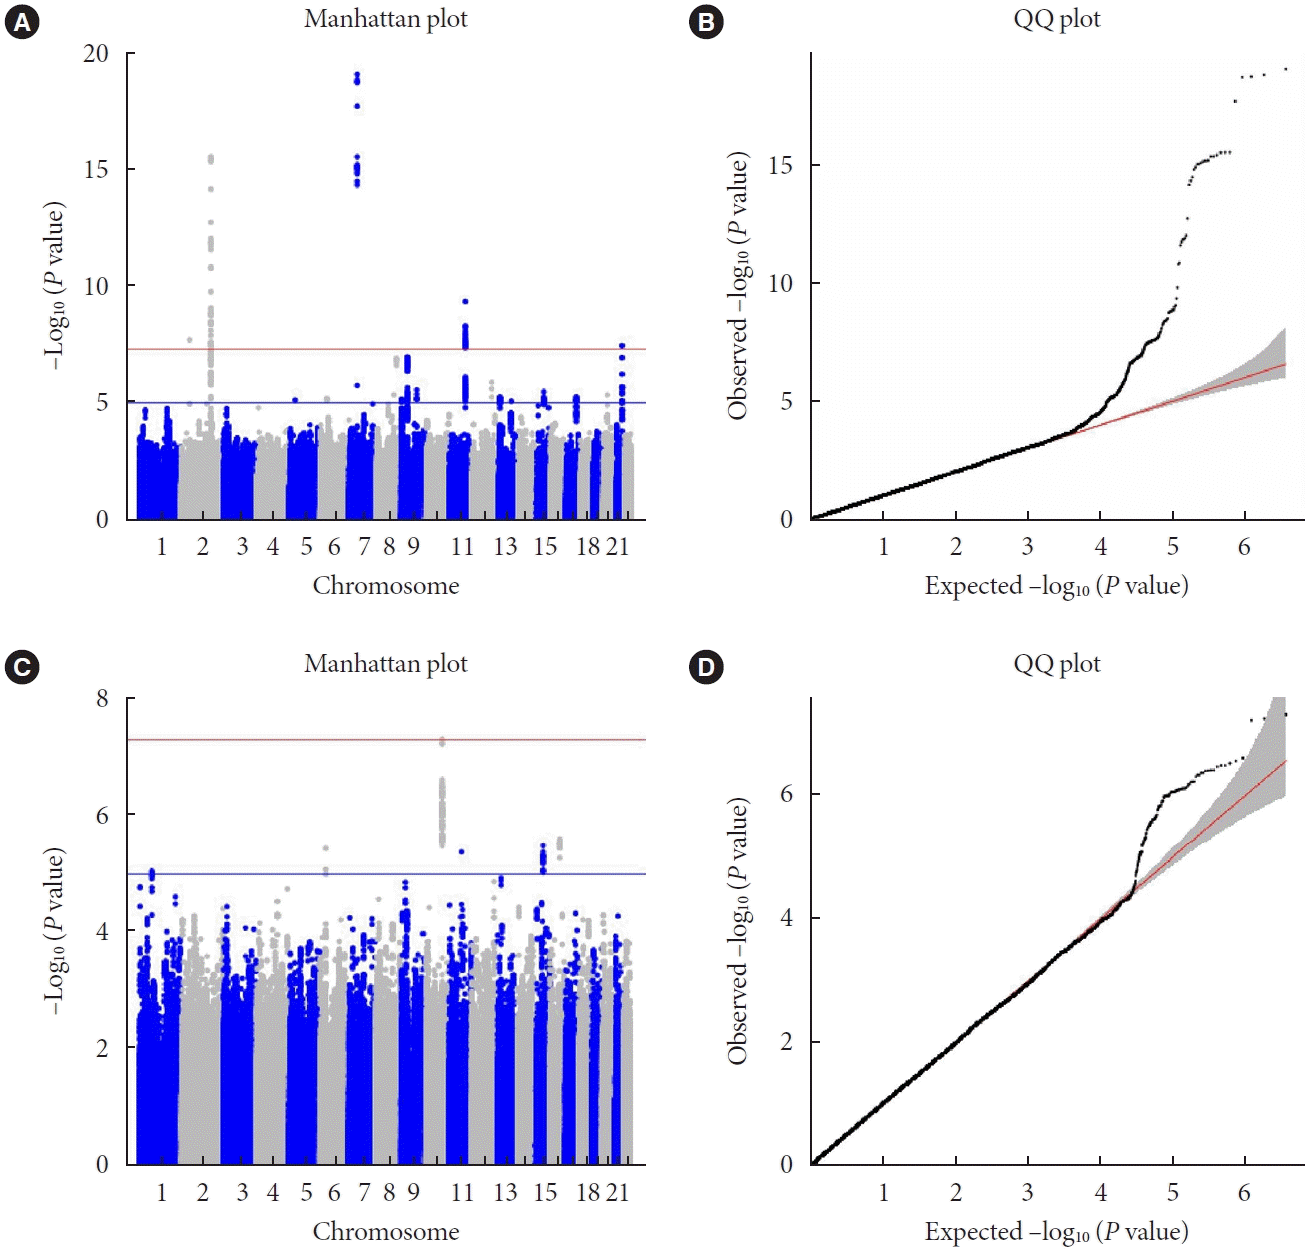
Table 1.
Study population | Total | Case | Control | Male | Age, yr | BMI, kg/m2 | Fasting glucose, mg/dL | Mean of F/U duration | Genotyping platform |
SNP |
||
---|---|---|---|---|---|---|---|---|---|---|---|---|
Genotypeda | Imputedb | Meta | ||||||||||
KoGES | 6,122 | 790 (13) | 5,332 (87) | 2,847 (46) | 51.5±8.7 | 24.4±3.0 | 84.1±8.5 | 11 years (5.5 times) | Affymetrix SNP Array 5.0 | 399,013 | 3,758,649 | 2,713,317 |
GENIE | 4,406 | 237 (5) | 4,169 (95) | 2,604 (59) | 45.7±8.6 | 23.1±2.9 | 93.9±9.9 | 6 years(5.7 times) | Affymetrix KOR_v1.0 | 344,632 | 3,692,736 |
BMI, body mass index; F/U, follow-up; SNP, single nucleotide polymorphism; KoGES, Korea Genome and Epidemiology Study; GENIE, Gene-Environment Interaction and phenotype.
Table 2.
SNP | Chr; position | A | Studya | Effect | SE | wAF | P value | ANNOVAR |
---|---|---|---|---|---|---|---|---|
rs78529720 | 2; 169777297 | T/C | KoGES | 1.008 | 0.155 | 7.11×10⁻¹¹ | G6PC2, ABCB11 (intergenic) | |
GENIE | 1.036 | 0.209 | 0.347 | 7.34×10⁻⁷ | ||||
META | 1.017 | 0.124 | 2.90×10⁻¹⁶ | |||||
rs895636 | 2; 45188353 | C/T | KoGES | 0.574 | 0.151 | 1.43×10⁻⁴ | SIX3, SIX2 (intergenic) | |
GENIE | 0.831 | 0.198 | 0.375 | 2.75×10⁻⁵ | ||||
META | 0.668 | 0.120 | 2.00×10⁻⁸ | |||||
rs2971670 | 7; 44226101 | C/T | KoGES | 1.346 | 0.187 | 6.17×10⁻¹³ | GCK (intronic) | |
GENIE | 1.400 | 0.250 | 0.185 | 2.18×10⁻⁸ | ||||
META | 1.365 | 0.149 | 8.34×10⁻²⁰ | |||||
rs12222793 | 11; 92667047 | A/G | KoGES | 0.827 | 0.144 | 1.14×10⁻⁸ | FAT3, MTNR1B (intergenic) | |
GENIE | 0.561 | 0.192 | 0.515 | 3.49×10⁻³ | ||||
META | 0.731 | 0.115 | 4.30×10⁻¹⁰ |
Table 3.
SNP | Chr; position | A | Studya | Effect | SE | wAF | P value | ANNOVAR |
---|---|---|---|---|---|---|---|---|
rs10947494 | 6; 34263743 | A/G | KoGES | 0.213 | 0.046 | 4.53×10⁻⁶ | NUDT3, RPS10-NUDT3 (intronic) | |
GENIE | 0.120 | 0.068 | 0.203 | 7.96×10⁻² | ||||
META | 0.183 | 0.038 | 3.64×10⁻⁶ | |||||
rs11187850 | 10; 96068480 | A/G | KoGES | 0.152 | 0.042 | 3.49×10⁻⁴ | PLCE1 (intronic) | |
GENIE | 0.266 | 0.063 | 0.253 | 2.45×10⁻⁵ | ||||
META | 0.187 | 0.034 | 4.85×10⁻⁸ | |||||
rs2414772 | 15; 62654213 | G/A | KoGES | –0.163 | 0.039 | 3.26×10⁻⁵ | MIR6085, MGC15885 (intergenic) | |
GENIE | –0.134 | 0.058 | 0.676 | 2.14×10⁻² | ||||
META | –0.153 | 0.032 | 6.30×10⁻⁶ | |||||
rs16959641 | 16; 58054099 | C/G | KoGES | 0.222 | 0.068 | 1.09×10⁻³ | USB1 (exonic) | |
GENIE | 0.366 | 0.107 | 0.077 | 6.00×10⁻⁴ | ||||
META | 0.263 | 0.057 | 2.46×10⁻⁶ |
Table 4.
Trait | SNP | Chr; position | A | Studya | Effect | SE | wAF | P value | ANNOVAR |
---|---|---|---|---|---|---|---|---|---|
T2DM | rs2296172 | 1; 39835817 | A/G | KoGES | 0.145 | 0.051 | 5.08×10⁻³ | MACF1 (exonic) | |
GENIE | 0.097 | 0.079 | 0.144 | 2.21×10⁻¹ | |||||
META | 0.130 | 0.042 | 3.42×10⁻³ | ||||||
rs243021 | 2; 60584819 | G/A | KoGES | 0.073 | 0.038 | 5.81×10⁻² | LOC101927285, MIR4432H (intergenic) | ||
GENIE | 0.060 | 0.057 | 0.667 | 2.94×10⁻¹ | |||||
META | 0.069 | 0.031 | 3.37×10⁻² | ||||||
rs864745 | 7; 28180556 | T/C | KoGES | 0.070 | 0.040 | 8.51×10⁻² | JAZF1 (intronic) | ||
GENIE | 0.062 | 0.061 | 0.272 | 3.11×10⁻¹ | |||||
META | 0.067 | 0.033 | 4.90×10⁻² | ||||||
rs10965250 | 9; 22133284 | G/A | KoGES | –0.094 | 0.036 | 9.85×10⁻³ | CDKN2B-AS1, DMRTA1 (intergenic) | ||
GENIE | –0.086 | 0.055 | 0.436 | 1.19×10⁻¹ | |||||
META | –0.091 | 0.030 | 2.93×10⁻³ | ||||||
rs9552911 | 13; 23864657 | G/A | KoGES | –0.084 | 0.044 | 5.66×10⁻² | SGCG (intronic) | ||
GENIE | –0.053 | 0.066 | 0.225 | 4.25×10⁻¹ | |||||
META | –0.074 | 0.036 | 4.89×10⁻² | ||||||
FPG | rs6943153 | 7; 50791579 | T/C | KoGES | –0.056 | 0.041 | 1.80×10⁻¹ | GRB10 (intronic) | |
GENIE | –0.105 | 0.062 | 0.737 | 9.07×10⁻² | |||||
META | –0.070 | 0.034 | 3.44×10⁻² | ||||||
rs10811661 | 9; 22134094 | T/C | KoGES | –0.090 | 0.036 | 1.23×10⁻² | CDKN2B-AS1, DMRTA1 (intergenic) | ||
GENIE | –0.076 | 0.055 | 0.438 | 1.67×10⁻¹ | |||||
META | –0.085 | 0.030 | 5.10×10⁻³ | ||||||
rs2293941 | 13; 28491198 | G/A | KoGES | 0.084 | 0.037 | 2.41×10⁻² | PDX1-AS1 (ncRNA_intronic) | ||
GENIE | 0.039 | 0.055 | 0.466 | 4.73×10⁻¹ | |||||
META | 0.069 | 0.030 | 2.90×10⁻² |
FPG, fasting plasma glucose; T2DM, type 2 diabetes mellitus; SNP, single nucleotide polymorphism; Chr, chromosome; A, reference/alternative allele; SE, standard error; wAF, weighted alternative allele frequency; ANNOVAR, ANNOtate VARiation; KoGES, Korea Genome and Epidemiology Study; GENIE, Gene-Environment Interaction and phenotype; META, meta-analysis.