Abstract
Background/Aims
Shear wave elastography (SWE) is used for liver fibrosis staging based on stiffness measurements. It can be performed using endoscopic ultrasound (EUS) or a transabdominal approach. Transabdominal accuracy can be limited in patients with obesity because of the thick abdomen. Theoretically, EUS-SWE overcomes this limitation by internally assessing the liver. We aimed to define the optimal technique for EUS-SWE for future research and clinical use and compare its accuracy with that of transabdominal SWE.
Methods
Benchtop study: A standardized phantom model was used. The compared variables included the region of interest (ROI) size, depth, and orientation and transducer pressure.
Porcine study: Phantom models with varying stiffness values were surgically implanted between the hepatic lobes.
Results
For EUS-SWE, a larger ROI size of 1.5 cm and a smaller ROI depth of 1 cm demonstrated a significantly higher accuracy. For transabdominal SWE, the ROI size was nonadjustable, and the optimal ROI depth ranged from 2 to 4 cm. The transducer pressure and ROI orientation did not significantly affect the accuracy. There were no significant differences in the accuracy between transabdominal SWE and EUS-SWE in the animal model. The variability among the operators was more pronounced for the higher stiffness values. Small lesion measurements were accurate only when the ROI was entirely situated within the lesion.
Elastography is a non-invasive imaging modality that provides information on the inherent elasticity of tissue by producing an acoustic radiofrequency force impulse and assessing the transversely oriented shear waves that propagate through surrounding tissue.1 First described in the 1990s, elastography has diverged into numerous sub-modalities, including transient elastography (TE, more commonly known as FibroScan),2,3 acoustic radiation force impulse,4,5 real-time elastography,6 shear wave elastography (SWE),7,8 and magnetic resonance elastography.9 These different elastography techniques, with the exception of TE and magnetic resonance elastography, are performed along with ultrasound to diagnose malignancy as well as benign changes in organ parenchyma by correlating stiffness measurements to certain disease states (e.g., liver fibrosis or cirrhosis).10-12
One particular area of interest that has been rapidly developing over the last few years is SWE. The basic premise of SWE is the transmission of shear waves from a probe that propagates through the issue perpendicular in velocity to the direction of the ultrasound beam, which is then translated to stiffness or elasticity measurements.8 This technology is safe and non-invasive and has shown promise in many human studies over the past decade for diagnostic purposes, including both organ parenchyma and lesions of interest.7,8,13-15
Traditionally, SWE could only be deployed with a transabdominal transducer probe (i.e., probe pressed on the skin of the abdomen to visualize underlying structures), and the technology is available in select clinics across the United States for liver fibrosis staging, often coupled with transabdominal ultrasound.7 However, this technology is limited in its application in visualizing deeper tissues owing to lack of ultrasound/shear wave penetration.16 This is especially an issue in patients with obesity, in which a thicker abdominal wall yields an even greater distance between deeper tissues and the transducer probe and could reduce the ability to perform reliable elastography.17,18 In one study, although transabdominal SWE could be reliably performed in patients with severe obesity, elastography measurements in these patients when compared to those in another study who were non-obese demonstrated poorer correlation to liver biopsies via area under the receiver operating characteristic (AUROC) analysis.19,20 Recently, endoscopic ultrasound SWE (EUS-SWE) systems (Arietta 850; Olympus America Inc., Center Valley, PA, USA) have become commercially available, which theoretically overcome this limitation by allowing assessment of organ parenchyma (e.g., liver) internally across a thin gastrointestinal wall.21 This capability theoretically increases the diagnostic utility of SWE, as EUS-SWE bypasses the need to go through the skin and soft tissue when evaluating deeper organ parenchyma and potential lesions, thereby possibly achieving better imaging visualization and a lower noise-to-signal ratio.
There have been preliminary clinical reports and studies on the EUS-SWE technology as early as 2019.21-24 However, they mostly pertain to pancreatic applications, and no studies have defined optimal techniques. Thus, the aims of this study were to establish the optimal technique for EUS-SWE in both benchtop and in vivo models and compare the performance characteristics between EUS-SWE and transabdominal SWE.
The study aims were explored in two steps: first, a benchtop study and second, an animal study using a healthy porcine model. A porcine model was selected as the experimental species for this study because the size and anatomy similar to that of humans are clinically relevant for testing endoscopic devices. This model will allow for successful implementation and evaluation of the EUS-SWE technology.
A phantom model (Zerdine hydrogel polymer; Computerized Imaging Reference Systems Inc., Norfolk, VA, USA) with a reference stiffness value of 6.8 kPa was used for the EUS-SWE measurements. Both transabdominal and EUS elastography transducers (attached to the Aloka Arietta 850 Diagnostic Ultrasound System; Olympus America Inc.) were placed on top of the phantom model separately. An ultrasound image coupled with a region of interest (ROI) (center orange box) (Fig. 1) was then displayed. The ROI indicated the location of the elastography measurements. Variables, including the ROI size (length×width), ROI distance to the transducer (i.e., depth), ROI orientation relative to the transducer, and pressure exerted on the transducer, were independently evaluated to assess the impact on accuracy, as determined by the average percentage deviation from the reference stiffness across multiple measurements. The percentage deviation was determined by the difference between the measured and reference stiffness values divided by the reference stiffness value (e.g., a difference of 1 kPa between the measured and reference values with a reference value of 10 kPa will yield a 10% deviation).
The stiffness value (kPa) was derived from the formula E=3Vs2ρ, where E is the stiffness in kilopascals (Young’s modulus); Vs is the median shear wave velocity detected by the elastography transducer; and ρ is the tissue density, which is referenced to be the same as that of water, of which the density is defaulted to 1.7 The device used generally provides a unique reliability index that determines how many Vs measurements are reliable, expressed as a percentage; this measurement was used to calculate the final Vs number and derive the stiffness value. Yada et al.25 in 2015 determined that when the reliability index (i.e., VsN) was less than 50%, accurate measurements tended to be difficult, and as such, the 50% cutoff was used as a benchmark for this study.
For EUS-SWE, standard measurements were performed at an ROI size of 0.5 (length)×1 cm (width) and an ROI depth of 2 cm, with the orientation centered on the screen and moderate pressure exerted on the transducer probe. Each independent variable was then adjusted separately: 0.5-cm increment changes in the ROI length (up to 1.5 cm for EUS-SWE; width not adjustable), 1-cm increment changes in the ROI depth, and ±45° in orientation, both on the left and right sides of the center. The pressure exerted on the transducer probe was also adjusted separately to include light, moderate, and heavy pressures. Light pressure was defined as minimal pressure on the transducer while still touching the surface and without a change in ultrasound image quality, while heavy pressure was defined as exerting maximal pressure on the transducer, without any change in image quality. Moderate pressure was defined as the pressure operators would normally use in a clinical setting. For transabdominal SWE, the main differences were the nonadjustable setting in the ROI size, which was defaulted to 1.5×1.0 cm, and increased depth (up to 6 cm, instead of only 3 cm for EUS-SWE). Twenty measurements were performed by two operators per iteration.
All elastography measurements were performed in healthy pigs. Two male Yorkshire pigs were used for this study. The pigs averaged 40kg in weight (38 and 42 kg). The pigs were anesthetized using standard induction techniques to minimize discomfort and were placed under isoflurane gas to maintain sedation. Endotracheal intubation was performed, and vital signs were monitored by a trained technician to ensure that the pigs remained sedated and without signs of pain. An endoscope was then passed down the gastrointestinal tract of the pigs to perform a rapid survey of the anatomy and comply with feeding preparations. The endoscope was advanced beyond the pylorus into the duodenum to visualize the liver parenchyma using EUS. The pigs were then placed in the supine/dorsal recumbency position, with surgical access to the abdomen created through an abdominal incision using a scalpel. Four precut circular Zerdine hydrogen polymer blocks (10 cm in diameter) with known reference stiffness values of 2.0, 7.3, 19.2, and 37.0 kPa were prepared. Each of them was individually implanted into the pig abdominal cavity one at a time (with exchange of any previous reference gel, if applicable). EUS-SWE and transabdominal SWE measurements were performed for each reference polymer gel. Two operators performed ten measurements each for each modality and reference model combination. Two additional operators performed additional measurements to assess the variability in accuracy among the operators. After measurements for all four reference models were completed, a second experiment involving smaller blocks of a 2×2×2-cm 19.2-kPa reference gel model inserted into the abdominal cavity was performed. Measurements were obtained with the ROI placed both in the center and periphery of the lesion. After all measurements, the reference gels were removed, and the incision site was closed with sutures. The pigs were then humanely euthanized in accordance with the animal facility’s standard of practice and the American Veterinary Medical Association guidelines on euthanasia.
All EUS-SWE and transabdominal SWE measurements were then analyzed to obtain the average percentage deviation from the reference value and compared among elastography modality and reference stiffness values. Given the presence of multiple operators, interoperator variability was also analyzed. All statistical analyses were performed using the SAS ver. 9.4 software (SAS Institute, Cary, NC, USA).
We reported the results based on the measurements in the phantom model with a reference stiffness value of 6.8 kPa. First, we measured the effect of the ROI size. A larger ROI was more accurate than a smaller ROI (4.3% for a 1.5-cm ROI size vs. 10.3% and 15.0% for 1- and 0.5-cm ROI sizes, p=0.001 and 0.001, respectively) (Fig. 2A). Second, we examined the ROI depth. Shallower measurements were more accurate than deeper measurements (8.5% average deviation at a 1-cm depth vs. 15.0% at a 2-cm depth, p=0.020, and 22.3% at a 3-cm depth, p=0.0012) (Fig. 2B). Measurements were performed up to a depth of 3 cm without losing the ultrasound image quality. No significant differences were found when the ROI was rotated by 45° in either direction or with changes in pressure exerted on the transducer probe (p>0.05 for all pairwise comparisons) (Fig. 2C, D). More than 90% of the measurements were able to achieve a VsN of 50% or greater.
For transabdominal SWE, the ROI size could not be adjusted, with default settings of 1.5 cm in height. ROI measurements could be extended further to a distance of 6 cm without losing the ultrasound image quality. A 2–4-cm depth yielded the greatest accuracy (–5% to 10% deviation from the reference stiffness value). At depths of 1 and 5 cm or greater, the accuracy averaged 15% deviation or higher (p<0.05 for all pairwise combinations between depths of 2–4 and 1, 5, and 6 cm) (Fig. 3). Changes in the orientation or pressure on the transducer probe for transabdominal SWE also did not result in any difference in accuracy (p>0.05 for all pairwise comparisons; results not shown).
The reliable indicator (VsN) was consistently above 90% on average for all transabdominal SWE and EUS-SWE measurements in the benchtop study.
In vivo stiffness measurements for transabdominal SWE and EUS-SWE were compared against those of four phantom models (reference stiffness values of 2.0, 7.3, 19.2, and 37.0 kPa) implanted in the porcine model. The abdominal wall thickness in the porcine model was 0.5 cm. A total of 20 measurements were performed per phantom model stiffness for both transabdominal SWE and EUS-SWE. There were no significant differences between the two modalities (p>0.05 for all pairwise comparisons) (Fig. 4). The reliability indicator (VsN) was consistently above 50% for 7.3 kPa and higher, but was low for 2.0 kPa (average of 33% for transabdominal SWE and 72% for EUS-SWE, p<0.0001) (Supplementary Fig. 1). However, in the scatter-plot analysis, there was no significant correlation between the VsN and percentage deviation from the reference stiffness value across all reference stiffness models (Supplementary Fig. 2).
There was no significant interoperator variability for the lower stiffness values of 2.0 and 7.3 kPa when comparing the percentage deviation among the four operators, while a significant variability was present for the higher stiffness values of 19.2 and 37.0 kPa for both EUS-SWE and transabdominal SWE. Figure 5 shows the percentage deviation for 7.3 kPa (top) and 19.2 kPa (bottom) as representation of the lower and higher stiffness value models, respectively.
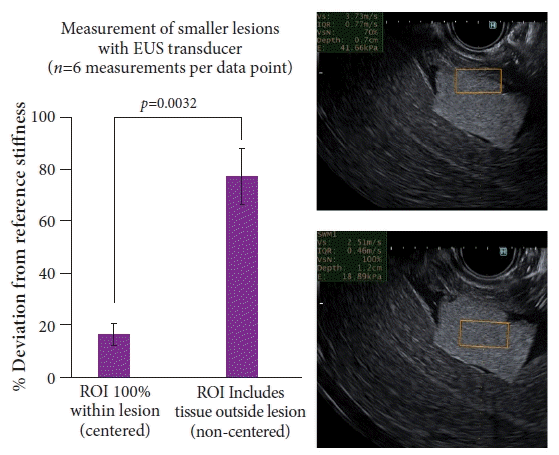
Finally, we explored the quality and accuracy of the measurements obtained via EUS-SWE on smaller blocks of phantom-model polymer gel in the shape of 2×2-cm blocks inserted into the pig abdominal cavity, mimicking smaller lesions in the clinical realm. The ROI (1×0.5 cm) was centered entirely within the lesion of interest (19.2 kPa reference phantom model) and then adjusted to include the periphery and outside tissue. There was a considerable difference in the percentage deviation between the two views (17% for the centered ROI vs. 77% for the non-centered ROI, p=0.0032, n=6 for each view) (Fig. 6). The VsN was not an accurate predictor for a higher percentage deviation; 100% and 83% of the measurements for the centered and non-centered ROI, respectively, had a VsN of greater than 60%.
To our knowledge, this is the first study to systematically evaluate the performance characteristics in terms of accuracy and reliability between EUS-SWE and transabdominal SWE in both benchtop and in vivo animal studies. We found that the ROI size and depth both have an impact on accuracy, with an optimal ROI size of 1.5 cm and optimal depth of 2 cm or less for EUS-SWE and optimal depth of 2 to 4 cm for transabdominal SWE. Notably, there is no ability to adjust the ROI size for transabdominal SWE, with default settings of 1.5 cm. The ROI orientation and pressure exerted on the transducer probe did not significantly affect the accuracy of the findings. We also observed no significant differences in accuracy between EUS-SWE and transabdominal SWE for varying stiffness values based on our in vivo animal study, and EUS-SWE was not optimized to evaluate smaller lesions of interest unless the entire ROI could fit within the lesion. The reliability indicator (VsN) was significantly lower in transabdominal SWE than in EUS-SWE, particularly for the lowest stiffness value of 2.0 kPa; however, this did not significantly impact the accuracy. Finally, there was some variability in the accuracy among the operators for both transabdominal SWE and EUS-SWE, which was more pronounced at the higher stiffness values.
EUS-SWE has many theoretical advantages over transabdominal SWE; hence, this study was performed. The most important advantage is the reproducible close proximity of the EUS transducer to the liver, pancreas, and other gastrointestinal targets (approximately 1 cm distance), regardless of the transgastric/transduodenal view and body habitus. In contrast, transabdominal evaluation can be impeded by a thick abdominal wall, which is more frequent in patients with obesity. This is especially important when assessing patients with non-alcoholic fatty liver disease, in whom obesity is highly prevalent. Among patients with obesity, both SWE and standard TE have demonstrated reduced accuracy and higher failure rates.18-20 In one study, standard TE yielded a 10-fold higher odds ratio for a body mass index of ≥28 kg/m2.26 For TE, XL probes are often required to obtain a reading, as they have much lower failure rates than standard TE probes.27 However, it is unclear how accurate these readings are with increased adipose tissue separating the transducer probe from the liver. In our study, we also demonstrated that an ROI depth greater than 4 cm can impact accuracy, which would be the case for many patients with obesity, further highlighting this concern. Our study was limited in that we were unable to use an obese pig model. In our particular porcine model with a thin abdominal wall, there were no differences in the accuracy between transabdominal SWE and EUS-SWE. However, we predicted that transabdominal SWE readings would become less accurate with increasing abdominal wall thickness.
Another theoretical advantage of EUS-SWE is its flexibility in adjusting the ROI size. This can be important when evaluating smaller lesions of interest, where an ROI size of 0.5×1.0 cm can fit within a lesion in EUS-SWE, while an ROI size of 1.5×1.0 cm would not in transabdominal SWE. In this study, we demonstrated that if the ROI could not completely fit within the lesion, the accuracy is significantly diminished, despite similar VsN readings. Therefore, transabdominal SWE is not a great tool for evaluating lesions unless the lesions are fairly large, whereas EUS-SWE offers more flexibility and a higher range of clinical utility when evaluating small lesions.
In our study, we measured the accuracy using a surrogate measurement of percentage deviation from the reference stiffness value. We used this particular variable, as it allowed for fairer comparisons among various reference values (e.g., a 0.5-kPa difference has a greater value to a 2.0-kPa reference model than to a 37.0-kPa reference model). We also used the absolute value of percentage deviation, which does not infer direction, but rather the magnitude of distance from the true value. The reduced emphasis on direction has its advantages as a closer surrogate for accuracy. Directionality (e.g., whether a measurement is above or below the reference value) can be informative for device calibration purposes; however, this was not the intent of the study.
In terms of the clinical applicability of EUS-SWE, with an optimized ROI size of 1.5 cm and depth of 1–2 cm, the accuracy can be as high as only a 5% deviation from the actual value. This correlates to a 0.35-kPa difference for a true value of 7 kPa. For liver applications, this is around the F2 cutoff value of 7.29 kPa for non-alcoholic fatty liver disease.28 Even with a 10% deviation, a 0.7-kPa average difference would be fairly accurate and clinically applicable in distinguishing, for example, F2 fibrosis from F1 or F3 fibrosis. However, a percentage deviation higher than 10% could lead to miscategorization; hence, optimization and standardization of the EUS-SWE technique are essential for future studies of this novel technology.
Finally, variability among the operators was not an issue for the smaller stiffness values of 2.0 and 7.3 kPa, but was present for the stiffer reference values of 19.2 and 37.0 kPa. For the assessment of liver fibrosis, although there is minimal variability among operators across the entire range of stiffness values, the concern regarding variability is somewhat allayed by the fact that variability is more pronounced in the cirrhosis range and less so in the lower fibrosis stages and is thus less clinically relevant.
Our study has several limitations. First, as mentioned previously, we did not use an obese porcine model. Second, we did not have reference models between the values of 7.3 and 19.2 kPa, which encompass a large range of fibrosis staging between F2 and F4 for liver applications. However, it could be argued that since the stiffness values of 7.3 and 19.2 kPa performed similarly in accuracy, stiffness values in between should yield similar findings. Third, our outcome measure of pressure exerted on the transducer was based on a subjective grading scale of light, medium, and heavy that was standardized to not interfere with the ultrasound image quality. Heavier pressures that could “indent” the parenchyma and thus change the image quality were not evaluated in this study. Finally, owing to the wide range of measurements we performed in both the benchtop and animal models, the number of measurements for each variation was limited owing to time constraints of the research staff. As such, the significance of some of the comparisons might not have been demonstrated because of the low power.
Nevertheless, our study also had several strengths. First, to reiterate, this is the first study of its kind to evaluate EUS-SWE in a highly rigorous manner, and it was performed in both controlled benchtop and animal studies with standardized models. Second, the findings can be immediately applied to current clinical practice and aid in the methodology of future human clinical trials, especially in liver fibrosis staging and malignant lesion evaluation. Third, we demonstrated and quantified specific scenarios (e.g., obesity and evaluation of lesions) in which EUS-SWE may be superior to existing transabdominal elastography modalities and hence pave a way for broader applicability of elastography technology in the diagnosis of gastrointestinal diseases.
In conclusion, our study results suggest the following parameters for the optimal technique for EUS-SWE: an optimal viewing window with an ROI size of 1 to 1.5 cm and depth of less than 2 cm. The orientation of and pressure exerted on the transducer do not seem to affect the accuracy. For transabdominal SWE, an ROI depth of 2 to 4 cm is the optimal viewing window, although this can be difficult to achieve clinically in patients with obesity. SWE is not optimized to evaluate smaller lesions of interest unless the entire ROI can be situated within the lesion, which may be more favorable for EUS-SWE because the ROI size can be adjusted. We did not find differences in the accuracy between the two imaging modalities, and any variability among the operators was more pertinent to the measurements in the higher stiffness value range. Reliability was lower with transabdominal SWE across varying stiffness values, but which did not significantly affect the accuracy. For liver assessment, this higher stiffness value range correlates with values associated with cirrhosis (F4) and is thus less clinically impactful. The results of this study will hopefully be helpful in ensuring optimal data collection for future larger-scale human studies using EUS-SWE and transabdominal SWE.
Supplementary Material
Supplementary Fig. 1. Differences in the reliability indicator measurements between transabdominal shear wave elastography (SWE) and endoscopic ultrasound SWE (EUS-SWE).
Supplementary Fig. 2. Correlation between the reliability indicator and accuracy of the measurements at varying stiffness values.
Supplementary materials related to this article can be found online at https://doi.org/10.5946/ce.2022.135.
Notes
Conflicts of Interest
Thomas J. Wang has no potential conflicts of interest. Marvin Ryou performs consulting work with Olympus America Inc., Boston Scientific, and Cook Medical.
REFERENCES
1. Gennisson JL, Deffieux T, Fink M, et al. Ultrasound elastography: principles and techniques. Diagn Interv Imaging. 2013; 94:487–495.
2. Sandrin L, Fourquet B, Hasquenoph JM, et al. Transient elastography: a new noninvasive method for assessment of hepatic fibrosis. Ultrasound Med Biol. 2003; 29:1705–1713.
3. Foucher J, Chanteloup E, Vergniol J, et al. Diagnosis of cirrhosis by transient elastography (FibroScan): a prospective study. Gut. 2006; 55:403–408.
4. Gallotti A, D’Onofrio M, Romanini L, et al. Acoustic radiation force impulse (ARFI) ultrasound imaging of solid focal liver lesions. Eur J Radiol. 2012; 81:451–455.
5. Bota S, Herkner H, Sporea I, et al. Meta-analysis: ARFI elastography versus transient elastography for the evaluation of liver fibrosis. Liver Int. 2013; 33:1138–1147.
6. Friedrich-Rust M, Ong MF, Herrmann E, et al. Real-time elastography for noninvasive assessment of liver fibrosis in chronic viral hepatitis. AJR Am J Roentgenol. 2007; 188:758–764.
7. Ferraioli G, Parekh P, Levitov AB, et al. Shear wave elastography for evaluation of liver fibrosis. J Ultrasound Med. 2014; 33:197–203.
8. Guibal A, Boularan C, Bruce M, et al. Evaluation of shearwave elastography for the characterisation of focal liver lesions on ultrasound. Eur Radiol. 2013; 23:1138–1149.
9. Loomba R, Wolfson T, Ang B, et al. Magnetic resonance elastography predicts advanced fibrosis in patients with nonalcoholic fatty liver disease: a prospective study. Hepatology. 2014; 60:1920–1928.
10. Kennedy P, Wagner M, Castéra L, et al. Quantitative elastography methods in liver disease: current evidence and future directions. Radiology. 2018; 286:738–763.
11. Friedrich-Rust M, Poynard T, Castera L. Critical comparison of elastography methods to assess chronic liver disease. Nat Rev Gastroenterol Hepatol. 2016; 13:402–411.
12. Kawada N, Tanaka S. Elastography for the pancreas: current status and future perspective. World J Gastroenterol. 2016; 22:3712–3724.
13. Sande JA, Verjee S, Vinayak S, et al. Ultrasound shear wave elastography and liver fibrosis: a prospective multicenter study. World J Hepatol. 2017; 9:38–47.
14. Sebag F, Vaillant-Lombard J, Berbis J, et al. Shear wave elastography: a new ultrasound imaging mode for the differential diagnosis of benign and malignant thyroid nodules. J Clin Endocrinol Metab. 2010; 95:5281–5288.
15. Evans A, Whelehan P, Thomson K, et al. Quantitative shear wave ultrasound elastography: initial experience in solid breast masses. Breast Cancer Res. 2010; 12:R104.
16. Bruce M, Kolokythas O, Ferraioli G, et al. Limitations and artifacts in shear-wave elastography of the liver. Biomed Eng Lett. 2017; 7:81–89.
17. Staugaard B, Christensen PB, Mössner B, et al. Feasibility of transient elastography versus real-time two-dimensional shear wave elastography in difficult-to-scan patients. Scand J Gastroenterol. 2016; 51:1354–1359.
18. Cassinotto C, Boursier J, de Lédinghen V, et al. Liver stiffness in nonalcoholic fatty liver disease: a comparison of supersonic shear imaging, FibroScan, and ARFI with liver biopsy. Hepatology. 2016; 63:1817–1827.
19. Herrmann E, de Lédinghen V, Cassinotto C, et al. Assessment of biopsy-proven liver fibrosis by two-dimensional shear wave elastography: an individual patient data-based meta-analysis. Hepatology. 2018; 67:260–272.
20. Jamialahmadi T, Nematy M, Jangjoo A, et al. Measurement of liver stiffness with 2D-shear wave elastography (2D-SWE) in bariatric surgery candidates reveals acceptable diagnostic yield compared to liver biopsy. Obes Surg. 2019; 29:2585–2592.
21. Ohno E, Hirooka Y, Kawashima H, et al. Feasibility of EUS-guided shear-wave measurement: a preliminary clinical study. Endosc Ultrasound. 2019; 8:215–216.
22. Ohno E, Hirooka Y, Kawashima H, et al. Feasibility and usefulness of endoscopic ultrasonography-guided shear-wave measurement for assessment of autoimmune pancreatitis activity: a prospective exploratory study. J Med Ultrason (2001). 2019; 46:425–433.
23. Yamashita Y, Tanioka K, Kawaji Y, et al. Endoscopic ultrasonography shear wave as a predictive factor of endocrine/exocrine dysfunction in chronic pancreatitis. J Gastroenterol Hepatol. 2021; 36:391–396.
24. Ohno E, Kawashima H, Ishikawa T, et al. Diagnostic performance of endoscopic ultrasonography-guided elastography for solid pancreatic lesions: shear-wave measurements versus strain elastography with histogram analysis. Dig Endosc. 2021; 33:629–638.
25. Yada N, Sakurai T, Minami T, et al. A newly developed shear wave elastography modality: with a unique reliability index. Oncology. 2015; 89 Suppl 2:53–59.
26. Wong GL, Wong VW, Chim AM, et al. Factors associated with unreliable liver stiffness measurement and its failure with transient elastography in the Chinese population. J Gastroenterol Hepatol. 2011; 26:300–305.
27. Xia B, Wang F, Friedrich-Rust M, et al. Feasibility and efficacy of transient elastography using the XL probe to diagnose liver fibrosis and cirrhosis: a meta-analysis. Medicine (Baltimore). 2018; 97:e11816.
28. Dhyani M, Grajo JR, Bhan AK, et al. Validation of shear wave elastography cutoff values on the supersonic aixplorer for practical clinical use in liver fibrosis staging. Ultrasound Med Biol. 2017; 43:1125–1133.
Fig. 1.
Visualization of the adjustable region of interest (ROI) parameters on transabdominal shear wave elastography (SWE) and endoscopic ultrasound SWE (EUS-SWE). E, stiffness value (kPa); Vs, velocity (used to calculate the stiffness value using the formula E=3Vs2ρ); ATT, attenuation coefficient (not analyzed in this study as it is only available for transabdominal SWE, not for EUS-SWE); VsN, reliability indicator.

Fig. 2.
Comparison of the changes in the region of interest (ROI) size (A), ROI depth (B), ROI orientation (C), and pressure exerted by the transducer probe (D) relative to the accuracy of the measurements on endoscopic ultrasound shear wave elastography. All measurements are reported as averages±standard errors. Significant p-values (p<0.05) for pairwise comparisons are shown. Non-significant differences are not shown.
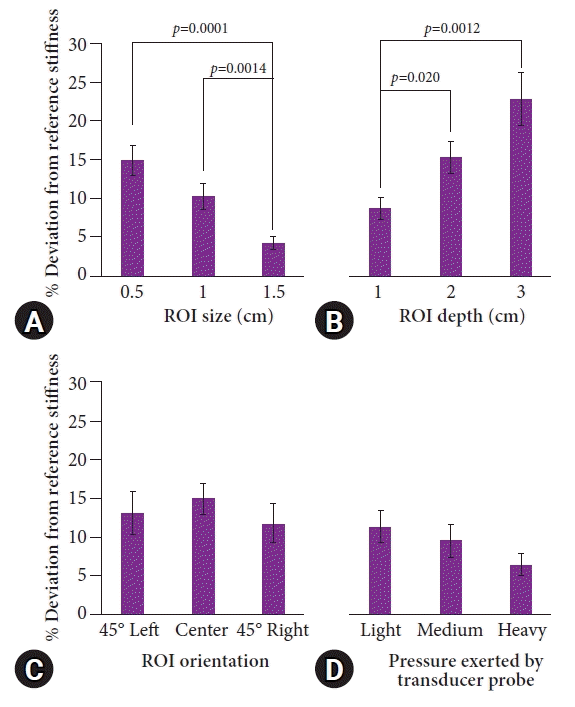
Fig. 3.
Comparison of the changes in the region of interest (ROI) depth relative to the accuracy of the measurements on transabdominal shear wave elastography. All measurements are reported as averages±standard errors. Bars highlighted in dark orange indicate significantly higher percentage deviations than do bars highlighted in light orange (p<0.05), with p-values from pairwise comparisons shown. The same color bars demonstrate no significant difference in the pairwise comparison.
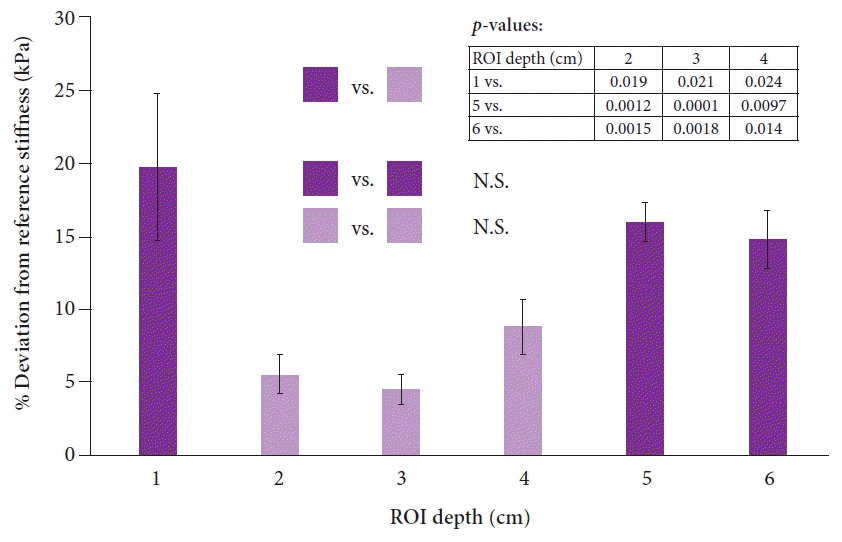
Fig. 4.
Comparison of the accuracy of the varying stiffness measurements between transabdominal shear wave elastography (SWE) and endoscopic ultrasound SWE (EUS-SWE). All measurements are reported as averages±standard errors. There were no significant differences among the pairwise comparisons between transabdominal SWE and EUS-SWE for all reference stiffness values (p>0.05) (p-values not shown).
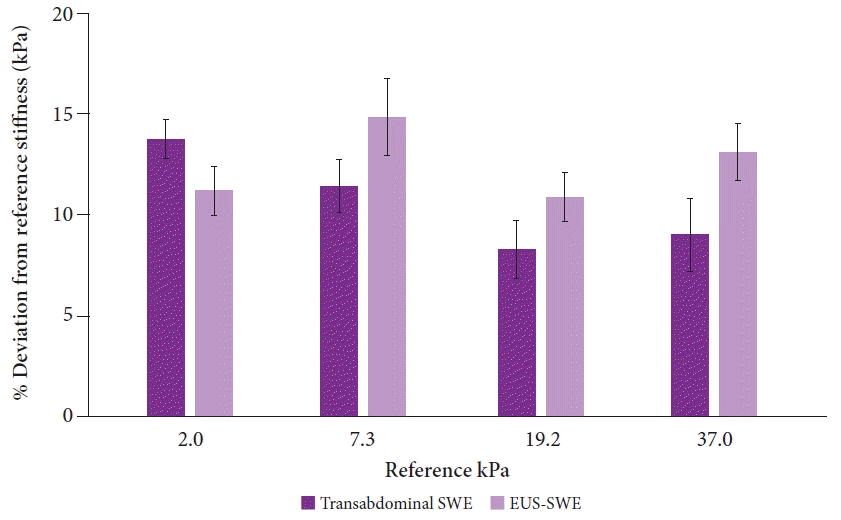
Fig. 5.
Assessment of the variability in the accuracy among the operators for transabdominal shear wave elastography (SWE) and endoscopic ultrasound SWE. All measurements are reported as averages±standard errors. Significant p-values (p<0.05) in the pairwise comparisons are displayed, while non-significant values are not shown. No pairwise comparisons among the operators were significant at 7.3 kPa ([A, B] for EUS and transabdominal SWE, respectively), whereas for 19.2 kPa ([C, D] for EUS and transabdominal SWE, respectively) there were some pairwise differences in % deviation between operators.
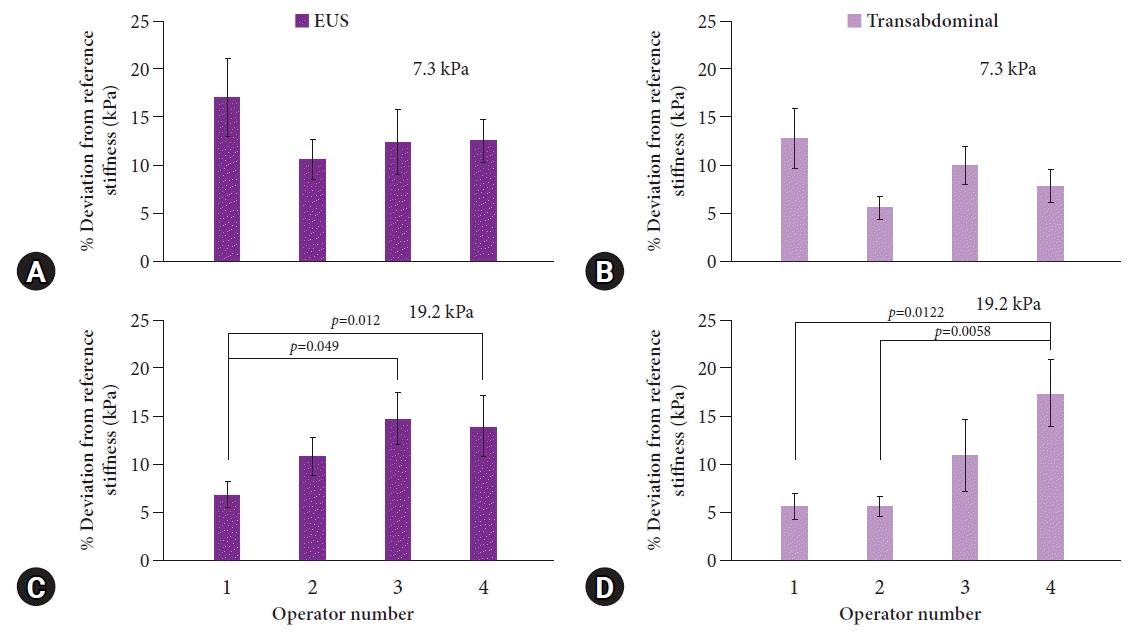
Fig. 6.
Accuracy of endoscopic ultrasound (EUS)-shear wave elastography in assessing smaller lesions of interest. t-test comparison between the region of interest (ROI) centered entirely within a lesion (bottom right ultrasound image) and ROI that included tissue outside the periphery of the lesion (top right ultrasound image). Significant differences (p<0.05) were observed.


 PDF
PDF Citation
 Print
Print


 XML Download