INTRODUCTION
METHODS
Study participants
Study design
Intervention/procedures
Feces collection and gut microbiome analysis
Bioinformatics analysis
Statistical analysis
RESULTS
Baseline characteristics
Table 1.
Values are presented as mean±standard deviation or number (%).
LMT1-48, Lactobacillus plantarum LMT1-48; BMI, body mass index; SBP, systolic blood pressure; DBP, diastolic blood pressure; HDL, high density lipoprotein; LDL, low density lipoprotein; AST, aspartate aminotransferase; ALT, alanine aminotransferase; eGFR, estimated glomerular filtration ratio.
Effects of LMT1-48 ingestion on anthropometric and biochemical parameters
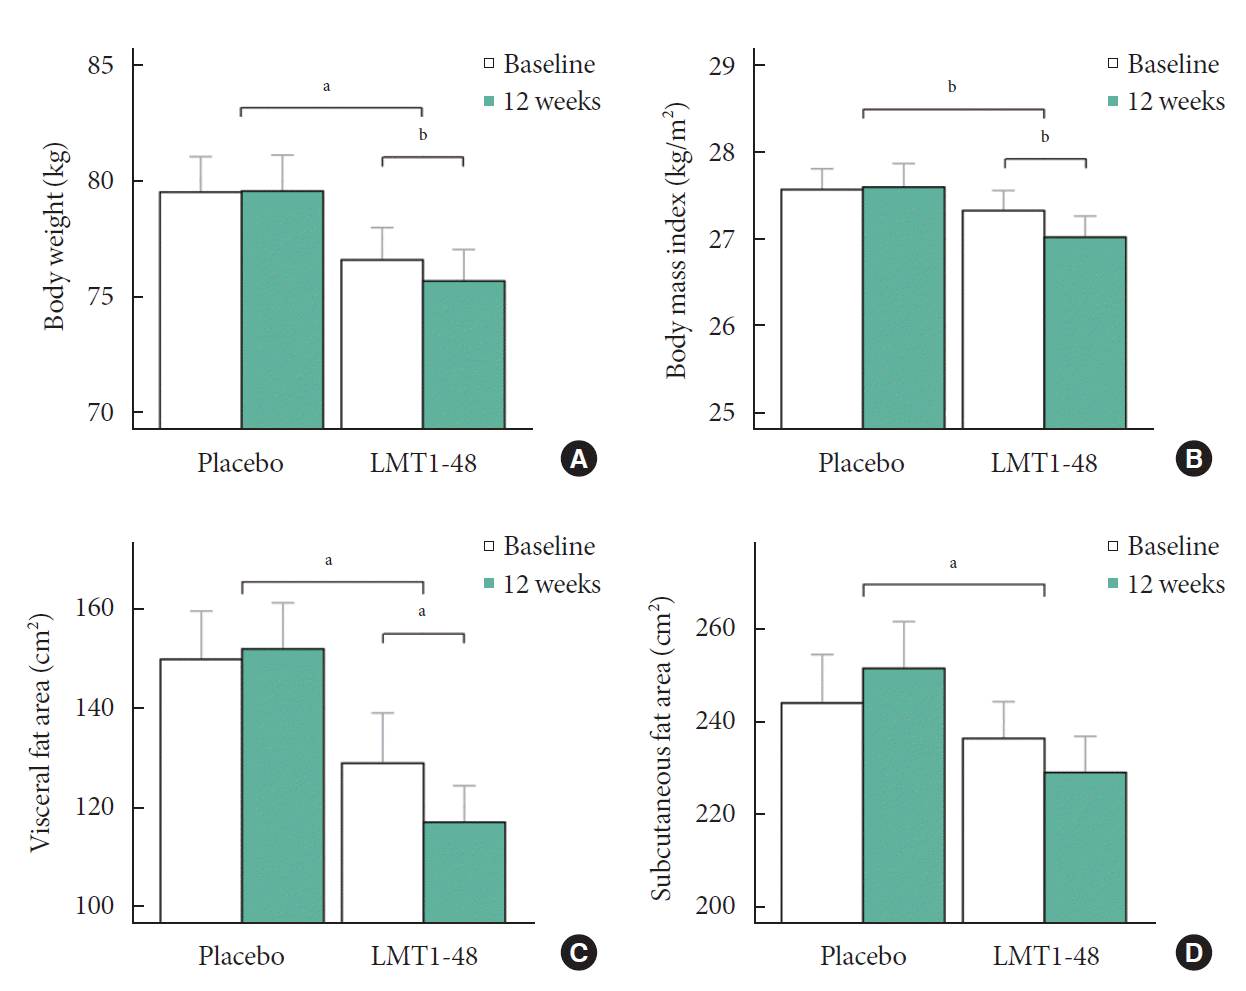
Fig. 1.

Table 2.
| Parameter | Group | Week 0 | Week 6a | P valueb | Week 12a | P valueb |
|---|---|---|---|---|---|---|
| Body weight, kg | LMT1-48 | 76.6±9.4 | 76.0±9.4c | 0.024 | 75.7±9.2c | 0.022 |
| Placebo | 79.5±9.6 | 79.6±9.8 | 79.6±9.7 | |||
| BMI, kg/m2 | LMT1-48 | 27.3±1.6 | 27.2±1.6c | 0.015 | 27.0±1.7c | 0.006 |
| Placebo | 27.6±1.5 | 27.6±1.6 | 27.6±1.7 | |||
| Waist circumference, cm | LMT1-48 | 92.1±6.5 | 91.8±6.7 | 0.034 | 91.3±6.2c | 0.005 |
| Placebo | 95.7±7.0 | 96.1±7.0 | 96.2±7.5 | |||
| Calorie intake, kcal | LMT1-48 | 1,802.9±429.6 | 1,704.4±498.1 | 0.126 | 1,600.9±515.9c | 0.969 |
| Placebo | 1,838.9±621.3 | 1,877.9±636.1 | 1,587.9±474.2c | |||
| SBP, mm Hg | LMT1-48 | 131.2±13.4 | 126.5±12.2c | 0.743 | 125.3±12.5c | 0.966 |
| Placebo | 133.7±12.1 | 128.4±11.0c | 127.9±11.1c | |||
| DBP, mm Hg | LMT1-48 | 79.1±11.4 | 78.2±10.9 | 0.423 | 78.0±11.8 | 0.341 |
| Placebo | 82.7±10.0 | 80.1±10.5c | 79.8±9.4c | |||
| Fasting glucose, mg/dL | LMT1-48 | 98.6±7.1 | 97.5±8.4 | 0.194 | 98.1±8.4 | 0.674 |
| Placebo | 98.7±9.4 | 100.0±10.4 | 100.4±15.2 | |||
| Total cholesterol, mg/dL | LMT1-48 | 208.9±33.2 | 205.3±33.8 | 0.224 | 208.0±38.6 | 0.831 |
| Placebo | 205.3±27.8 | 207.4±30.2 | 203.3±27.1 | |||
| Triglyceride, mg/dL | LMT1-48 | 153.3±97.1 | 148.4±110.7 | 0.606 | 132.7±80.3c | 0.246 |
| Placebo | 147.0±75.7 | 158.2±135.7 | 143.6±74.7 | |||
| HDL-cholesterol, mg/dL | LMT1-48 | 53.0±12.8 | 53.1±11.8 | 0.270 | 55.5±12.7 | 0.992 |
| Placebo | 51.4±13.2 | 52.6±13.2 | 52.6±13.9 | |||
| LDL-cholesterol, mg/dL | LMT1-48 | 132.8±25.9 | 129.7±25.4 | 0.716 | 131.6±30.1 | 0.806 |
| Placebo | 131.9±23.4 | 130.6±22.8 | 129.7±21.5 | |||
| AST, IU/L | LMT1-48 | 30.7±14.3 | 27.7±10.2c | 0.005 | 28.6±9.2 | 0.008 |
| Placebo | 28.7±13.5 | 30.0±12.9 | 33.1±17.6c | |||
| ALT, IU/L | LMT1-48 | 32.2±23.0 | 28.0±19.3 | 0.018 | 31.0±22.5 | 0.003 |
| Placebo | 31.0±24.7 | 34.8±32.6 | 42.2±39.3c | |||
| Creatinine, mg/dL | LMT1-48 | 0.76±0.15 | 0.75±0.15 | 0.243 | 0.78±0.17 | 0.437 |
| Placebo | 0.74±0.20 | 0.77±0.17 | 0.77±0.17 | |||
| eGFR, mL/min/1.73 m2 | LMT1-48 | 104.2±16.1 | 106.0±17.2 | 0.087 | 102.7±18.0 | 0.546 |
| Placebo | 107.6±24.0 | 104.6±21.2 | 105.7±22.1 |
Values are presented as mean±standard deviation. The analysis was based on data from the full analysis set (n=85).
BMI, body mass index; SBP, systolic blood pressure; DBP, diastolic blood pressure; HDL, high density lipoprotein; LDL, low density lipoprotein; AST, aspartate aminotransferase; ALT, alanine aminotransferase; eGFR, estimated glomerular filtration ratio.
a Differences within groups were evaluated using paired Student’s t-test or Wilcoxon’s signed-rank test according to the distribution of data,
Effects of LMT1-48 ingestion on body fat
Effects of LMT1-48 ingestion on obesity-related cytokines and hormones
Table 3.
| Parameter | Group | Week 0 | Week 12a | P valueb |
|---|---|---|---|---|
| Fasting insulin, μU/mL | LMT1-48 | 10.16±5.46 | 9.07±5.20d | 0.013 |
| Placebo | 9.09±4.69 | 10.02±5.77 | ||
| HOMA-IR | LMT1-48 | 2.5±1.4 | 2.2±1.2 | 0.014 |
| Placebo | 2.2±1.4 | 2.5±1.8 | ||
| Total GIP, pg/mL | LMT1-48 | 44.4±17.6 | 37.9±46.5d | 0.016 |
| Placebo | 34.3±15.3 | 32.3±16.0 | ||
| Total GLP-1, pM | LMT1-48 | 29.62±12.54 | 26.60±8.40 | 0.297 |
| Placebo | 27.83±14.78 | 25.71±9.99 | ||
| Glucagon, pg/mLc | LMT1-48 | 108.0±121.4 | 122.6±84.7d | 0.620 |
| Placebo | 102.6±82.6 | 143.5±117.5d | ||
| Free fatty acid, μmol/Lc | LMT1-48 | 507.5±173.7 | 585.3±231.3d | 0.231 |
| Placebo | 592.7±230.2 | 606.0±180.6 | ||
| Total ketone, μmol/Lc | LMT1-48 | 57.8±66.6 | 77.8±118.1 | 0.168 |
| Placebo | 62.1±52.5 | 71.1±84.1 | ||
| β-Hydroxybutyrate, μmol/Lc | LMT1-48 | 43.3±48.7 | 57.4±82.5 | 0.205 |
| Placebo | 44.6±38.5 | 52.0±68.6 | ||
| Adiponectin, μg/mL | LMT1-48 | 4.77±1.81 | 6.80±2.40d | 0.748 |
| Placebo | 4.14±1.80 | 6.15±2.55d | ||
| Leptin, ng/mLc | LMT1-48 | 10.37±8.44 | 9.31±7.12 | 0.034 |
| Placebo | 10.09±8.31 | 10.81±9.07 | ||
| hs-CRP, μmol/L | LMT1-48 | 0.11±0.16 | 0.16±0.40 | 0.671 |
| Placebo | 0.17±0.31 | 0.17±0.19 |
Values are presented as mean±standard deviation. The analysis was based on data from the full analysis set (n=85).
LMT1-48, Lactobacillus plantarum strain LMT1-48; HOMA-IR, homeostasis model assessment of insulin resistance; GIP, gastric inhibitory polypeptide; GLP-1, glucagon-like peptide-1; hs-CRP, high-sensitive C-reactive protein.
a Differences within groups were evaluated using paired Student’s t-test or Wilcoxon’s signed-rank test according to the distribution of data,
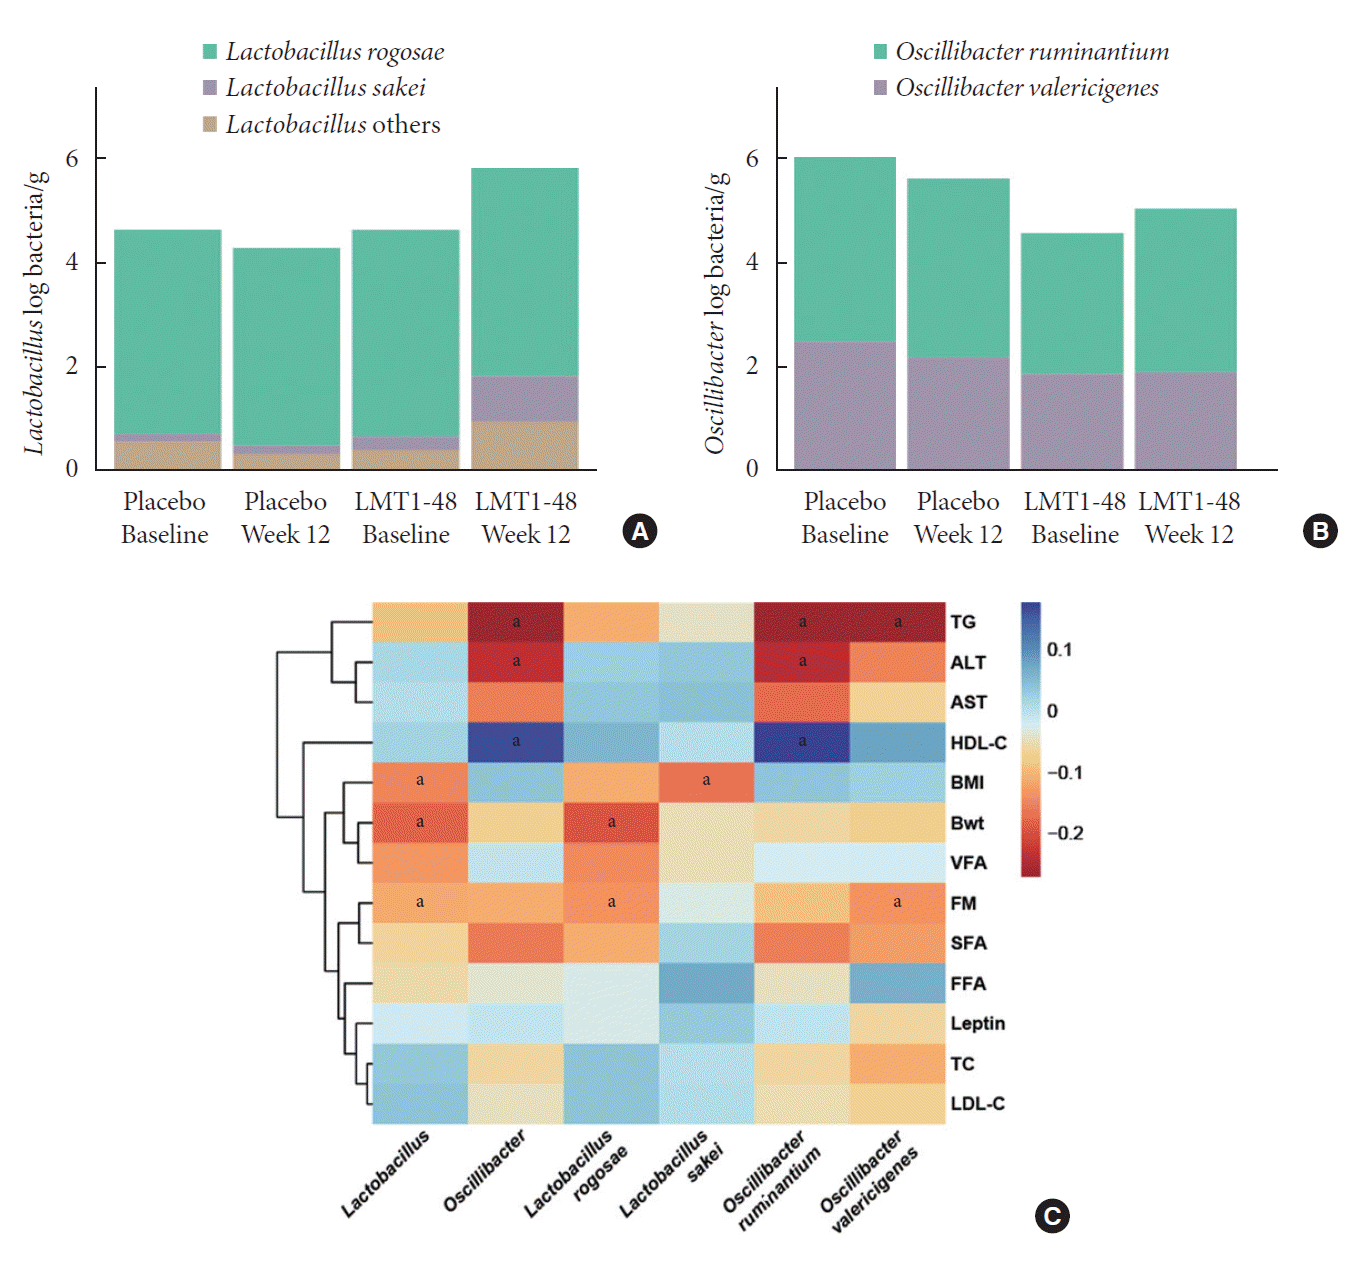
Effects of LMT1-48 ingestion on gut microbiota
Fig. 2.


 PDF
PDF Citation
 Print
Print


 XML Download