Background/rationale
One of the most challenging tasks in assessment in high-stakes examinations in higher education is accurately differentiating between competent and incompetent examinees. To address this challenge, a common practice is to employ a standard-setting process that determines a cut score for the entire examination, or parts of the examination if the assessment is composed of multiple independent sections [
1]. Among the plethora of standard-setting methods, the most commonly used are methods that employ panels of experts who systematically assess the examination and items. Such techniques include, but are not limited to, the most popular Angoff method and its variants, the Ebel method, the bookmark method, the item mapping method (a variant of the bookmark method), and the Hofstee method [
1,
2]. Despite their popularity, the Angoff and the modified Angoff methods have attracted some critique. It has been suggested that experts are vulnerable to judgment biases [
3,
4]. It has also been suggested that the Angoff method requires a minimum of 15 experts per panel to yield reliable cut scores [
2]. Moreover, the Angoff method is resource-heavy since it requires the panel to review and estimate the probability of each item being correctly answered by the minimally competent examinee, which commonly takes a few hours to complete [
1]. Some new and improved methods have been introduced over the past decades [
5-
8], each with its own strengths and weaknesses.
The most recently introduced method, the equal Z method (henceforth: EZ method, pronounced “easy method”) aimed to generate cut scores that are placed between the average minimum passing score and the averaged maximum failing score for the entire examination as determined by a panel of experts [
8]. The new feature presented in the EZ method is that its cut score is placed at the point set at the same distance from the minimum passing score and the maximum failing score, as measured by the respective z-scores around these 2 points. Although identical in terms of z-scores, they may be different in absolute values due to the different distribution of the scores around these 2 points. Evidence supporting the validity of the EZ method has already been presented [
8], yet no previous study has aimed to estimate the minimum number of experts required to sit on the panel to yield reliable cut scores.
The equal Z (EZ) method
The EZ method uses a panel of experts who work independently to assess the entire examination. In the case presented in this study, the examination consisted of 12 stations of an objective structured clinical examination (OSCE), a common high-stakes examination used in a range of health professions education and examination modes [
5,
9,
10]. In the EZ method, each expert separately provides answers to the following 2 questions: first, what would be the lowest score that indicates, without any doubt, that an examinee is competent in the topics assessed?; second, What would be the highest score that indicates, without any doubt, that an examinee is incompetent in the topics assessed?
These scores are then used to calculate the cut scores for each of the stations using the following procedure:
For each station, we define L as the highest failing score below which an examinee is incompetent; and we define H as the lowest passing score above which an examinee is competent. From the collated scores (L and H), the means of L and H (XL and XH, respectively) and standard errors of the means (SEL and SEH, respectively) are calculated.
Equation 1 is used to identify the same Z score (Z) that would apply to both confidence intervals of XL and XH when they interface:
Equation 1
Z*SEL+Z*SEH=XH−XL
From Equation 1, we extract Z using Equation 2:
Equation 2
Z=(XH−XL)/(SEL+SEH)
The cut score is then set at XL+Z*SEL, which is also equal to XH Z*SEH.
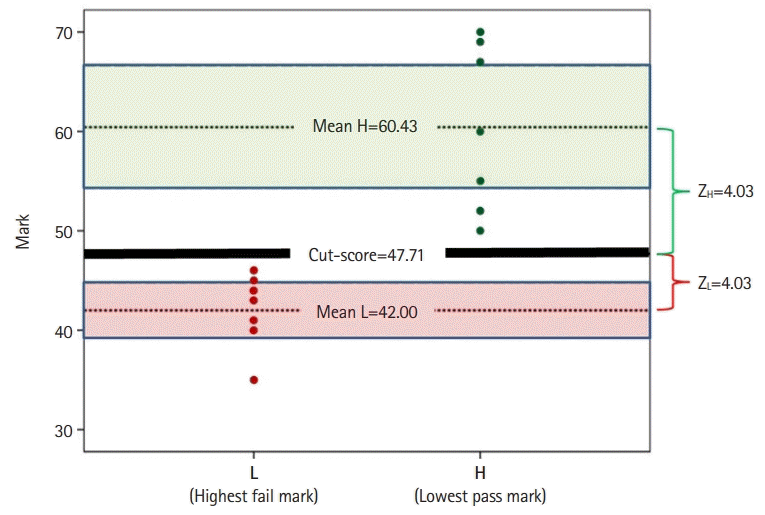
To illustrate how the EZ model works, data from a fictitious expert panel of 7 members are presented here: Each panelist provides the lowest pass mark “without any doubt” (H, green dots on the right,
Fig. 1) and the highest failure mark (L, red dots on the left,
Fig. 1). For each of the 7 H and L marks, the mean H (X
H) and mean L (X
L) were calculated (that is, 60.43 and 42.00, respectively). The standard errors for H (SE
H) and L (SE
L) were also calculated (8.34 and 3.74, respectively). Using the information of the 2 standard errors and means, equation 1 (Z*SE
L+Z*SE
H=X
H−X
L) is used to find Z, the point equidistant from the means. Extracting Z from equation 2 [Z=(X
H−X
L)/(SE
L+SE
H)=(60.43−42.00)/(3.74+8.34)] yields Z equal to 1.53. The cut score is then calculated using either X
H−1.53*SE
H or X
L+1.53*SE
L. Both result in a cut score of 47.71. This suggests, with a confidence of 93.70% (since Z=1.53), that the cut score (47.71) is neither a pass (i.e. <60.43) nor a fail (i.e. >42.00) (
Fig. 1).
Although the EZ method somewhat resembles the Hofstee method by being simple and light on resources, there are 2 main differences between the Hofstee and the EZ methods. First, the Hofstee method is a “compromise” method combining both norm- and criterion-referenced approaches, whereas the EZ method uses a criterion-referenced approach only. Second, the criterion-referenced questions asked in the 2 methods are significantly different. That is, the Hofstee method requires experts to estimate the highest and lowest acceptable percentage for correct and incorrect cut scores. Note that “acceptability” requires the experts to consider others’ perceptions. The EZ method, on the other hand, requires the experts to indicate “without any doubt” the highest failure marks and the lowest pass marks for the examination. The EZ method does not ask the experts to estimate any perceptions other than their own.
Previous studies have demonstrated that the EZ method requires experts to spend about 1 hour assessing 12 OSCE stations (equivalent to assessing an examination with 12 sections on different topics; each includes about 10–15 items, which equates to an examination comprising 120–180 items); and it yielded cut scores with high statistical confidence [
7,
8]. Nonetheless, the unanswered question relates to the minimum number of experts required to yield reliable and acceptable cut scores. It has already been suggested that for the Angoff method, a panel of at least 15 experts is required to obtain reliable and trustworthy cut scores [
2]. If a smaller panel of experts can be shown to produce reliable cut scores using the EZ method, then the EZ method might be a more convenient, cost-effective, and acceptable solution for reliably setting examinations’ cut scores.


 PDF
PDF Citation
 Print
Print


 XML Download