

 PDF
PDF Citation
 Print
Print


INTRODUCTION
Breast cancer is the most commonly diagnosed cancer (24.2% of the total cases), and in 2018, was the leading cause of cancer death (15.0% of the total cancer deaths) among women worldwide [1]. In Korea, the age-standardized incidence of breast cancer increased consistently from 1999 to 2015 and became the second most common cancer in women (49.2 cases/100,000) in 2015 [2]. The 5-year relative survival rate for breast cancer has improved continuously and exceeded 90% in 2011-2015 [2], and thus, the number of breast cancer survivors in Korea is expected to increase in coming years. Furthermore, there is growing interest in the potential effects of dietary and lifestyle factors on the prognoses of breast cancer survivors.
The roles of dietary factors on breast cancer prevention have long been studied [345]. According to the report issued by the Continuous Update Project of the World Cancer Research Fund, consuming non-starchy vegetables, foods containing carotenoids, and a diet high in calcium might decrease the risk of breast cancer, whereas alcohol consumption increases its risk [3]. In contrast, far fewer studies have assessed associations between diet and cancer recurrence or survival [6], partly because of the need for investigations on dietary changes after diagnosis and key clinical features (e.g., disease stages) in survivors. Thus, collecting accurate dietary information using instruments specifically designed for the survivors of breast cancer is essential for nutritional epidemiological studies that investigate relationships between dietary factors and disease development after diagnosis [78].
Food frequency questionnaires (FFQs), which are usually composed of food lists, consumption frequencies, and single or multiple categories of portion sizes, are the tools commonly used to assess dietary intakes in nutritional epidemiological studies [9]. FFQs can provide estimates of long-term intakes in a relatively cost-effective manner but are less detailed than open-ended methods such as dietary records (DRs) or 24-hour recall (24HDRs) methods [10]. FFQs are usually developed with and validated against DRs or 24HDRs in a target population. To address this issue, we developed an FFQ specifically for Korean breast cancer survivors, which included 123 foods and dishes [11]. In the present study, to assess the validity and reproducibility of this FFQ, we compared nutrient intakes as determined using the FFQ with more detailed estimates obtained using three 3-day DRs over an extended period and with the estimates obtained using the repeated FFQ among breast cancer survivors.
Go to : 
SUBJECTS AND METHODS
Study population
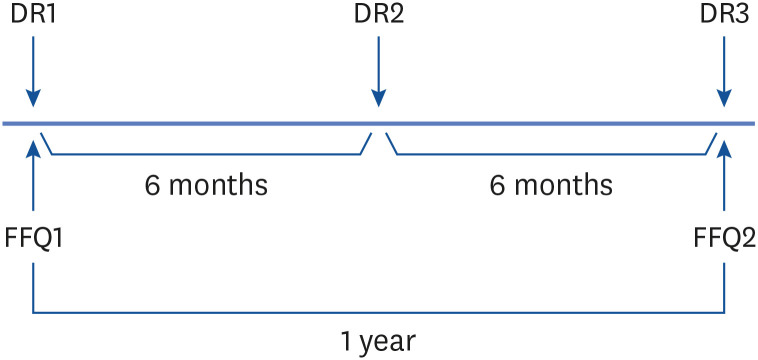
Breast cancer survivors were recruited from KonKuk University Medical Center from June 2016 to November 2017. A total of 150 breast cancer survivors participated in the study and were asked to complete the first FFQ assessment and the first 3-day DR. These participants were then contacted 6 and 12 months later and asked to complete the second and third 3-day DRs, respectively. FFQs and 3-day DRs returned more than six months after previous assessments were also accepted for analysis. Average time between first and second FFQ returns was 10.2 months. However, of the 150 participants, 28 dropped out during the first assessment, 17 after completing the first assessment, and 4 did not complete the third assessment. Two women who reported implausible energy intakes (mean of two FFQs was > 3,500 kcal/day) were also excluded. Accordingly, the data of 99 participants that completed the two FFQ assessments and the three 3-day DRs were included in the analysis (Figure 1). These breast cancer survivors had a mean age of 53.3 yrs (SD, 7.7), and the median time from diagnosis to study commencement was 48.6 months (interquartile range, 22.2, 78.0). The Institutional Review Board at Konkuk University Medical Center approved the study protocol (KUH 1020068), and all participants provided written informed consent.
FFQ and DRs
The developed FFQ for breast cancer survivors in Korea included 123 food items, and requested participants to provide details of the frequencies and portion sizes of food items consumed over the previous year. Detailed information regarding the development of the FFQ is described elsewhere [11].
DRs were used as reference standards to assess the validity of the FFQ. Participants were asked to complete three 3-day DRs (two weekdays and one weekend day), and thus, DRs for 9 days in one year were collected to represent usual intakes. Trained dietitians provided participants with detailed instructions on the DR form regarding the recording of all consumed foods and beverages at first assessment. Food photograph booklets were also given to participants to aid estimations of food portion sizes. Trained dietitians collected and reviewed the completed DRs and recorded nutrient intakes using the Computer-Aided Nutritional Analysis Program version 4.0 (The Korean Nutrition Society, Seoul, Korea); a nutrient software package that uses the Korean Nutrition Society nutrient database [12]. Nutrient intakes for foods not included in the database were obtained from the Korea Ministry of Food and Drug Safety and Korea Rural Development Administration database [1314].
Statistical analysis
Energy and 14 nutrient intakes (carbohydrate, fat, protein, fiber, calcium, phosphorous, iron, vitamin A, thiamine, riboflavin, niacin, vitamin C, sodium, and potassium) were assessed using the two FFQ assessments and the three 3-day DRs. The nutrients assessed in this study were those included in the KNHANES 2012 study. In addition, dietary fiber consumption was also assessed. Daily nutrient intakes as determined using the FFQ were calculated by summing nutrient intakes of items in the FFQ and were computed from reported consumption frequencies and portion sizes. For DRs, daily nutrient intakes per day were calculated by summation for all recorded foods. Nutrient intakes from dietary supplements were not considered in the analysis.
The validity of the FFQ was evaluated by comparing estimated nutrient intakes estimated with average 3-day DR estimates using Pearson’s correlation coefficients. Correlations were estimated using log-transformed intakes (crude) and energy-adjusted intakes using the residual method [15]. Also, observed correlation coefficients were corrected for within person variations, using the following equation:
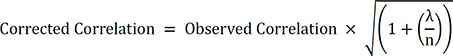
where λ is a ratio of within- and between-person variation and n is the number of repeated DR measurements [16]. We used an n value of 8.95, that is, the mean of the number of repeated measurements.
FFQ reproducibility was evaluated by comparing estimated nutrient intakes during the first and second administrations using Pearson’s correlation coefficients. Crude and energy-adjusted correlation coefficients were calculated. In addition, the cross-classification analysis was performed to measure the degree of agreement between quartiles of the first and second assessments, percentage correctly classified in the exact, adjacent (deviation by one quartile), misclassification (deviation by two quartiles), and extreme (first and fourth quartile) quartiles, as previously described [1718]. In addition, we assessed agreement between FFQ and three 3-day DR responses. Differences were plotted against means, as suggested by Bland and Altman [19]. Results were considered statistically significant for two-sided P-values of < 0.05. The analysis was performed using SAS version 9.4 (SAS Institute, Cary, NC, USA).
Go to :
RESULTS
Mean daily nutrient intakes calculated from first and second FFQ assessments and three 3-day DRs are presented in Table 1. Mean daily intakes of energy and carbohydrate were lower when assessed using DRs than the mean intakes from two FFQ assessments, whereas fat intakes were higher for DRs. Protein intakes were similar for DRs and for the mean intakes from two FFQ assessments. Intakes of fiber, calcium, iron, vitamin A, and sodium were higher for DRs than the mean intakes from both FFQ assessments, but intakes of the remaining nutrients were lower for DRs. Energy and 14 nutrients intakes were higher for the first FFQ assessments than the second.
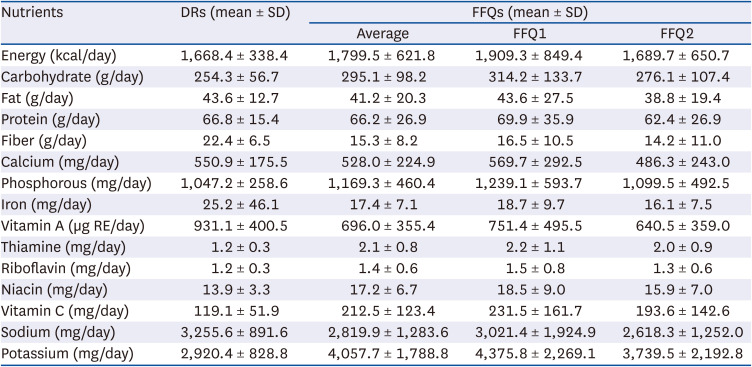
Table 1
Mean daily nutrient intakes as determined by three 3-day dietary records and the food frequency questionnaire
DR, dietary record; FFQ, food frequency questionnaire; SD, standard deviation; FFQ1, the first food frequency questionnaire assessment; FFQ2, the second food frequency questionnaire assessment; RE, retinol equivalent.
![]()
Correlation coefficients between mean daily nutrient intakes as determined using DRs and FFQ assessments are shown in Table 2. The statistically significant crude correlation coefficients between the DRs and the first FFQ ranged from 0.21 (energy) to 0.49 (calcium) (median value = 0.35); significant energy-adjusted correlation coefficients ranged from 0.25 (protein) to 0.42 (carbohydrate and potassium) (median value = 0.31); significant energy-adjusted de-attenuated correlation coefficients ranged from 0.29 (protein) to 0.47 (fat) (median value = 0.36). Iron and sodium as determined by DRs and FFQ assessments were not significantly correlated, but energy-adjusted de-attenuated correlation coefficients were 0.04 for iron and 0.09 for sodium. Crude correlation coefficients between DRs and second FFQ assessments varied from 0.23 (sodium) to 0.56 (calcium) (median value = 0.35); significant energy-adjusted correlation coefficients ranged from 0.17 (riboflavin) to 0.47 (calcium) (median value = 0.33); significant energy-adjusted de-attenuated correlation coefficients ranged from 0.20 (riboflavin) to 0.53 (calcium) (median value = 0.37). Iron, vitamin A, and sodium as determined by DRs and second FFQ assessments were not significantly correlated, energy-adjusted de-attenuated correlation coefficients ranged from 0.05 to 0.12.
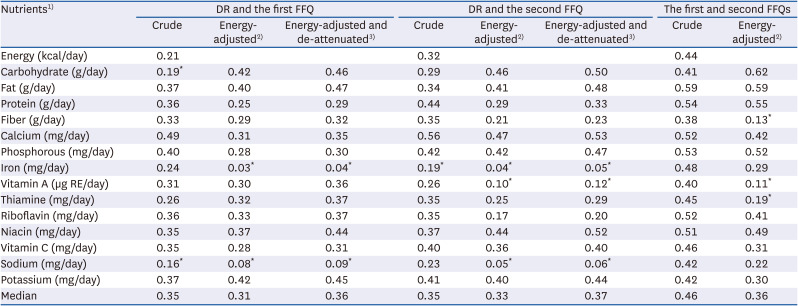
Table 2
Pearson correlation coefficients between nutrient intakes as determined by three 3-day dietary records and at the first and second food frequency questionnaire assessments
DR, dietary record; FFQ, food frequency questionnaire; RE, retinol equivalent.
1)Nutrient intakes were log-transformed.
2)Energy intakes were adjusted using the residual method.
3)Observed correlation coefficients were corrected for within-person variation.
*P ≥ 0.05, otherwise P < 0.05.
![]()
To test the reproducibility of the FFQ, we examined correlation coefficients between nutrient intakes as determined using the first and second FFQ assessments (Table 2). Statistically significant crude correlation coefficients ranged from 0.38 (fiber) to 0.59 (fat). Significant correlation coefficients for energy-adjusted nutrients ranged from 0.22 (sodium) to 0.62 (carbohydrate), and energy-adjusted correlation coefficients ranged from 0.11 (vitamin A) to 0.19 (thiamine), which were not significant. The median correlation coefficient for reproducibility was 0.46 for unadjusted nutrients intakes and 0.36 for energy-adjusted nutrients intakes. We also measured percent agreements between the first and second FFQ assessments (Table 3). The percentage classification for exact agreement for unadjusted nutrients ranged between 28.3% (calcium) and 44.4% (phosphorous), and the percentage classification for the extreme quartiles was < 10% for all nutrients. The percentage classification for exact agreement for energy-adjusted nutrients ranged between 27.3% (sodium) and 45.5% (fat), and the percentage classification for extreme agreement for most nutrients was < 10% except for sodium (10.1%) and thiamine (11.1%). A median of 79.8% of participants were included in the exact or adjacent classification for all unadjusted nutrients intakes, and a median of 76.8% of participants were included in the exact or adjacent classification for all energy-adjusted nutrient intakes.
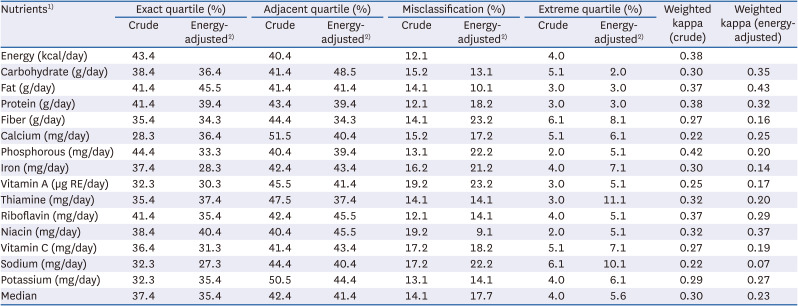
Table 3
Concordance (%) between quartiles of the first and second food frequency questionnaire assessments
![]()
Bland–Atman plots sowed that most data points fell within limits of agreement for three micronutrients, calcium, vitamin A and vitamin C (Figures 2 and 3). However, nutritional intakes were both over- and underestimated by the FFQ as compared with the DRs. Overall, nutrient intakes as determined by both FFQ assessments were higher than those determined by DRs among participants with high intakes but lower among those with low intakes.
 | Fig. 2Bland-Altman plots showing relationships between differences in daily intakes of breast cancer survivors (n = 99) for (A) carbohydrate, (B) fat, (C) protein, (D) calcium, (E) vitamin A, and (F) vitamin C as determined by three 3-day dietary records and the first FFQ assessment. The solid lines represent mean differences between DRs and the FFQ, whereas the dashed lines represent two standard deviations about mean differences (limit of agreement).DR, dietary records; FFQ1, the first food frequency questionnaire assessment; FFQ, food frequency questionnaire.
|
 | Fig. 3Bland-Altman plots showing relationships between differences in daily intakes of breast cancer survivors (n = 99) for (A) carbohydrate, (B) fat, (C) protein, (D) calcium, (E) vitamin A, and (F) vitamin C as determined by the three 3-day dietary records and the second FFQ assessment. The solid lines represent average differences between DRs and the FFQ, represent two standard deviations about mean differences (limit of agreement).DR, dietary records; FFQ2, the second food frequency questionnaire assessment; FFQ, food frequency questionnaire.
|
Go to :
DISCUSSION
In the present study, a newly developed FFQ devised for breast cancer survivors was found to have acceptable validity and reproducibility for the assessment of usual nutrient intakes. We compared nutrient intakes as determined by FFQ assessments with those measured by three 3-day DRs among breast cancer survivors. The median values of correlation coefficients, adjusted for energy and corrected for within-person variation, for the first and second FFQ assessments were 0.36 and 0.37, respectively, indicating moderate validity. We also found acceptable reproducibility between the two FFQ assessments performed with an interval of one-year (median correlation coefficients for all nutrients = 0.36).
The three 3-day DR and both FFQ assessments were conducted on 99 breast cancer survivors. Our sample size was not largely different from the sizes as recommended, that is, reasonable size seems to be about 100 to 200 persons [10]. Dietary assessments performed on multiple days over four seasons may have had advantages over FFQ assessments [20]. In this study, three 3-day DRs provided consumptions of various dishes and seasonal foods and appeared to provide a reasonable means of collecting intake data.
The energy and carbohydrate intakes as assessed by the FFQ were higher than those assessed by DRs, and higher carbohydrate intakes were considered to contribute to the higher energy intakes obtained using the FFQ. Similar results were observed in the Korean Genome and Epidemiologic Study (KoGES), in which the authors explained that overestimation of carbohydrate intake might have been due to grains and noodles, which are staple foods of Korea and were included among FFQ items [18]. The higher energy intakes provided by the FFQ may also have been due to over-reporting of fruit consumption, as the participants were breast cancer survivors who were motivated to consume healthy foods, and this may have led to over-reporting [21]. Average fruit intake (g/day) in this study as assessed by the FFQ was 480.07 g, which was more than twice the 229.83 g determined using the three 3-day DRs.
The correlations found between the FFQ and DRs were comparable to those of other studies conducted on the general Korean population [1822232425]. For example, a validation study of a dish-based, semi-quantitative FFQ on the diet of 288 Korean adults aged ≥ 30 yrs reported a median Spearman’s correlation coefficient between nutrient intakes as assessed using a semi-quantitative FFQ and DRs of 0.31 [23]. Another validation study conducted on 126 Korean adults aged 20–65 yrs conducted on a FFQ for the Korean National Health and Nutrition Examination Survey (KNHANES) reported a mean correlation coefficient for validity of 0.40 between the FFQ and a DR for all nutrients [24]. In addition, according to the reviews of 227 validation studies conducted in 30 different countries (primarily in the United States), median values of correlations between FFQs and reference methods, such as DRs and 24HDRs, for energy, total fat, vitamin C, vitamin A, calcium, and iron were 0.46, 0.51, 0.50, 0.37, 0.56, and 0.47, respectively [2627]. The reason for the slightly lower correlation coefficients observed in Korea than in Western countries may be related to servings and cooking and eating methods. Korean meals are typically composed of a bowl of cooked rice, a soup, and multiple side dishes, and these side dishes are often shared, which makes it difficult for participants to answer questions on the frequency of consumption, portion size, or the compositions of specific food items.
Adjustment for energy in nutrient intakes has been suggested to correct measurement errors [19]. Given that estimating food proportions is easier than estimating the absolute amounts of foods consumed, correlations with reference measurements are usually higher after adjusting for energy intakes [19]. After adjustment, we found correlation coefficients increased for carbohydrate and fat but reduced for protein. Also, correlation coefficients of energy-adjusted iron, vitamin A and sodium intakes were reduced substantially after adjustment to become non-significant, which indicates the effect of energy adjustment depends on nutrient type [2829]. Relatively few food sources might explain the low correlations observed for iron and vitamin A. The ranking of those nutrients among individuals might not be well achieved after removing the effect of energy intake when estimating correlations.
The reproducibility of the FFQ as determined using correlation coefficients between first and second assessments and percent agreement was acceptable with a 0.46 median correlation coefficient for unadjusted nutrient intakes, 0.36 for energy-adjusted nutrients, and > 35.4 for the mean percentage of participants included in the exact classification of energy-adjusted nutrients. The reproducibility of the FFQ was comparable with that of KoGES, in which the median correlation coefficient between assessments conducted one year apart was 0.45 for unadjusted nutrient intakes [18]. The overall validity of the FFQ for most nutrients was higher for the second FFQ assessment than the first possibly because participants were more familiar with the task of estimating usual food intakes during the second assessment [30].
Our study has several limitations that should be considered. First, both the DR and FFQ methods may have correlated measurement errors compared to other methods that use biomarkers such as doubly labeled water, urinary nitrogen, and nutrient plasma concentration [3132]. Second, sampling for this study was conducted at one hospital, which limits the generalizabilities of our findings to all Korean breast cancer survivors. However, the hospital involved was a large hospital, and the FFQ was developed based on open-ended dietary data obtained at other hospitals from breast cancer survivors. Third, the year between FFQ assessments may appear arbitrary, but many previous studies on FFQ reproducibilities have been conducted using a 1-year interval [171820].
In conclusion, the 123-item FFQ developed for breast cancer survivors was found to have acceptable reproducibility and validity. Our study suggests that this FFQ could be used to rank total energy and nutrient intakes in large-scale studies on Korean breast cancer survivors. However, a multicenter study on breast cancer survivors is needed to confirm the reproducibility and validity of the developed FFQ.
Go to :
 XML Download