

 PDF
PDF Citation
 Print
Print


INTRODUCTION
Obesity in children is one of the most common health issues in Western countries. Obese children have a higher risk of becoming obese as they become older than children with a normal body weight [1]. As a result, in order to prevent obesity and create treatment options, it is necessary to identify variables that influence these circumstances. Many factors that may contribute to childhood obesity have been identified via scientific studies. “Dysfunctional eating behavior” is one of them [2].
Dysfunctional eating behavior is included in the Diagnostic and Statistical Manual of Mental Disorders V (DSM-V) classification. Conditions in which the symptoms of feeding and eating disorders that cause significant distress in the individual are dominant, but they do not fully meet the diagnostic criteria for the diagnosis of any of the nutritional and eating disorders diagnostic cluster are evaluated in this category [3]. Emotional eating, restrained eating, and external eating are the three models of disfunctional eating behavior. Emotional eating is a psychosomatic disorder that involves eating to reduce stress in reaction to negative emotions while disregarding internal physiological cues such as hunger and satiety [45]. Emotional eating is when a person eats in response to their feelings. External eating is described as the tendency to overeat as a result of physiological hunger or satiety signals, as well as sensations like the appearance and smell of food, or external influences like other people's consumption [6]. Restriction theory, which was first established in 1975 by Herman and Mack [7], covers restrained eating. It is the deliberate suppression of physiological hunger with the worry of preventing probable body weight increase or attempting to maintain body weight, followed by overeating as a result of depression and anxiety, and finally the diet is disturbed, resulting in overeating [7].
There are several scales that evaluate eating behavior in children. “The children’s eating behavior inventory” was published in 1991 by Archer et al. [8] is a 40-item questionnaire based on parent reports. “Children’s Eating Behavior Questionnaire” developed Wardle et al. [9], is a 35-item questionnaire answered by parents. The DEBQ questionnaire [10], however the majority of the nine-year-old children did not completely grasp the questions. This survey was modified for boys and girls aged 7 to 12 years by van Strien and Oosterveld [11], Dutch Eating Behaviour Questionnaire Children (DEBQ-C). According to the children’s reading levels, they reduced the answers into three potential alternatives (“no,” “sometimes,” and “yes”). The questionnaire's final form comprises 20 questions (7 measuring emotional eating, 6 measuring external eating, and 7 restrained eating).
The DEBQ-C, on the other hand, is a scale that can be used by health professionals and researchers in the management of childhood obesity because it can be filled by children aged 7 to 12 both by themselves and because children’s attention spans are short. As a result, the goal of this study is to determine the validity and reliability of the DEBQ-C version in Turkey.
MATERIALS AND METHODS
Participants
This study was conducted on 440 children who were students at elementary school at two different socioeconomic levels in Istanbul in an age interval of 7–12 years. The sample size for the study was determined according to the factor analysis necessity. The sample size is closely related to the number of expressions included in the research questionnaire. It is suggested that the ratio of the number of participants to the number of items in the scale should be between 5 and 10 in order to perform factor analysis [12].
Since the scale consists of 20 questions, the scale was applied to 450 children. However, 10 children were excluded from the study because their families could not be reached and their anthropometric measurements and demographic data could not be obtained. Thus, the study was completed with 440 people. According to the test-retest method, each participant must fill in the questionnaire twice. Due to the absence of 5 participants in the second stage of data collection, the number of participants decreased to 163.
Participants were given parental consent and assent forms to read prior to the collection of any information. It is declared that they could leave the research whenever they wanted. The present study was approved by the Human Research Ethics Committee at the Bilgi University code of ethics 2020-20016-25 (Istanbul, Turkey). The scale of 20 questions for children was carried out by the researcher by asking the questions face to face to children. Children’s information such as gender, age, height and body weight were collected through telephone conversations with the families of the children.
Instrument
Dutch Eating behavior questionnaire for children that was adopted from adult version of Dutch Eating Behaviour Questionnaire (DEBQ) [11] evaluates overeating tendencies, emotional, external and restrained tendencies in pediatric populations. These 2 scales are a 20-question scale applied to the child and family, evaluated with a 5-point Likert scale. There is “emotional eating,” which included 7 questions (numbered 2, 3, 9, 12, 15, 17, and 19), “restrained eating,” which included 7 items (numbered 4, 6, 8, 11, 14, 16, and 18), and “external eating,” including 6 items (numbered 1, 5, 7, 10, 13, and 20).
Turkish adaptation protocol
Translation
DEBQ-C likert scales are composed of 3 components being emotional eating, restrained eating and external eating.
Both scales were translated by five bilingual specialists from English (original language) to Turkish (target language). The translation techniques followed a standardized procedure suggested by Brislin [13].
Back translation
The scale, which was translated into Turkish, was translated back into English by three different bilingual experts. The consistency between the scale translated into English and the original English version of the scale was examined. These inconsistencies were removed in a further translation and the back-translation comparison process was repeated until the versions were identical, The reviewers affirmed that the items from the translated instrument were satisfactory in representing the items from the original English version. The scale, which was translated into The final Turkish version of the DEBQ-C was applied to 58 parents with a preliminary study and it was asked to evaluate the clarity of the questions.
Statistical analysis
Number Cruncher Statistical System (NCSS, Kaysville, UT, USA) program was used for statistical analysis. Descriptive statistical methods (mean, standard deviation, median, frequency, ratio, minimum, maximum) were used while evaluating the study data. Exploratory (explanatory) Factor Analysis was used in the development of the Dutch eating behavior mother and child form scale for children, and reliability analysis and confirmatory factor analysis (CFA) (AMOS software; IBM Corp., Armonk, NY, USA) were used in the validity and reliability evaluations. Pearson correlation analysis was used to evaluate the relationship between test-retest results of the scale.
RESULTS
Participant characteristics
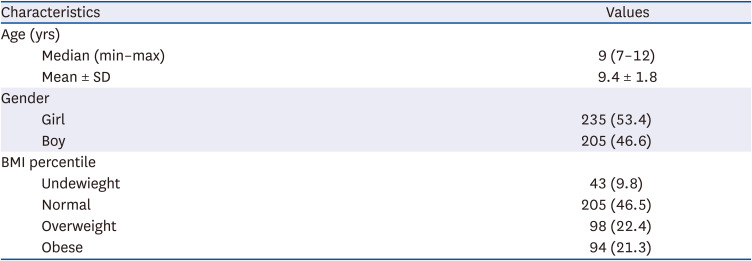
Table 1 summarizes the characteristics of participants. 235 (53.4%) of the 440 preadolescent children aged 7–12 years included in the study, were girls and 205 (46.6%) were boys. Body mass index (BMI) was calculated and converted to BMI z-scores (BMIz) based upon the World Health Organisation (WHO) reference [14]. The 9.8% of children were underweight, 46.5% had normal BMI, 22.4% were overweight and 21.3% were obese.
Validation
Dimensionality
The rotated factor loadings are shown in Tables 2 and 3. Principal component extraction with varimax rotation was used to conduct a factor analysis. The Kaiser-Meyer-Olkin (KMO) value of 0.85, as well as the result of Bartlett’s sphericity test (×2 = 2,941.907; P = 0.000), suggested that the model was suitable for factor analysis [15]. The original DEBQ-theoretical C’s dimensions were confirmed; the analysis revealed the presence of 3 factors that explained 50.39% of the variance (Table 2).
Table 2
Factor analysis results of DEBQ-C form
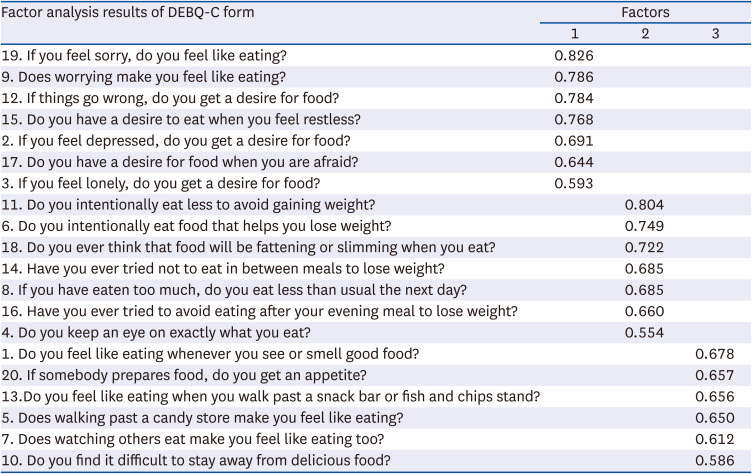
Table 3
Distribution of internal consistency values for DEBQ-C form
According to the authors of the questionnaire, the best answer from the major components analysis of the 20 questions of the DEBQ-C indicated three factors corresponding to the 3 subscales (F1: Emotional eating; F2: Restraint eating; F3: External eating). The first factor, which accounts for 19.868 percent of the total variation, combines the 7 items of the DEBQ-emotional C’s eating subscale. The second factor accounts for 37.257% of the overall variation and groups the other 7 items from the DEBQ-eating C’s for restraint eating subscale. The third factor accounts for 50.399% of the overall variance and groups the other 6 items from the DEBQ-external C’s etaing subscale. Factor 1 has the lowest 0.593 and the highest 0.826 factor weights, Factor 2 has the lowest 0.554 and the highest 0.804 factor weights, and Factor 3 has the lowest 0.586 and the highest 0.678 factor weights (Table 2). The findings provide the factorial integrity of the 20-item DEBQ-C, which represents a 3-factor model in a sample of Turkish children and is in line with van Strien and Oosterveld’s findings [11].
CFA
On our sample, CFA was used to validate the model fit using the 20-item DEBQ-C. Multiple goodness-of-fit indices were employed to measure model fit, as previously reported. The finished model (Fig. 1) demonstrated satisfactory fit for the model with the fit indices for DEBQ-C (×2/degree of freedom = 1.96; root mean square error of approximation = 0.047; comparative fit index = 0.95; goodness of fit index = 0.93) after evaluation of the modification indices and allowing the distinct variances of two pairs of items within emotional eating to correlate. The numbers on this scale demonstrate the DEBQ-C’s acceptance and application in Turkish.

Reliability
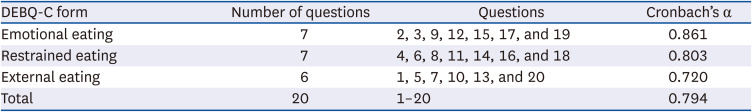
Cronbach’s α coefficients were computed independently for the whole scale and three subscales. As indicated in Table 3, the α values for the overall scale (20 items), emotional (7 items), restrained (7 items), and external (6 items) eating subscales for DEBQ-C were 0.861, 0.803, 0.720, and 0.794, respectively, above the minimum threshold of 70 for internal consistency [16].
The DEBQ-C homogeneity criteria were met by all three subscales. The corrected item-total subscale correlations for the majority of the items in each subscale were within the suggested range of r = 0.30 to r = 0.70 [17]. DEBQ-C total and subscale scores become internally reliable, eventuallty.
Test-retest
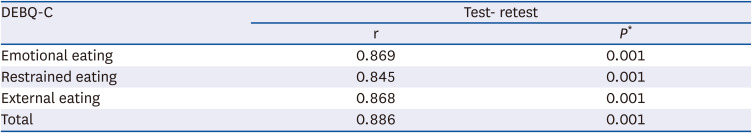
The emotional eating subscale score had a test-retest reliability of 0.869, restraint eating had a test-retest reliability of 0.845, external eating had a test-retest reliability of 0.868, and the DEBQ-C total score had a test-retest reliability of 0.886 (Table 4).
Turkish version of DEBQ-C subscales by gender and weight status
According to the BMI levels of the children, the child form emotional eating and external eating scores do not show a statistically significant difference (P > 0.05).
A statistically significant difference was found between the children’s restrained eating scores according to the BMI levels of the children (P = 0.001; P < 0.01). As a result of paired comparisons; The restrained eating scores of those with normal weight were higher than those who were underweight (P = 0.001; P < 0.01). No statistically significant difference was found between the restrained eating scores of the other groups (P > 0.05; Table 5).
Table 5
Evaluation of scale scores according to gender and BMI classification
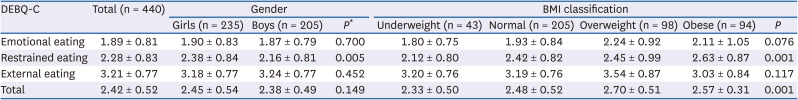
A statistically significant difference was found between the children’s total eating scores according to the BMI levels of the children (P = 0.001; P < 0.01). As a result of paired comparisons; The total eating scores of the overweight and normal weight groups were higher than the underweight ones (P = 0.011; P = 0.007; P < 0.05, respectively). No statistically significant difference was found between the total eating scores of the other groups (P > 0.05; Table 5).
DISCUSSION
This research examined the cross-cultural reliability and validity of a Turkish version of the DEBQ-C in a group of Turkish pre-adolescents. The DEBQ-C has high reliability and construct validity, and is suited for measuring eating behaviors in Turkish pre-adolescent children, according to the findings.
Regarding reliability, internal consistency values are satisfactory in terms of dependability, however they are somewhat higher than those reported by van Strien and Oosterveld [11] (α values between 0.73 to 0.82). Previous investigations of the DEBQ-C in Spanish and Chinese versions [218] found comparable reliability estimates.
Gender had no effect on the DEBQ-C total score, according to our findings. Only subscale of the restrained eating score differs substantially between girls and boys. We found that girls scored higher in restraint eating than boys. Both restrained and emotional eating scores were found to be higher in the studies by Snoek et al. [19] In addition, no significant differences across gender were seen in the Spanish and Taiwanese studies [218]. In these studies, it is stated that “gender disparity starts in late adolescence.” The relationship between gender and emotional eating and restrained eating is complex. Many factors, including socioeconomic level, willingness to appear thin, and cultural differences, may affect this relationship [1920]. Therefore, longitudinal studies are needed to better understand this relationship.
The confirmatory factor analysis confirmed these findings, since the 20-item scale had a higher goodness-of-fit. The results of the confirmatory factor analysis support van Strien and Oosterveld [11]’s 3-factors factorial structure. The DEBQ-C appears to assess the same three components (emotional, restrained, and external eating) as the original (Dutch) version, indicating that the three-factor model is replicable, valid, and consistent in the Turkish sample. The factor loadings for each item in the 3-factor model ranged from moderate to strong (0.554–0.826). There were three common variables in previous studies, which match our findings [218].
In our research, overall DEBQ-C scores were shown to be linked to BMI. The restraint, eating scores of pre-adolescents in the normal weight group were greater than those in the under weight group. As a result, the current study found that restrained eating may have a role in pre-adolescent overweight or obesity. Previous research suggests that stress might impair an individual’s self-control, which could play a key role in the link between restrained eating and weight increase [212223]. According to a Taiwanese study, overeating style was linked to small-to-moderate positive correlations with BMI and was only found in the whole sample and healthy weight group for restrained eating. In fact, prior research has revealed that restrained eating is frequently associated with overeating. According to van Strien and Oosterveld [11], limited eaters’ lack of self-control causes them to overeat. However, while restraint is more prevalent in overweight children, it may also be linked to BMI in children of normal weight. The Spanish study [2] supported these findings. This data might imply that restricting eating is a risk factor for childhood obesity and a common behavior among overweight children. Previous research on emotional eating, on the other hand, has found that it is more prevalent in clinically overweight children than in nonclinically overweight children. The link between emotional eating and overweight in obese people has been reported by Geliebter and Aversa [24] and van Strien et al. [25]. Emotional eating was more significantly related to normalweight emotional eaters than overweight emotional eaters in a study by Nguyen-Rodriguez et al. [26]. In contrast, our research found that emotional eating scores are not associated with BMI.
External eating, as van Strien et al. [25] note out, is an evolutionarily normal response (associated to the thrifty genotype) that may be seen in people of all weight categories. When we compared external eating score to emotional eating and restrained eating score, we found that external eating score was greater in all children. The overweight individuals in this study scored higher on external eating than the normal-weight group. According to the theory of the function of extrinsic food cues in overweight development, these results, which are similar to those found by previous studies are not predicted [2101118]. Non-clinical overweight participants’ external eating scores were not statistically different from both clinically overweight and normal-weight participants, according to Wang et al. [18] This condition has been viewed by researchers as controlling, to some extent, the eating behaviors of clinically obese children getting therapy.
There are a few flaws in this study. To begin with, because the data is self-reported, the results may have been influenced by children’s feelings of pressure to answer. Furthermore, children may be unaware of their own behavior, such as whether they eat in reaction to exterior food signals, participate in emotional eating, or cognitively conceal hunger. Second, because the data are cross-sectional, it is unable to draw solid conclusions regarding the direction of the observed relationships [2]. Second, the data are cross-sectional, and no solid inferences regarding the direction of the discovered relationships can be formed due to the nature of cross-sectional studies.
Finally, we used an acceptable sample size to examine the consistency and reliability of the DEBQ-C among Turkish preadolescents. The Turkish version of the DEBQ-C is a valid and accurate psychometric test that may be used to assess and triage preadolescents with eating attitudes. The DEBQ-C is a viable and effective tool for assessing eating attitudes and behaviors among Turkish preadolescents aged 7 to 12 years. In future research among Turkish preadolescents, we recommend using a 20-item DEBQ-C.
 XML Download