

 PDF
PDF Citation
 Print
Print


INTRODUCTION
Cardiovascular diseases (CVDs) are defined as chronic diseases such as hypertension, arteriosclerosis, cerebral hemorrhage, cerebral thrombosis, cerebral infarction, angina pectoris, myocardial infarction, and congestive heart failure [1]. A rapidly aging population, westernized dietary habits, increasing obesity, and metabolic syndrome have led to increased morbidity and mortality from CVDs in South Korea [234]. According to the cause of death statistics released by Statistics Korea in 2019, heart disease was the second leading cause of death after cancer, cerebrovascular disease was the fourth leading cause, and hypertension was the ninth leading cause of death [5]. CVDs are characterized by complicated etiologies, long disease courses, and severe health damage. They are also responsible for serious harm to the state and society, as they increase the economic burden of treating chronic diseases [6].
Health is particularly valuable because it is essential for an individual’s well-being and ability to fully participate in the workforce and society [7]. Health and nutrition disparities or inequalities include differences caused by sex, race or ethnicity, education, income, disability, place of residence and domicile, or sexual orientation [8]. Article 3 of the Regional Public Health Act stipulates that state and local governments are responsible for establishing policies to prevent health disparities among local residents [9]. One of the two overarching goals of Healthy Plan 2020 was to improve health equity nationally [10].
Numerous studies on regional health disparities have focused on urban-rural or metropolitan-non-metropolitan areas [11121314]. However, few studies have compared regional disparities in CVD morbidity and mortality in South Korea [15].
Lifestyle, including dietary habits, is an important determinant of health. The major focus in the area of dietary assessment has been to measure diet quality from diverse perspectives in a comprehensive manner [1617]. Many studies suggest that a composite measure of diet is a preferred alternative to using the levels of a single nutrient or the intake of certain foods as a measure of diet quality [1819]. Commonly used food quality evaluation tools include the nutrient adequacy ratio, mean adequacy ratio, and index of nutritional quality, which evaluate subjects based on nutrient intake. Recently, several tools have been developed to evaluate the overall diet quality, including the healthy eating index, recommended food score, alternate Mediterranean diet index, and diet quality index-international (DQI-I). All of these tools are useful in assessing variability within a diet and the overall diet quality of individual populations [20]. The DQI-I focuses on concerns related not only to chronic diseases, but also to problems of undernutrition, thereby providing a global tool for monitoring the healthfulness of diet and exploring aspects of diet quality related to nutrition transition [21].
Previous studies were conducted only on the relationship between DQI-Is and CVDs such as stroke [22], and cerebrovascular disease and CVDs [2]. There is a dearth of literature on the effect of DQI-Is on regional disparities in CVD prevalence. Therefore, this study aimed to examine the differences in health-related factors, body mass index (BMI), metabolic syndrome and CVD prevalence, and DQI-I according to four residential areas, and the effect of diet quality on regional disparities of CVD prevalence in Korean adults using the 2013–2016 Korea National Health and Nutrition Examination Survey (KNHANES). This study provides basic data to resolve regional health disparities related to the prevalence of CVDs.
Go to : 
SUBJECTS AND METHODS
Subjects
This study used data from the KNHANES (2013–2016) conducted by the Korea Disease Control and Prevention Agency of the Ministry of Health and Welfare. Among the 24,095 participants aged 20 years and older, subjects with outlying dietary intake (< 500 kcal or > 5,000 kcal/day; n = 3,249) [23], participants with missing data on demographic characteristics (n = 2,536), women who were pregnant or breastfeeding (n = 323), and those who did not fast for 8 h before the blood test (n = 341) were excluded. Ultimately, 17,646 participants were included in the analysis. The Institutional Review Board of the Korea Disease Control and Prevention Agency approved KNHANES (IRB No. 2013-07CON-03-4C, 2013-12EXP-03-5C, 2015-01-02-6C, and 2016-02CON-06-C).
Demographic and health-related variables
Demographic variables included residential area, sex, age, marital status, educational level, and household income level. Residential areas were categorized into city (Dong area) and non-city (Eup and Myeon area) groups. The city group was subdivided into three parts to reflect the relative city status: City 1 (Seoul and Gyeonggi cities), City 2 (Gwangyeoksi cities), and City 3 (other cities) [16]. The age groups were 20–29, 30–49, 50–64, and ≥ 65 years. Marital status was classified as married or unmarried. Educational level was classified as elementary school graduate or lower, middle school graduate, high school graduate, and college graduate or higher. Household income levels were divided into four groups (lowest, lower-middle, upper-middle, and highest quartiles of monthly household income). Health-related factors included the monthly drinking rate, current smoking rate, mental stress status, walking (d/wk), and strength exercise (d/wk).
BMI, metabolic syndrome and CVD prevalence
BMI, an indicator of obesity, was calculated as body weight (kg) divided by height squared (m). Metabolic syndrome was defined according to the criteria of the modified National Cholesterol Education Program III for the Asian population [24] and the modified abdominal obesity cutoff for Korean adults [25]. Subjects who met at least three of the following criteria were defined as having metabolic syndrome: 1) waist circumference of ≥ 90 cm in men and ≥ 85 cm in women; 2) fasting glucose of ≥ 100 mg/dL or use of medication for diabetes (insulin or oral agents); 3) triglyceride level of ≥ 150 mg/dL or use of lipid-lowering medication; 4) HDL-cholesterol of < 40 mg/dL in men and < 50 mg/dL in women or use of dyslipidemia medication; and 5) systolic blood pressure of ≥ 130 mmHg, diastolic blood pressure of ≥ 85 mmHg, or use of antihypertensive medication. The prevalence of CVD was determined by the presence or absence of one or more of the following: hypertension, dyslipidemia, stroke, myocardial infarction, and angina pectoris.
DQI-I
The DQI-I can evaluate diet quality in terms of nutritional variety, adequacy, moderation, and overall balance. Dietary variety, such as diversity in food groups (meat/poultry/fish/egg, dairy/beans, grains, fruit, and vegetables) and protein sources (meat, poultry, fish, dairy, beans, and eggs), was scored out of 20 points. The adequacy category (composed of vegetables, fruits, grains, dietary fiber, protein, iron, calcium, and vitamin C) was calculated according to the ratio of intake to a given serving size or recommended daily intake and was scored out of 40 points. The moderation category (including total fat, saturated fat, cholesterol, sodium, and empty calorie foods) was scored out of 30 points. Finally, the overall balance category, which considers macronutrient ratios and fatty acid ratios, received a score of 10 points. The scores for each component in the four categories were added to obtain the final DQI-I score (100 points). A high DQI-I score is considered an indicator of a high-quality diet [22].
Statistical analysis
The collected data were analyzed using SPSS 23.0 package (IBM Inc., Chicago, IL, USA), and complex sampling analyses with cluster sampling variables, strata, and weighted values were performed. Nominal and rank variables are presented as frequency and percentage using the chi-square test, and continuous variables are presented as mean ± SE using a general linear model. The effect of diet quality by region on the prevalence of CVDs was analyzed using a complex sampling logistic regression model. This analysis was performed to obtain the odds ratios and 95% confidence intervals adjusted for confounding variables (general characteristics and health-related factors). The statistical significance level was set at a P-value of < 0.05.
Go to :
RESULTS
Comparative analysis of demographic and health-related factors by regions
The results of the demographic analysis are presented in Table 1. As a result of age analysis, the proportion of the population over 50 years in the non-city group was 67.9%, reflecting the highest mean age (51.6 ± 0.3 years). In the case of City 1 and City 3, the 30–49 age group was the largest (P < 0.001). The percentage of married people was the highest in the non-city category (P < 0.001). City 1 had the highest educational level, with 42% of the population being college educated or higher, whereas the proportion of people who had not graduated from primary school was highest in the non-city group at 39.5% (P < 0.001). Household income levels showed the same trend as educational level (P < 0.001). The ratio of drinkers to smokers was used to analyze health-related lifestyles. The ratio of monthly drinking was the highest occurred in City 1 (P < 0.01), and the ratio of the current smoking rate was the highest occurred in the non-city group (P < 0.05). Regarding exercise habits, those in the non-city category showed the lowest rates of both walking (P < 0.001) and strength exercises (P < 0.001).
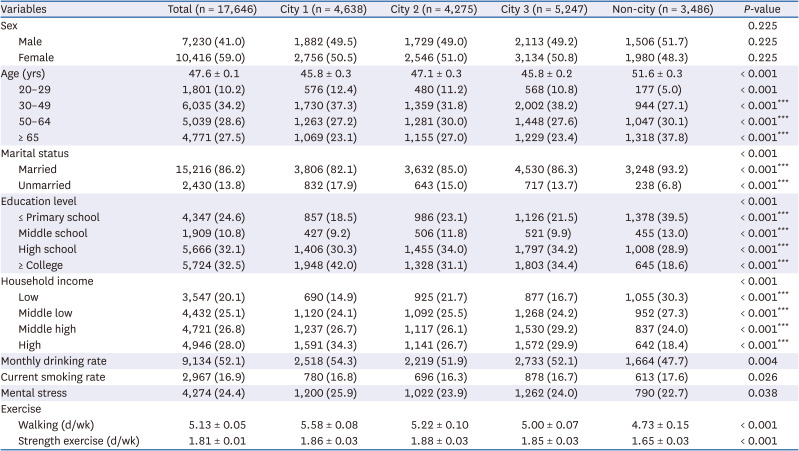
Table 1
Demographic and health-related factors by regions
Values are presented as number (%) or mean ± SE. P-values were analyzed by complex sampling χ2 test or general linear model F-test.
City 1, Seoul, Gyeonggi cities; City 2, Gwangyeoksi cities; City 3, other cities; Non-city, rural area.
***P<0.001.
![]()
Comparative analysis of BMI and metabolic syndrome index by regions
The results of the regional BMI and metabolic syndrome index analyses are shown in Table 2. In the case of BMI, all groups showed values outside the normal range (< 22.9 kg/m2). The non-city group showed the highest average BMI (P < 0.05), and the same trend was observed for triglyceride levels (P < 0.05) and waist circumference (P < 0.01). Conversely, the mean HDL-cholesterol level was the lowest in the non-city group (P < 0.05). Systolic blood pressure was the highest in the non-city category (P < 0.05), and diastolic blood pressure was the highest in City 1 (P < 0.001). These results also affected the analysis of the retention numbers of metabolic syndrome components. Therefore, the non-city group also had the highest risk of developing metabolic syndrome (P < 0.001).
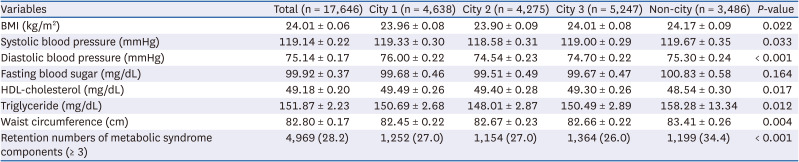
Table 2
BMI and metabolic syndrome index by regions
Values are presented as mean ± SE or number (%). Adjusted for age, marital status, education level, income, drinking, smoking, mental stress and exercise in total subjects. P-values were analyzed by complex sampling χ2 test or general linear model F-test.
BMI, body mass index; City 1, Seoul, Gyeonggi cities; City 2, Gwangyeoksi cities; City 3, other cities; Non-city, rural area.
![]()
Comparative analysis of CVD prevalence by regions
Regional analysis of the prevalence of CVD (hypertension, dyslipidemia, stroke, myocardial infarction, and angina pectoris) revealed that only hypertension and dyslipidemia were significant (Table 3). Hypertension was the most prevalent condition, especially in the non-city group (29.1%, P < 0.001). In the analysis of the prevalence of dyslipidemia, City 3 (10.8%) showed the lowest prevalence and City 1 (13.6%) showed the highest prevalence (P < 0.001), which is in contrast to hypertension. The non-city group had the highest percentage of all CVDs, except dyslipidemia. The percentage of patients with more than one CVD was 35.6% (P < 0.001), indicating that more than one in three people had multiple CVDs.
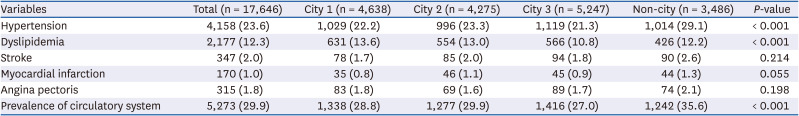
Table 3
Prevalence of cardiovascular diseases by regions
Values are presented number (%). P-value was analyzed by complex sampling χ2 test.
City 1, Seoul, Gyeonggi cities; City 2, Gwangyeoksi cities; City 3, other cities; Non-city, rural area.
![]()
Comparative analysis of diet quality using DQI-I by regions
Table 4 shows the results of the diet quality analysis using DQI-I for each region. City 3 (69.34 ± 0.17) showed the best diet quality level, and the non-city group (68.36 ± 0.22) showed the lowest diet quality level (P < 0.01). Within-group variety for protein source in the variety category of the DQI-I was lowest in the non-city category (3.41 ± 0.02), and highest in City 1 (3.52 ± 0.03, P < 0.01). In the adequacy category, the intake of fruit (P < 0.001) and calcium (P < 0.001), known to be associated with the development of CVDs, was lowest in the non-city category, but the intake of grain was highest. In the moderation category, City 1 had the lowest overall (P < 0.001), total fat (P < 0.001), and saturated fat scores (P < 0.001) by a significant margin, whereas in the non-city group, the opposite results were observed, confirming conflicting diet quality. Moderate sodium intake was lowest in the non-city category (P < 0.001). As for the overall balance category, City 1 showed the highest score, whereas the non-city group showed the lowest score (P < 0.001). Similar results were observed for the ratio of macronutrients (P < 0.01) and fatty acids (P < 0.05).
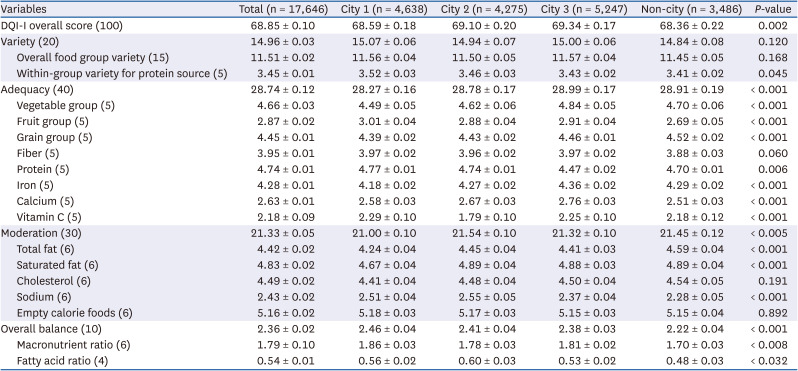
Table 4
DQI-I component scores by regions
Values are presented as mean ± SE. Adjusted for age, marital status, education level, income, drinking, smoking, mental stress and exercise in total subjects. P-value was analyzed by complex sampling general linear model F-test.
DQI-I, diet quality index-international; City 1, Seoul, Gyeonggi cities; City 2, Gwangyeoksi cities; City 3, other cities; Non-city, rural area.
![]()
Odds ratio for prevalence of CVDs by the DQI-I
After correcting for demographic and health-related factors that showed significant differences according to region, logistic regression analysis was performed on the effect of the DQI-I on the prevalence of CVDs to obtain odds ratio (Table 5). When the DQI-I score increased by 1 point, the odds ratio for the prevalence of CVDs reduced by a factor of 0.991 (P < 0.001), but this was not the case in all regions.

Table 5
Odds ratio for prevalence of cardiovascular diseases by DQI-I
| Variables | Total (n = 17,646) | City 1 (n = 4,638) | City 2 (n = 4,275) | City 3 (n = 5,247) | Non-city (n = 3,486) |
|---|---|---|---|---|---|
| Wald F | 12.522 | 1.330 | 7.087 | 1.460 | 4.342 |
| P-value | < 0.001 | 0.249 | 0.007 | 0.229 | 0.018 |
Adjusted for age, marital status, education level, household income, monthly drinking rate, current smoking rate, mental stress, and exercise in all subjects. P-value was analyzed by complex sampling logistic regression model.
DQI-I, diet quality index-international; City 1, Seoul, Gyeonggi cities; City 2, Gwangyeoksi cities; City 3, other cities; Non-city, rural area.
![]()
Go to :
DISCUSSION
Studies on the relationship between residential environment factors and health status have been actively conducted in the United States for a long time [2627]. Among various factors, this study focused on differences in diet quality by regional type. We also identified a relationship between dietary quality and CVD risk. Risk factors for CVDs include smoking, obesity, diabetes, hypertension, dyslipidemia, lack of physical activity, and unhealthy diet [28]. This study investigated the relationship between diet quality and CVDs by dividing them into four residential areas in Korea. There were regionally significant differences in health-related behaviors such as drinking, smoking, and exercise. In particular, the non-city area showed the lowest exercise level among the other areas. Further, non-cities showed the highest risk in the analysis of metabolic syndrome indexes such as BMI, systolic pressure, HDL-cholesterol, triglyceride, and waist circumference compared with other cities. Metabolic syndrome refers to the co-occurrence of several known cardiovascular risk factors [29]. Taken together, these results show that non-cities are at risk of CVD.
The quality of the diet results were as follows: City 3 (69.34), City 2 (69.10), City 1 (68.59), and non-city (68.36). City 2 and City 3 were found to have evenly distributed scores across all DQI-I variables. City 1 had high protein and fruit intake, in contrast to the low scores for lipid consumption moderation. Non-city had low fruit and calcium intake levels. Interestingly, it was confirmed that the amount of lipid consumption was lowest and the sodium intake level was highest. A study on the relationship between diet and CVD risk reported that the consumption of vegetables, fruits, and whole grains is typically regarded as an indicator of a healthy diet and is well known to reduce CVD risk [30]. Recommendations on diet for patients with CVD include reduced intake of saturated and trans fatty acids and low sodium intake [31].
The results of this study were also affected by those of previous studies. Kim et al. [32] reported that fat intake gradually increases with rapid economic growth and urbanization. In addition, rural residents tend to maintain traditional dietary patterns, characterized by a high consumption of salted vegetables, such as kimchi [33]. For these reasons, rural areas are considered to have a relatively low quality of dietary intake compared with urban areas, similar to the results of this study. These factors influenced the prevalence of hypertension (P < 0.001) and dyslipidemia (P < 0.001). These results confirmed that dietary factors play an important role in the prevalence of CVD.
Although it has been reported that health expectations differ depending on the region of residence [34], previous studies on chronic diseases according to regional differences have only focused on the regional environment and failed to adequately evaluate nutritional factors [3536].
In this study, the difference between urban and rural areas in some demographic and health-related factors, BMI, metabolic syndrome index, CVDs, and DQI-I components was more pronounced than the difference between cities. These factors result from regional differences in various dietary patterns and lifestyles. Urbanization has also affected health-related lifestyle factors in Korea because urban residents tend to have a westernized lifestyle rather than a traditional Korean lifestyle [3738]. Ha et al. [39] reported that rural residents had significantly higher prevalence of cardiometabolic diseases than metropolitan and urban residents. This is because the low level of physical exercise undertaken by the socioeconomically disadvantaged class acts as a risk factor for metabolic syndrome [40]. This was confirmed in a study by Lee and Sa [41]. The rates of overweight and obesity were higher in the less wealthy groups than in the wealthy groups in cities. Conversely, rural areas showed the opposite results. These factors were predicted to have influenced the higher frequency of CVDs in the non-city group than in the city groups in our CVD prevalence study. In the comparison of diet quality, the non-city category had higher grain intake and lower fruit intake scores. In addition, the level of lipid intake in the moderate category was high. When the carbohydrate intake ratio is high, the frequency of intake of fish and meat groups and milk and dairy products decreases, which also affects the nutritional intake level of lipids [42]. In addition, the low sodium moderation score was due to the intake of kimchi, a major traditional food in the Korean diet, which is composed mostly of salted vegetables [43]. These dietary habits affected the non-city group, obtaining the lowest score in the diet quality analysis, and a negative correlation was found between diet quality and the prevalence of CVDs.
This study has several limitations. First, we did not completely control for factors related to the size of the city. Factors affected by sex were not considered as we focused on regions as a variable. Therefore, these findings should be cautiously interpreted. To the best of our knowledge, this is the first study to investigate the associations between CVD risk factors and dietary factors among regional types in the KNHANES.
In conclusion, these findings suggest that diet quality plays an important role in the onset of CVD, differs among regional types, and is affected by the type of residential area within Korea. Therefore, it is necessary to customize nutritional education and public health surveillance systems and policies regarding nutrition in each region for the prevention and management of CVD risk factors.
Go to :
 XML Download