

 PDF
PDF Citation
 Print
Print


INTRODUCTION
Ulcerative colitis, a subtype of inflammatory bowel disease (IBD), is a consequence of complex interactions between genetic and environmental factors [123]. Notably, chronic inflammation in the colon and rectum can progress into colorectal cancer (CRC) through increasing cellular proliferation, tumor-promoting cytokine production, and angiogenesis [4]. The risk of colitis-associated cancer increases by 0.5–1% every year after 10 years of chronic inflammation [5].
Accumulating epidemiological and animal studies have shown that high protein diet (HPD) is a risk factor for the incidence of IBD and CRC [6789]. A possible mechanism for this involves the influx of undigested protein from the small intestine in the colon. This increases protein fermentation (putrefaction) by the gut microbiota, thereby forming nitrogenous compounds, such as p-cresol, ammonia, hydrogen sulfide, short-chain fatty acids (SCFAs), and branched-chain fatty acids. These bacterial metabolites may damage colonocytes. This, in turn, suppresses the oxygen consumption of the colorectal mucous membrane and stimulates inflammatory reactions in genetically susceptible hosts [10]. Together, these alterations in the colon luminal environment may affect mucosal physiology and tolerance leading to IBD development.
Along with the amount, the source of protein is also important for colonic health. When supplied at normal dietary intake levels, different protein sources have shown varying effects on colitis and CRC, and there is inconsistency of results even between studies on the same protein source. In the study of Jiang et al. [11], 20% soy protein greatly decreased inflammation score, submucosal layer thickness, and messenger RNA (mRNA) expression of tumor necrosis factor-alpha (TNF-α) in colon tissue compared to 20% casein (20C) and whey protein in a dextran sulfate sodium (DSS)-induced colitis mouse model. On the other hand, soy protein diet feeding in a CRC mouse model largely increases the risk of CRC by elevating the tumor incidence, tumor burden, and tumor mass index compared to a diet with casein, whey protein, or red meat at the level of 16% contents [12]. In the case of red meat, it causes greater increase in the risk of CRC occurrence compared to whey protein in mouse [1213]. The World Health Organization has classified processed and red meat as categories 1 and 2 carcinogens for colon cancer, respectively, and recommends limiting the high consumption of these products.
Therefore, in this study, we investigated the effect of protein sources in the context of increased risk of colitis by high protein supply to determine the effects of various protein sources on colitis.
Go to : 
MATERIALS AND METHODS
Animals
Fifty-five female (6-week-old) Balb/c mice were obtained from KOATECH Bio Inc. (Busan, Korea). The animals were kept under controlled conditions (humidity of 50 ± 10%, 12 h light/dark cycle, and at 25 ± 2°C). The mice received food and water ad libitum during the experimental period. Food intake was measured daily and mouse body weight was measured once a week throughout the entire experimental period. Animal experiments were performed in compliance with the institutional guidelines and the protocols were approved by the Animal Care and Use Committee at Daegu Catholic University (IACUC-2016-002, Gyeongsan, Korea).
Experimental protocol
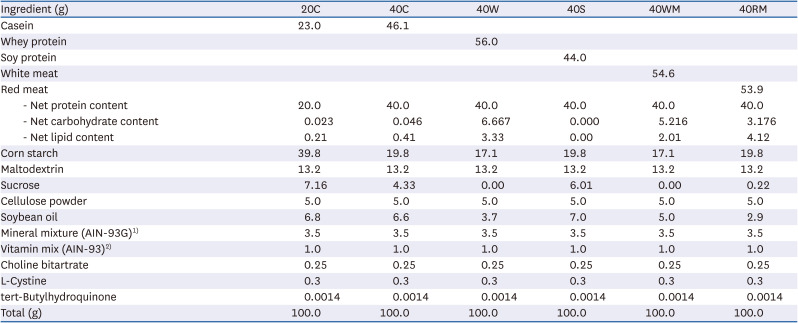
Mice were divided into 7 experimental groups (Fig. 1): 20C (control, n = 6), 20C-DSS (20CD, n = 6), 40% casein-DSS (40CD, n = 8), 40% whey protein-DSS (40WD, n = 7), 40% soy protein-DSS (40SD, n = 7), 40% white meat-DSS (40WMD, n = 7), 40% red meat-DSS (40RMD, n = 7). Casein, whey protein concentrate, and soy protein isolate were purchased from Fonterra (Auckland, New Zealand), GNC (Pittsburgh, PA, USA), and ES Food Inc. (Gunpo, Korea), respectively. Chicken breast used as white meat was prepared by roasting in oven at 150°C for 30 min, dried in dry oven at 45°C for 72 h, and pulverization. A round of beef used as red meat was prepared by roasting in oven at 150°C for 1 h, dried in dry oven at 45°C for 72 h and pulverization. The composition of the experimental diet based on AIN93-G is presented in Table 1. In consideration of the amount of protein, carbohydrate, and fat contained in each protein source, the net protein content was adjusted to be 20 g/100 g for normal protein diet and 40 g/100 g for HPD. Fat was adjusted with soybean oil, carbohydrates were first adjusted with sucrose, and the excess amount was further adjusted with corn starch. Mice were fed experimental diet for 4 wk and the mice except 20C group were given 3% DSS in drinking water for 6 days on the 4th wk of the experiment. All the mice were sacrificed 2 days after the last treatment.
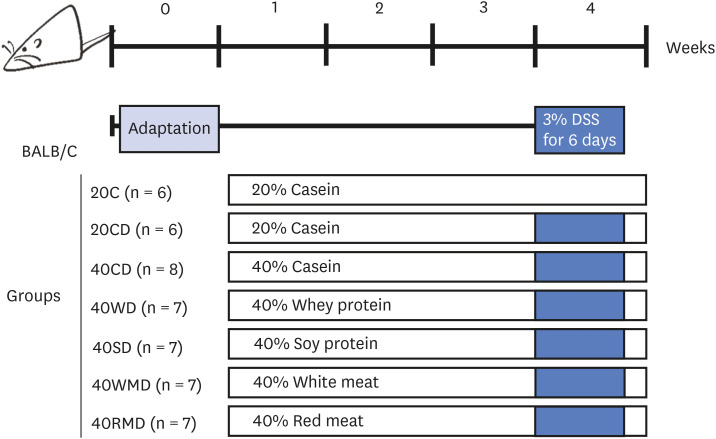 | Fig. 1Schematic representation of experimental design. Female Balb/c mice were divided into 7 diet groups: 20C (control), 20CD, 40CD, 40WD, 40SD, 40WMD, 40RMD. Animals were fed experimental diet for total 4 wk and were received 3% DSS in their drinking water for 6 days on the 3rd wk of the experiment.DSS, dextran sulfate sodium; 20C, 20% casein; 20CD, 20% casein-DSS; 40CD, 40% casein-DSS; 40WD, 40% whey protein-DSS; 40SD, 40% soy protein-DSS; 40WMD, 40% white meat-DSS; 40RMD, 40% red meat-DSS.
|
Table 1
Composition of experimental diets
C, casein; W, whey protein; S, soy protein; WM, white meat; RM, red meat.
1)Composition of AIN-93G mineral mix (g/kg): calcium carbonate 357; potassium phosphate, monobasic 196; potassium citrate. H2O 70.78; sodium chloride 74; potassium sulfate 46.6; magnesium oxide 24; ferric citrate, U.S.P. 6.06; zinc carbonate 1.65; manganous carbonate 0.63; cupric carbonate 0.3; potassium iodate 0.01; sodium selenite 0.01025; ammonium paramolybdate. 4H2O 0.00795; sodium metasilicate.9H2O 1.45; chromium potassium sulfate. 12H2O 0.275; lithium chloride 0.0174; boric acid 0.0815; sodium fluoride 0.0635; nickel carbonate 0.0318; ammonium vanadate 0.0066; sucrose, finely powdered 221.026.
2)Composition of AIN-93G vitamin mix (g/kg): niacin 3; calcium pantothenate 1.6; pyridoxine HCl 0.7; thiamine HCl 0.6; riboflavin 0.6; folic acid 0.2; biotin 0.02; vitamin E acetate (500 IU/g) 15; vitamin B12 (0.1%) 2.5; vitamin A palmitate (500,000 IU/g) 0.8; vitamin D3 (400,000 IU/g) 0.25; vitamin K1/dextrose mix (10 mg/g) 7.5; sucrose 967.23.
![]()
Assessment of disease activity index (DAI)
The mice were monitored daily during the DSS supply period. The overall disease severity was assessed by a clinical scoring system on a scale of 0–4 as follows: weight loss (0: none; 1: 1–5%; 2: 6–10%; 3: 11–20%; 4: >20%), stool consistency (0–1: normal; 2–3: loose; 4: diarrhea), and visible blood in feces (0–1: none; 2–3: slightly bleeding; 4: gross bleeding) [14].
Sample preparations
The feces were collected one day before the end of the experiment. After completion of experiment, mice were anesthetized with CO2 and sacrificed after 12 h of fasting. Blood was taken from the inferior vena cava and centrifuged at 3,000 g for 15 min at 4°C to separate the plasma. After the blood was collected, the entire large intestine from cecum to rectum was taken out and the length of large intestine was measured with a ruler. The large intestine was flushed out luminal contents with phosphate buffered saline and was weighed. After remove the cecum, the colon was divided into 3 parts (proximal, middle, and distal part) and stored at −85°C before the analysis.
Myeloperoxidase (MPO) activity assay
The MPO activity of middle part of the colon tissue was measured. The middle parts of the colon tissues were homogenized and sonicated in potassium phosphate buffer (pH 6.0) containing 0.5% hexadecyltrimethylammonium bromide and centrifuged at 13,000 × g, 4°C for 10 min. Supernatants were collected and added to the reagent buffer consisting of 50 mM potassium phosphate with 20 mg/mL O-dianisidinedihydrochloride and 20 mM hydrogen peroxide. The colorimetric reaction was measured at 460 nm. The protein concentrations were determined using the BCA protein assay kit (Thermofisher, Waltham, MA, USA).
Histopathology of the colorectal tissue
Formalin-fixed colorectal tissues were paraffin embedded and then cut into 4 μm sections on a glass slide. Sections were stained with hematoxylin and eosin for the histopathology analysis. The sections were photographed using a Leica Application Suite program (ver. 4.7.1; Leica Microsystems, Wetzlar, Germany) at 40× magnification.
Quantitative reverse transcription polymerase chain reaction (qRT-PCR)
Total RNA was isolated from colorectal tissue. RNA was reversibly transcribed with reverse transcriptase and oligo-(dT) primer. mRNA expression of zonula occludens-1 (ZO-1) (forward primer: 5′-CCACCGGAGTCTGCCATTACACG-3′, reverse primer: 5′-GGGTGGGCTCCTCCAGTCTGACATTAG-3′), occludin (forward primer: 5′-GGCGGATATACAGACCCAAGAG-3′, reverse primer: 5′-GATAATCATGAACCCCAGGACAAT-3′), TNF-α (forward primer: 5′-TACCTTGTCTACTCCCAGGTTCTCT-3′, reverse primer: 5′-GTGTGGGTGAGGAGCACGTA-3′), interleukin (IL)-6 (forward primer: 5′-CTTCCTACCCCAATTTCCAATG-3′, reverse primer: 5′-ATTGGATGGTCTTGGTCCTTAGC-3′), IL-10 (forward primer: 5′-AGAAGCATGGCCCAGAAATCA-3′, reverse primer: 5′-GGCCTTGTAGACACCTTGGT-3′), monocarboxylate transporter 1 (MCT1) (forward primer: 5′-TGTTGTTGCAAATGGAGTGT-3′, reverse primer: 5′-AAGTCGATAATTGATGCCCATGCCAA-3′), sodium-coupled MCT1 (SMCT1) (forward primer: 5′-TGCCATTTCCTTATGGGTAGG-3′, reverse primer: 5′-AGTGGAGTCCTTTCCGCATTA-3′), and glyceraldehyde 3-phosphate dehydrogenase (GAPDH; forward primer: 5′-CACCCTCAAGATTGTCAGC-3′, reverse primer: 5′-TAAGTCCCTCCACGATGC-3′) were determined by qRT-PCR. Each reaction was carried out in 10 μL using TB Green Master Mix (Invitrogen, Waltham, MA, USA) according to the manufacturers’ instructions. Relative ratios were calculated based on the 2−ΔΔ CT method [15]. Relative quantification was based on the expression levels of target genes including ZO-1, occludin, TNF-α, IL-6, IL-10, MCT1, and SMCT1 versus GAPDH (reference gene). PCR was monitored using the Mini Opticon Real Time PCR System (Bio-Rad, Philadelphia, PA, USA).
Western blot analysis
Colorectal tissue was lysed with 10 mM Tris–HCl (pH 7.5), 100 mM NaCl, 1% NP-40, 50 mM NaF, 2 mM EDTA (pH 8.0), 1 mM PMSF, 10 μg/ml leupeptin, and 10 μg/mL aprotinin. Equal amounts of lysate protein samples were run on SDS polyacrylamide gel and then transferred onto a PVDF membrane. Nonspecific binding was blocked by soaking the membrane in Tris buffered saline-Tween (TBST) buffer that contained 5% nonfat dry milk for 1 h. The membrane was probed overnight with an antibody against cyclooxygenase-2 (COX-2; Abcam, Cambridge, UK) and GAPDH (Cell Signaling, Danvers, MA, USA). After washing with TBST buffer, the membrane was incubated for 1 h with horseradish peroxidase-conjugated goat anti-rabbit IgG (Cell signaling). The protein levels of COX-2 and GAPDH were determined by using an enhanced chemiluminescence kit (GE Healthcare, Waukesha, WI, USA).
Measurement of nitric oxide (NO) levels
Plasma NO concentration was measured according to the manufacturer’s instructions using NO detection kit (iNtRON Biotechnology, Seongnam, Korea).
Quantification of fecal lipocalin-2 (Lcn-2)
Freshly collected fecal samples were stored at −20°C until analysis. Fecal samples were reconstituted in phosphate buffered saline containing 0.1% Tween 20 (100 mg/mL) and vortexed for 20 min to get a homogenous fecal suspension. These samples were then centrifuged for 10 min at 12,000 rpm and 4°C. Clear supernatants were collected and used for Lcn-2 assay. Lcn-2 level was estimated in the supernatants using Duoset murine Lcn-2 ELISA kit (R&D Systems, Minneapolis, MN, USA).
Measurement of fecal ammonia concentration
Frozen feces were thawed, mixed with 10 mL water per 0.1 g content, and centrifuged at 10,000 rpm for 10 min at 4°C. The supernatant was filtered with a Whatman filter paper (Whatman International Ltd., Springfield Mill, Maidstone, England), and the ammonia concentration was measured using an ammonia assay kit (Sigma-Aldrich, St. Louis, MO, USA). Briefly, ammonia was assayed in the presence of α-ketoglutarate, glutamate dehydrogenase, and nicotinamide adenine dinucleotide phosphate. The decrease in absorbance at 340 nm due to the oxidation of nicotinamide adenine dinucleotide phosphate was proportional to the ammonia concentration.
Determination of SCFAs in feces
We used a method that was modified from the report of Han et al. [16] to measure the fecal fatty acids. Briefly, stored fecal samples at −85°C were lyophilized and dried fecal samples (0.1 g) were added to 1.6 mL water, 0.4 mL sulfuric acid, and 2 mL ether for extraction. The mixtures were homogenized and were centrifuged for 10 min at 15,000 g at 4°C. The supernatants were added CaCl2 to absorb the water and were filtered at 0.22 μm filter.
Analysis was performed using a BRUKER SCION 456-GC (Scion Instruments, Scotland, UK) gas chromatography system with FID detector. The extracts were separated using a HP-FFAP column (30 m × 0.32 mm × 0.25 μm, from Agilent Technologies, St Clara, CA, USA). A volume of 1 μL of sample was injected into a split/splitless inlet (in split mode, 30:1) by CP-8400 Autosampler (Scion Instruments), which was kept at 250°C. Helium (99.9999% purity) was used as a carrier gas at a flow rate of 1.2 mL/min. The oven program was set at an initial temperature of 80°C, increased to 160°C at a rate of 4°C/min, then increased to 200°C at a rate of 20°C/min and held at 200°C for 1 min.
Statistical analysis
All the values are expressed as means ± SEM. Statistical analysis was performed using SPSS version 16.0 (Statistical Package, IBM, Armonk, NY, USA). Student’s t-test and 1-way ANOVA test were performed to determine the differences between control and treatments. The P-value < 0.05 indicates a significant difference.
Go to :
RESULTS
Colitis activity
During DSS administration, colitis severity in the mice was scored based on the extent of weight loss, diarrhea, and bloody stool (Fig. 2A). On the last (6th) day of DSS administration, regardless of the protein source, the DAI of all 40% protein-DSS (40PD) feeding groups was significantly higher than that of the 20CD group (1.71 ± 0.08). Among the 40PD groups, the DAI of 40CD (3.73 ± 0.09) was the highest, followed by that of 40WD (3.44 ± 0.11), 40SD (3.35 ± 0.13), 40RMD (2.81 ± 0.25), and 40WMD (2.73 ± 0.15). The severity of disease affected the animals’ survival (Fig. 2B). Two days after the last DSS administration, the survival rates in the 40SD, 40CD, 40RMD, 40WD, and 40WMD groupswere57%, 63%, 71%, 86%, and 86%, respectively, whereas the 20C and 20CD groups showed 100% survival rates. To determine the efficacy of protein intake, we analyzed food intake and food efficiency ratio for whole experiment period (Table 2). Daily food intake for whole experiment period was highest in 40WMD and 40RMD overall while 40WD was lowest among the 40PD. Before the DSS treatment, the food efficiency ratio of each experimental group was uneven, but after DSS treatment, the daily food efficiency ratio was the lowest in 40CD and highest in 40RMD among the 40PD groups.
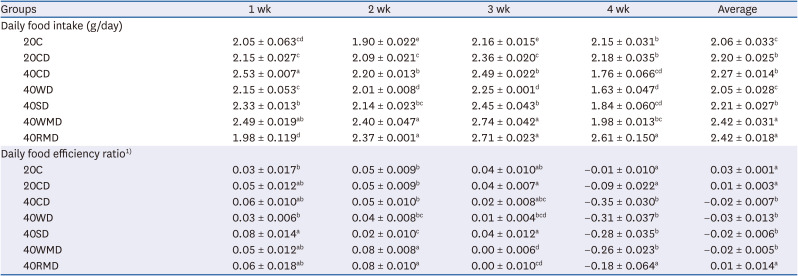
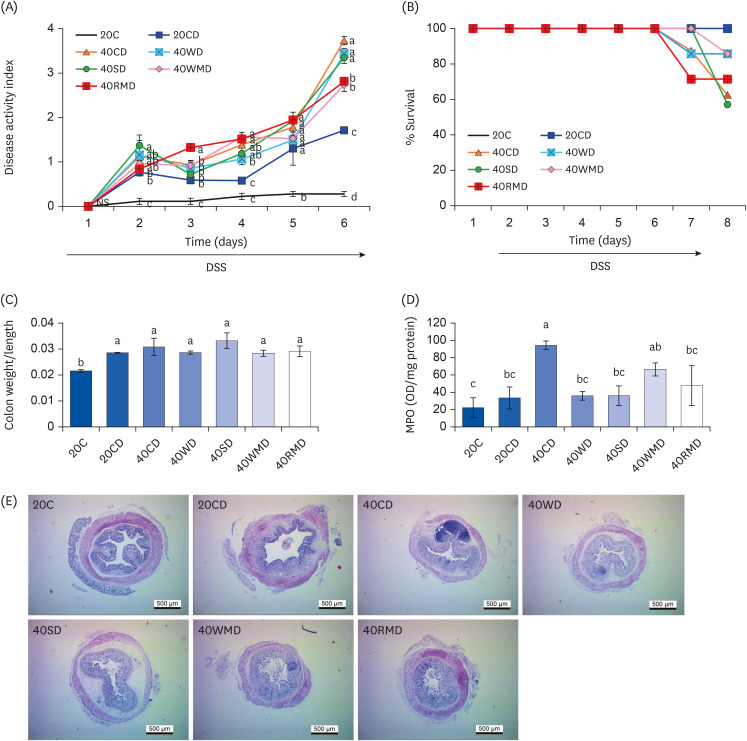 | Fig. 2Effect of various protein sources on the colitis activity. Female Balb/c mice in 20CD, 40CD, 40WD, 40SD, 40WMD, 40RMD group were administered 3% DSS in drinking water for 6 days. Control group received tap water. (A) Disease activity index of mice was monitored during DSS treatment. (B) The survival rate of mice was monitored during and after 2 days of the DSS treatment. (C) The weight and length of entire large intestine was measured and the weight/length ratio was calculated. (D) MPO activities were assayed in colorectal tissue. (E) Colorectal tissue sections were stained with hematoxylin and eosin. Representative histological pictures of mice are shown at 40× magnification. Means with different letters are significantly different at P < 0.05 by Duncan’s multiple range test.20C, 20% casein; 20CD, 20% casein-DSS; 40CD, 40% casein-DSS; 40WD, 40% whey protein-DSS; 40SD, 40% soy protein-DSS; 40WMD, 40% white meat-DSS; 40RMD, 40% red meat-DSS; DSS, dextran sulfate sodium; MPO, myeloperoxidase.
|
Table 2
Effect of various sources of high protein diet on food intake and food efficiency ratio in DSS-induced colitis mouse
Data are shown as mean ± SD.
Means with different letters indicate significant differences between the groups at P < 0.05 assessed by ANOVA with Duncan’s multiple range test.
DSS, dextran sulfate sodium; 20C, 20% casein; 20CD, 20% casein-DSS; 40CD, 40% casein-DSS; 40WD, 40% whey protein-DSS; 40SD, 40% soy protein-DSS; 40WMD, 40% white meat-DSS; 40RMD, 40% red meat-DSS.
1)Daily food efficiency ratio = body weight gain/food intake per day.
![]()
To evaluate the levels of inflammation, we analyzed the weight/length of the large intestine and MPO activity of the colon tissue. The ratio of weight/length of the large intestine was increased in DSS-administered groups compared to that in the control group, 20C (Fig. 2C). However, there was no difference according to the amount and the source of protein in the DSS-administered group. Colonic MPO activity was significantly increased in the 40CD group compared to in the 20CD group, followed by the highest activity in the 40WMD group (Fig. 2D). There were no other significant differences among the groups. DSS administration elicited crypt loss and edema in the colorectal tissue (Fig. 2E). These symptoms were more severe in 40PD groups than in the 20CD group. The 40CD group showed the most severe morphological changes among the 40PD groups.
The above data suggest that, among the 40PD groups, casein aggravated the symptoms and signs of colitis including DAI, mortality, colorectal MPO activity, and histomorphological changes the most (Table 3). Following casein, soy protein, red meat, whey protein, and white meat groups in an order showed more severe colitis symptoms than the 20CD group.
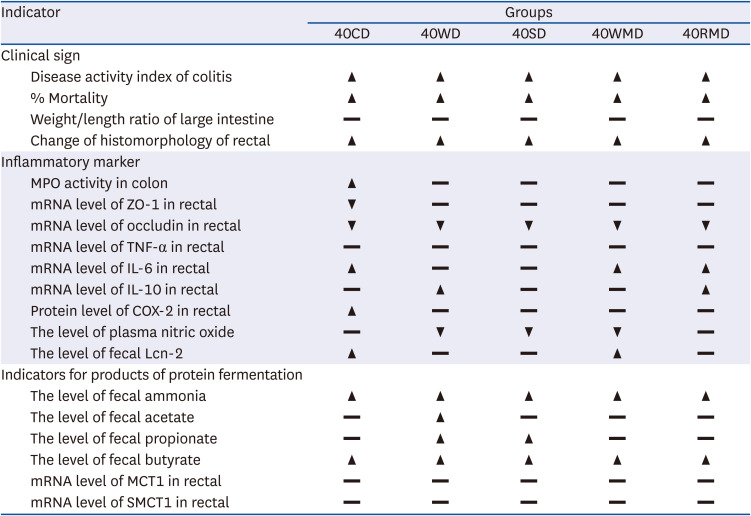
Table 3
Summary of the effects of various dietary protein sources on DSS-induced mouse colitis
Data are presented as below: ▲, ▼, significantly different; ▬, not significant results compared to 20CD at P < 0.05% by Duncan’s multiple range test.
DSS, dextran sulfate sodium; 40CD, 40% casein-DSS; 40WD, 40% whey protein-DSS; 40SD, 40% soy protein-DSS; 40WMD, 40% white meat-DSS; 40RMD, 40% red meat-DSS; MPO, myeloperoxidase; mRNA, messenger RNA; ZO-1, zonula occludens-1; TNF-α, tumor necrosis factor alpha; IL, interleukin; COX-2, cyclooxygenase; Lcn-2, lipocalin-2; MCT1, monocarboxylate transporter 1; SMCT1, sodium-coupled monocarboxylate transporter 1.
![]()
Inflammatory marker expression
To determine the effect of protein sources on colorectal tissue integrity and inflammation, the levels of tight junction proteins (ZO-1 and occludin), pro-inflammatory cytokines (TNF-α and IL-6), anti-inflammatory cytokines (IL-10), and inflammatory mediators (COX-2 and NO) in colorectal tissue and in plasma were analyzed. The mRNA expression of ZO-1 and occludin decreased significantly after DSS administration (Fig. 3A). Compared to the 20CD group, the 40CD group showed the lowest ZO-1 expression, whereas the level of occludin did not differ significantly among the 40PD groups. However, the mRNA expression for pro-inflammatory cytokine tends to increase after DSS administration (Fig. 3B). For TNF-α expression, 40PD groups did not show much difference compared to the 20CD group. Among the 40PD groups, the expression levels of 40SD and 40WMD were lower than those in 40CD and 40WD groups. IL-6 expression was the highest in 40RMD group, followed by that in 40CD and 40WMD groups. IL-6 levels in the 40WD and 40SD groups were similar to those in 20CD group. IL-10 expression was the highest in 40WD and 40RMD groups; there was no significant difference among other groups. 40CD group showed higher COX-2 protein expression than that of the 20CD group (Fig. 3C). The levels of plasma NO concentration in the 40CD and 40RMD groups were similar to that of the 20CD group, and the levels in the 40WD, 40SD, and 40WMD groups were similar to that of the control group, 20C (Fig. 3D).
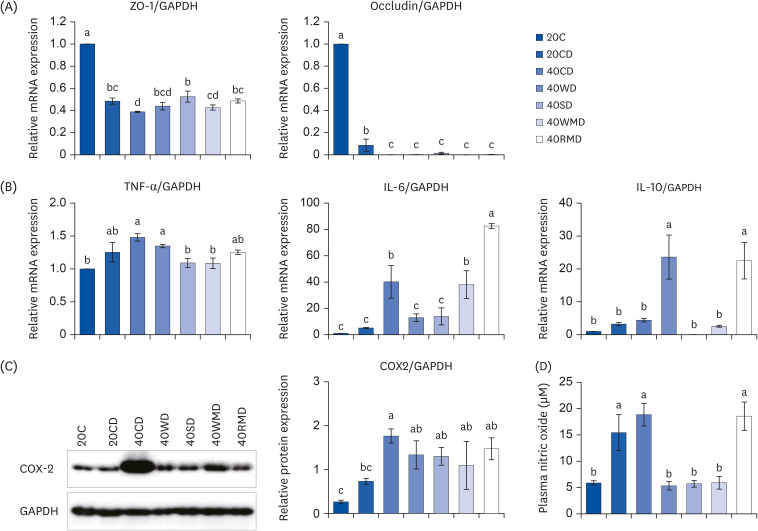 | Fig. 3The changes of inflammatory markers and tight junction protein on various sources of high protein diet fed DSS-induced colitis mice. Acute distal colitis was induced by DSS in drinking water. (A) The mRNA levels of ZO-1 and occludin which function tight junction were measured using RT-PCR. (B) The mRNA levels of TNF-α, IL-6, and IL-10 were measured using RT-PCR. (C) The inflammatory markers were determined by western blot with the appropriate antibodies. Data are presented as representative blots. The protein level of COX-2 was presented. The GAPDH level was used as a control. (D) The level of plasma NO was collected and examined as described in the Materials and Methods. Means with different letters are significantly different at P < 0.05% by Duncan’s multiple range test.mRNA, messenger RNA; ZO-1, zonula occludens-1; GAPDH, glyceraldehyde 3-phosphate dehydrogenase; 20C, 20% casein; 20CD, 20% casein-DSS; 40CD, 40% casein-DSS; 40WD, 40% whey protein-DSS; 40SD, 40% soy-DSS; 40WMD, 40% white meat-DSS; 40RMD, 40% red meat-DSS; TNF-α, tumor necrosis factor alpha; IL, interleukin; COX-2, cyclooxygenase; DSS, dextran sulfate sodium; RT-PCR, reverse transcription polymerase chain reaction.
|
The above results suggest that in DSS-induced colitis, the effects of the amount and source of protein on inflammation are varied (Table 3). Protein sources with high casein content (40C) showed the most severe effect on colonic tissue integrity and inflammatory mediator expression. Moreover, the 40RMD group showed increased IL-6 expression. The 40WD group showed downregulated IL-6 and upregulated IL-10 expression. TNF-α expression decreased in 40SD and 40WMD groups. Plasma NO levels decreased in 40WD, 40SD, and 40WMD groups.
Fecal profile
We next evaluated the degree of colitis according to the protein source through fecal analysis. Lcn-2, also known as neutrophil gelatinase-associated Lcn, is a protein expressed in neutrophils. It has been shown that Lcn-2 levels increase in response to inflammation as during colitis in both humans and mice [17]. Fecal Lcn-2 levels of 40CD (1,913 ± 397 ng/g feces) and 40WMD (1,737 ± 317 ng/g feces) groups significantly increased compared to those of the 20CD group (834 ± 388 ng/g feces) (Fig. 4A). Fecal Lcn-2 level of the 40SD group (1,267 ± 200 ng/g feces) was slightly elevated compared to that of the 20CD group, but there was no significant difference. However, Lcn-2 levels of 40WD (525 ± 126 ng/g feces) and 40RMD (169 ± 55 ng/g feces) groups were slightly lower than those of the 20CD group. Ammonia, the chief end product of nitrogen, is mainly produced by amino acid deamination [18] and causes crucial changes in gene expression in enterocytes [19], proliferation of colonic epithelial cells [20] and the promotion of colon tumor formation [21]. In the present study, the level of fecal ammonia in the 20CD group (2,797 ± 237 mM/g feces) was higher than the 20C group (1,253 ± 374 mM/g feces) (Fig. 4B). The fecal ammonia concentration of 40PD groups was higher than that of the 20CD group. Among the 40PD groups, 40SD (4,175 ± 154 mM/g feces), 40CD (4,013 ± 162 mM/g feces), 40WMD (3,955 ± 202 mM/g feces), and 40RMD (3,694 ± 41 mM/g feces) groups showed high fecal ammonia concentration; the 40WD group (3,470 ± 91 mM/g feces) showed the lowest fecal ammonia concentration.
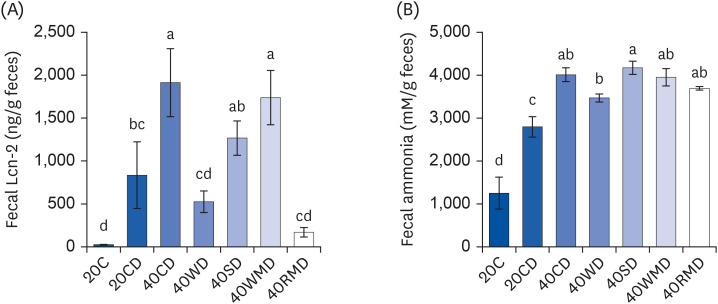 | Fig. 4Changes in Lcn-2 and ammonia levels in the feces of DSS-induced colitis mice fed high protein diet of various sources. Mouse feces for each experimental group were collected during the last 3 days of the colitis experiment. (A) The amount of Lcn-2 was measured in the feces of the mouse. (B) The level of ammonia on fecal samples was analyzed as described in the Methods and materials. Means with different letters are significantly different at P < 0.05% by Duncan’s multiple range test.Lcn-2, lipocalin-2; 20C, 20% casein; 20CD, 20% casein-DSS; 40CD, 40% casein-DSS; 40WD, 40% whey protein-DSS; 40SD, 40% soy-DSS; 40WMD, 40% white meat-DSS; 40RMD, 40% red meat-DSS; DSS, dextran sulfate sodium.
|
To evaluate the changes in microbial metabolites according to various dietary protein sources, we measured the concentration of SCFAs in feces and the mRNA expression of MCT1 and SMCT1, which are transporters of acetate, propionate, and butyrate in colorectal tissue. Fecal SCFA levels ofthe 20CD group were higher than thoseof the 20C group (Fig. 5A), and those of the 40PD feeding groups were higher than those ofthe 20CD group. Among the 40PD feeding groups, the levels of acetate, propionate, and butyrate were the highest in the 40WD group. The 40SD group (1.08 ± 0.056 mg/g feces) had a higher fecal propionate content than the 20CD group (0.63 ± 0.033 mg/g feces), and fecal butyrate content of the 40WMD (1.08 ± 0.034 mg/g feces), 40CD (1.07 ± 0.175 mg/g feces), 40SD (0.82 ± 0.083 mg/g feces), and 40RMD (0.79 ± 0.042 mg/g feces) groups washigher than that of the 20CD groups (0.51 ± 0.075 mg/g feces). The mRNA levels of MCT1 and SMCT1 in the DSS-administered groups were significantly lower than thoseof the 20C group (Fig. 5B). However, there was no significant difference between the 20CD and 40PD groups.
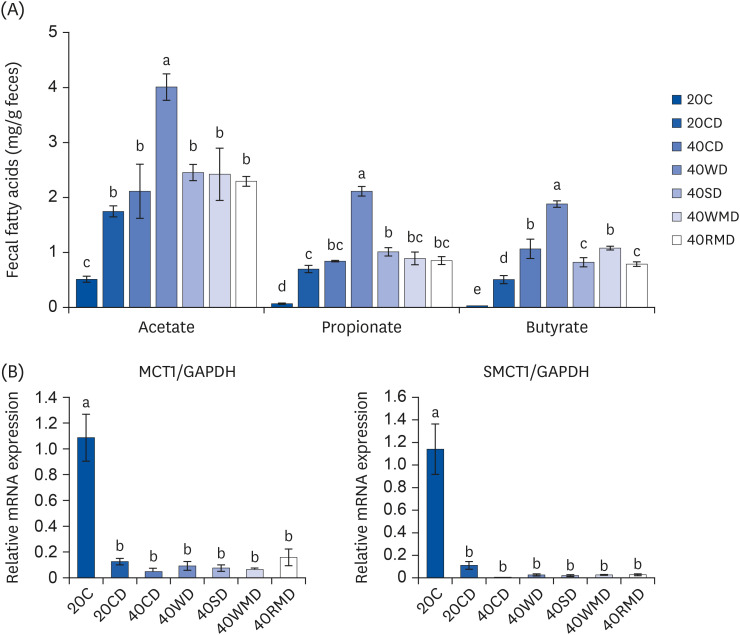 | Fig. 5The levels of fecal short-chain fatty acids in DSS-induced colitis mouse fed various sources of high protein diet. (A) The content of fecal short-chain fatty acids which include acetate, propionate, and butyrate, were measured. (B) The mRNA levels of (MCT1 and SMCT1 on colorectal tissue were measured using reverse transcription polymerase chain reaction. The GAPDH level was used as a control. Means with different letters are significantly different at P < 0.05% by Duncan’s multiple range test.20C, 20% casein; 20CD, 20% casein-DSS; 40CD, 40% casein-DSS; 40WD, 40% whey protein-DSS; 40SD, 40% soy-DSS; 40WMD, 40% white meat-DSS; 40RMD, 40% red meat-DSS; mRNA, messenger RNA; MCT1, monocarboxylate transporter 1; GAPDH, glyceraldehyde 3-phosphate dehydrogenase; SMCT1, sodium-coupled monocarboxylate transporter 1; DSS, dextran sulfate sodium.
|
Go to :
DISCUSSION
Cumulative evidences have shown that intake of HPDs, including red meat and processed meat, can be a risk factor for the development of colitis and CRC. However, the effects of different sources of proteins on colon inflammation vary. Therefore, in this study, we aimed to establish the risk level of various HPDs on colitis and to elucidate the possible mechanism underlying their effect in a mouse model of DSS-induced colitis.
Among the protein sources used in this study, casein exacerbated colitis signs and symptoms, including DAI, MPO activity, and inflammatory gene expression to the greatest extent (Table 3). Animals fed a 40C diet showed high mortality and reduced colorectal tissue integrity. It has been previously shown that feeding 50% casein diet increases tumor incidence, colonic COX-2 and inducible nitric oxide synthase expression [8], plasma NO and TNF-α levels, and the fecal ammonia level in a CRC mouse model (compared to diets with 20C) [6].
Next to casein, red meat aggravated colitis the most. In particular, IL-6 and plasma NO levels were the highest in the 40RMD group. According to a previous study, 30% red meat caused greater increase in the DAI and histopathology score of the colon in DSS-induced colitis mice compared to 20C [22]. At the same protein contents (16%) in diet, red meat caused higher tumor incidence and burden in 1,2-dimethylhydrazine (DMH)-challenged rats compared to casein-fed rats [1223]. Upon azoxymethane (AOM) treatment, more aberrant crypt foci (ACF) of the proximal colon were detected in 32% red meat-fed rats compared to that in 16% red meat-fed rats [13]. The levels of serum and tissue TNF-α and IL-1β were higher in high-fat and high-pork protein (45 and 40% calorie, respectively) fed rats than in high-fat and low-pork protein (45 and 20% calorie, respectively) fed rats [24].
Soy protein has been reported to have beneficial effects on colonic inflammation [1125]; in particular, isoflavone [26] and saponin [27] reduce inflammation of colonic mucosa and the risk of CRC incidence. Interestingly, in this study, although some of the inflammatory markers in the 40SD group were kept at the same level or were downregulated compared to the 20CD group, animal mortality and DAI were the high level in soy protein compared to other protein sources. In other reports, soy increases tumor incidence and burden in DMH-challenged rats compared to casein [1223]. Govers et al. [28] reported that dietary soybean protein increased colonic epithelial cell damage in rats compared to casein. These various effects of soy protein require further investigation. In the case of soybean agglutinin, it has been shown negatively affects intestinal structure, barrier function, mucosal immune system, and balance of the intestinal flora [29].
For whey protein, the 40WD group had one of the lowest mortalities among the 40P groups. Plasma NO levels were decreased; IL-10 level was the highest. In contrast, DAI and TNF-α expression increased in the 40WD group compared to the 20CD group. MPO activity and the level of IL-6 expression in the 40WD group were similar to those in the 20CD group. These results suggest that the effect of whey protein on colitis is weaker than that of other proteins. Tumor incidence and tumor burden have been reported to be lower in whey-fed rats than in casein-fed rats [122330]. In the study of Belobrajdic et al. [13], the number of ACF in the proximal and distal colon was lower in the 32% whey protein group than in the 16% whey protein group upon AOM treatment.
As opposed to red meat, white meat has anti-inflammatory effects with respect to colon inflammation and colon cancer [31]. In this study, the 40WMD group showed the lowest DAI and mortalities among the 40P groups. TNF-α and plasma NO levels were lower, and IL-10 level of the 40WMD group was similar to those in the 20CD group. The levels of fecal Lcn-2, fecal ammonia, MPO activity, and IL-6 of the 40WMD group was elevated compared to the 20CD group. However, in the study of Shi et al. [24], IL-6 and TNF-α levels in the serum and duodenum tissue were higher in high-fat and high-chicken protein (45% and 40% calorie, respectively) fed rats compared with high-fat and low-chicken protein (45% and 20% calorie, respectively) fed rats.
According to the results of this study, there were various effects depending on the protein source on the development of colitis. Protein sources are thought to individually and inconsistently influence each inflammatory indicator due to their respective protein properties. There seem to be 3 main reasons why each protein produces different effects at the level of several disease-related markers. First, because each protein source has its own characteristics. The harmful effects of red meat may be due to the presence of hemes, heterocyclic amines, N-nitroso compounds, polycyclic aromatic hydrocarbons and glycans [3233]. In particular, the presence of heme is the main difference between red and white meat [34]. In the case of soybeans contain both beneficial isoflavones and soy agglutinin, which negatively affects the gut health of animals [29]. Second, differences in digestibility and absorption rates of each protein source make different effects. The degree of digestion and absorption in the small intestine depends on the amino acid composition and protein properties, and this determines the total amount and composition of undigested protein delivered to the large intestine. Therefore, even if the same amount of protein is consumed, the amount of undigested protein that reaches the colon may vary, so different protein sources may have different effects on colitis. In this study, the food efficiency ratio of 40CD was the lowest among other protein sources during the DSS treatment period, which implicates the most undigested protein reach to the colon of mice. Third, the metabolite content in the feces resulting from protein fermentation differed with the protein source. SCFAs are mainly produced when carbohydrates are fermented by microbiota; however, proteins can also be metabolized to SCFAs by some bacteria. The reason for the increase in fecal SCFA contents in the colitis-induced group compared to that in the control group is not properly known. It appears that increasing concentration of these fecal fatty acids is not only due to colonic mucosal damage and reduced mucosal integrity by inflammation, but also insufficient absorption of microbial metabolites into the intestine. NH3 and other protein-derived metabolites in the lumen elicit inflammatory responses against the intestinal mucosa, which acts as a factor to reduce the expression of MCT1 [35]. In the colitis-induced group, there was a decrease in expression of transporters and an increase in fecal SCFA levels. However, there was no change due to protein sources in the mRNA expression levels of MCT1 and SMCT1 within the 40P group. These results suggest that the change in fecal metabolites in the 40P group can be attributed to protein digestibility rather than SCFA absorption. The protein content in the feces increased because plant protein (e.g., wheat gluten) was less digestible than animal protein (e.g., casein), and accordingly, the contents of SCFA and branched-chain amino acid in the feces increased, which was more affected by the type of protein than the content of the protein [36]. Meanwhile, a decrease in MCT1 expression can affect butyrate uptake into enterocytes, leading to butyrate accumulation in the lumen, and this 'cellular butyrate starvation' state is presumed to be one of the mechanisms responsible for IBD progression [37]. Future investigation on the association between protein digestibility and fecal metabolite contents will help to explain differential effects of various protein sources on mouse colitis presented in this study.
HPD exacerbated colitis regardless of the protein source compared to a normal protein diet. However, the severity of colitis and the mechanism underlying colitis exacerbation differed by protein source. The high casein group exhibited the most severe signs of colitis among the protein sources. Red meat and soy protein appear to exacerbate colitis overall, while whey protein and white meat slightly relieve the severity of colitis compared to other protein sources. Although there are several benefits of HPD, including weight control and muscle synthesis, regardless of the source, the adverse effects of HPD on colon health should be considered.
Go to :
 XML Download