

 PDF
PDF Citation
 Print
Print


INTRODUCTION
With a globally aging population, the United Nations (UN) anticipates that elderly people will double in 2050 [1]. Korea is one of the world's fastest aging countries [1]. According to recent statistics on the elderly from Statistics Korea, the Korean elderly with age over 65 yrs accounts for 15.7% of the population [2]. This is considered an “aged society” according to the standards of the UN. Aging is the major risk factor for most neurodegenerative diseases including many types of dementia [3].
Dementia, a syndrome of cognition decline, affects memory, thinking, behavior, and the ability of daily living [4]. Mild cognitive impairment (MCI) is an intermediate phase between normal cognition and dementia [5]. The National Institute of Dementia has estimated that 10.1% and 22.6% of elderly people in Korea are suffering from dementia and MCI, respectively [6]. With increasing prevalence, dementia imposes enormous economic cost on the Korean society [7]. Strategies to prevent and manage dementia are needed to reduce costs of healthcare systems. The exact treatment of dementia remains unclear [8]. Thus, it is crucial to modify risk factors for preventing the progression from MCI to dementia [9].
Diet is known to be able to prevent or delay cognitive decline or dementia by modifying some risk factors such as hypertension, diabetes, and obesity [10]. Some studies have reported associations between single nutrient or food and cognitive decline or dementia. Recent studies have also reported associations of multi-nutrients or dietary patterns with cognitive decline or dementia [11].
The Recommended Food Score (RFS) is one of the diet quality indices and it was constructed from foods recommended in the American dietary guidelines [12]. Kim et al. [13] modified the RFS based on Korean dietary guidelines and foods rich in antioxidant nutrients. The modified RFS had inverse associations with urinary malondialdehyde (MDA) as a biomarker of oxidative stress and the risk of type 2 diabetes [1314].
The Mediterranean Diet Score (MDS) was a dietary index of adherence to the Mediterranean diet, which was developed by Willett et al. [15]. Kim et al. [13] made alternative Mediterranean Diet Score (aMDS) by modifying MDS based on the Korean diet. A prospective study has shown positive associations of the Mediterranean Diet and Dietary Approaches to Stop Hypertension (DASH) diet with cognitive function [16]. which emphasizes natural plant-based foods and limited red meat consumption [17]. A systematic review has reported the Mediterranean Diet can protect or improve the cognitive function [18]. In addition, the Mediterranean Diet can decrease mortality of patients with Alzheimer's disease (AD) [19].
Overall, most studies have been conducted overseas to examine the association of RFS or MDS with cognitive function [20]. To the best of our knowledge, only limited studies have explored the association between dietary pattern and cognitive function in Korea [2122]. Therefore, the aim of this study was to investigate the association of RFS and aMDS with the risk of MCI in Korean elderly people.
SUBJECTS AND METHODS
Study population
This cross-sectional study used data collected from Yangpyeong cohort study between July 2009 and August 2010. The study population consisted of 1,638 participants aged over 60 yrs old dwelling in Yangpyeong. Of these participants, those who were evaluated with the Korean version of the Mini-Mental State Examination (MMSE-KC) were selected (n = 808), while those who reported energy intake of less than 500 kcal/day were excluded (n = 2). Finally, a total of 806 subjects (340 men and 466 women) were analyzed for this study. All procedures were conducted according to the Institutional Review Board (IRB) of Hanyang University (HYI-12-038-revision2). Written informed consent was obtained from all subjects.
General characteristics and anthropometric variables
An interview was performed to collect information on gender, age, education level, living status, social status, drinking consumption, smoking, use of supplement, and medical history by well-trained interviewers. Data on height, weight, and waist circumference were measured and body mass index (BMI) was calculated as body weight/height2 (kg/m2).
Dietary assessment
All subjects were interviewed by trained interviewers. Dietary intake was estimated with a 106-item food frequency questionnaire (FFQ). This FFQ reflected 1-yr frequencies of food items and mean portion sizes of their food consumption. Food frequency categories consisted of ‘never or less than once per month,’ ‘once per month,’ ‘2–3 times per month,’ ‘1–2 times per week,’ ‘3–4 times per week,’ ‘5–6 times per week,’ ‘once per day,’ ‘2 times per day,’ and ‘3 times per day.’ Portion size categories consisted of ‘0.5 serving,’ ‘1 serving,’ and ‘1.5 serving’ presented with photographs. We investigated the period of fruit intakes, which could be affected by seasonal consumption. All nutrient intakes were total energy adjusted by residual method.
RFS
The RFS was developed by Kant et al. [12]. The RFS emphasizes the consumption of recommended foods by dietary guidelines. In this study, we used the modified version of RFS reported by Kim et al. [13] based on the consumption of foods high in antioxidant nutrients [13]. The modified RFS consists of one component of regular meal intake and 46 components of recommended food items such as whole grains (1), legumes (4), vegetables (17), seaweeds (2), fruits (12), fish (5), dairy products (3), nuts (1), and tea (1). Subjects could get 1 point if they regularly ate 3 meals or consumed recommended food items at least once a week. Total score was the sum of scores from all 47 components. The maximum score was 47, with a higher score indicating a greater quality of diet.
aMDS
The MDS was developed by Willett et al. [15] as a dietary index of adherence to the Mediterranean diet. It included 9 components of vegetables, legumes, fruits and nuts, cereal, fish, meat, poultry and dairy products, alcohol, and the ratio of monounsaturated fatty acid to saturated fatty acid [15]. According to results of some studies related to the risk of chronic disease, modified MDS by Fung et al. [23] excluded potato from vegetables, removed dairy products, separated fruits and nuts into different groups, included whole grain products only for cereal, included red and processed meats only for meat, and assigned alcohol consumption between 5 and 15 g per day for 1 point [23]. In this study, we used the aMDS reported by Kim et al. [13]. The aMDS included laver and kelp/sea mustard as vegetables and multigrain rice as whole grain products. It excluded the ratio of monounsaturated fatty acid to saturated fatty acid and nuts because of their frequency in Korean consumption or the lack of their dietary information in a diet [13]. Subjects could get one point if they consumed vegetables, legumes, fruits, fish, whole grains above the median consumption among the total study participants. In addition, subjects could get one point if they consumed red and processed meats less than the median consumption of subjects or alcohol consumption was between 5 and 15 g per day. Total score was the sum of scores from 7 components. The maximum score was 7, with higher score indicating a greater diet quality.
Cognition assessment
Cognition was evaluated using MMSE-KC [24]. The MMSE-KC included orientation (10 items, 10 points), memory (1 item, 3 points), attention (1 item, 5 points), delayed recall (1 item, 3 points), language (2 item, 3 points), executive function (1 item, 3 points), construction (1 item, 1 point), and judgement (2 items, 2 points). Total score ranged from 0 to 30 points, with a higher score indicating a better cognitive function. The subjects were classified by MMSE-KC criteria according to age, gender, and education. The normal cognitive group was classified if MMSE-KC scores ≥ −1.5 SD of the mean MMSE-KC score. The MCI group was classified if MMSE-KC scores < −1.5 SD of the mean MMSE-KC score [25].
Statistical analysis
All statistical analyses were performed using SAS version 9.4 (SAS Institute Inc., Cary, NC, USA). Categorical variables were presented as frequency and percentage. Continuous variables were presented as mean and SD. χ2 test for categorical variables and t-test for continuous variables were used to compare general characteristics of subjects. One-way analysis of variance (ANOVA) for continuous variables and χ2 test for categorical variables were used to compare general characteristics of subjects across quintiles of diet quality score. General linear model was applied to determine nutrient intakes across quintiles of diet quality score. Tukey's multiple comparison was used for post-hoc analysis to determine group differences. Multivariable logistic regression was used to determine the adjusted odds ratio with 95% confidence intervals (CIs) between each diet quality index and the risk of MCI. Model 1 was adjusted for age, gender, and education. Model 2 was adjusted for age, gender, education, exercise, living status, social activity, and alcohol drinking. All tests were 2-sided and P < 0.05 was considered statistically significant.
RESULTS
General characteristics
General characteristics of study subjects are shown in Table 1. Mean ages of men and women were 68.2 ± 5.4 yrs and 67.6 ± 5.3 yrs, respectively. Men had higher height and weight, but had lower BMI than women. Men were more educated, lived with spouse or family more, participated in social activity more often, had more current drinkers, and current smokers than women. The proportion of hypertension diagnosed was lower in men than in women. There were no significant differences in waist circumference, exercise, dietary supplement use, diagnosis of diabetes mellitus, diagnosis of stroke, diagnosis of cardiovascular disease, or diagnosis of hyperlipidemia between men and women.
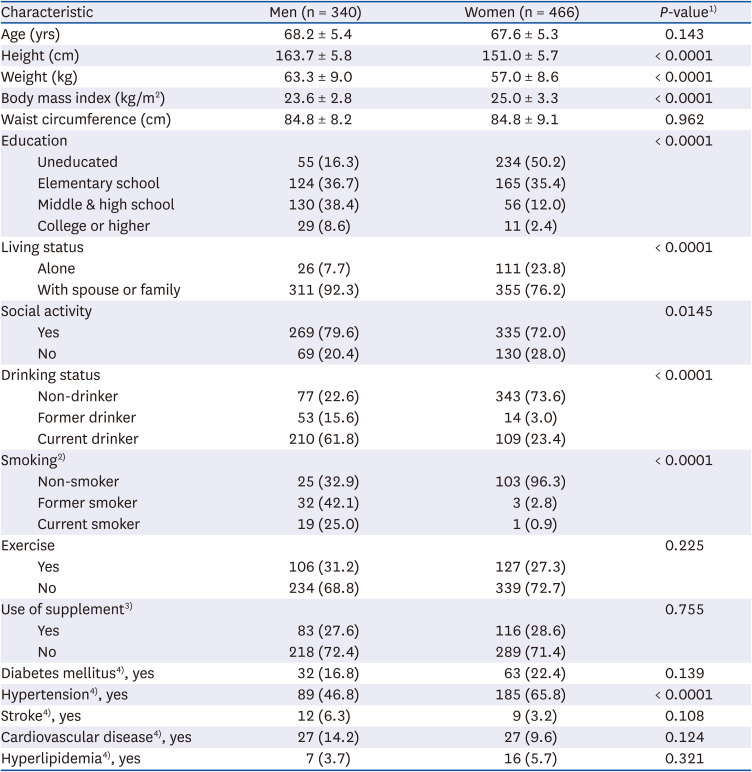
Table 1
General characteristics of study subjects
Data are presented as number (%) or mean ± SD.
1)t-test for continuous variables and χ2 test for categorical variables.
2)Smoking (n = 183).
3)Use of supplement (n = 706).
4)Diabetes mellitus, hypertension, stroke, cardiovascular disease, and hyperlipidemia (n = 471).
![]()
Table 2 presents general characteristics of subjects according to the quintile of each diet quality. Subjects with higher RFS and aMDS had higher height and weight. They were likely to be men, younger, and more educated. Subjects with high RFS and aMDS were less likely to live alone, were more socially active, exercised more, and took more dietary supplements than those with low RFS and aMDS.
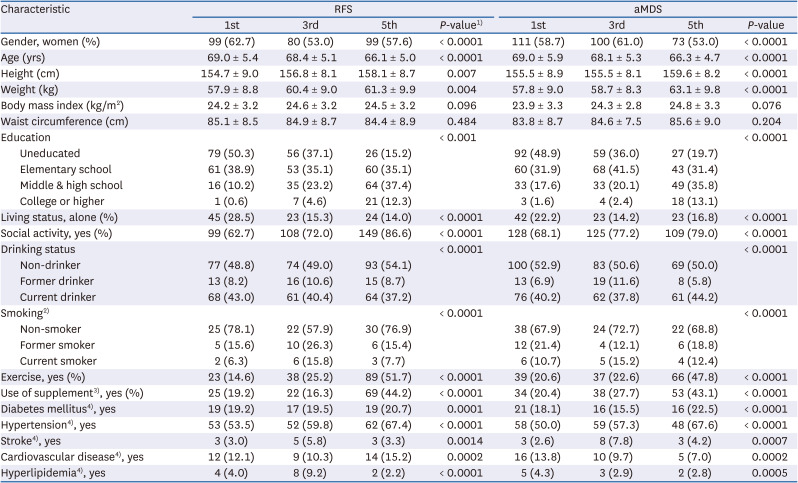
Table 2
General characteristics of study subjects by quintile of RFS and aMDS
Data are presented as number (%) or mean ± SD.
RFS, Recommended Food Score, aMDS, alternative Mediterranean Diet Score.
1)χ2 test for categorical variables and analysis of variance (ANOVA) for continuous variables.
2)Smoking (n = 183).
3)Use of supplement (n = 706).
4)Diabetes mellitus, hypertension, stroke, cardiovascular disease, and hyperlipidemia (n = 471).
![]()
Nutrient intakes according to RFS and aMDS
Nutrient intakes of study subjects by quintiles of RFS and aMDS are shown in Table 3. Subjects with higher RFS consumed higher nutrient intakes except for energy and carbohydrate intakes. Subjects with highest RFS consumed the lowest carbohydrate intakes. Subjects with higher aMDS showed higher nutrient intakes except for saturated fat. There were no significant differences in carbohydrate, all fat, and monounsaturated fat intakes according to quintiles of aMDS.
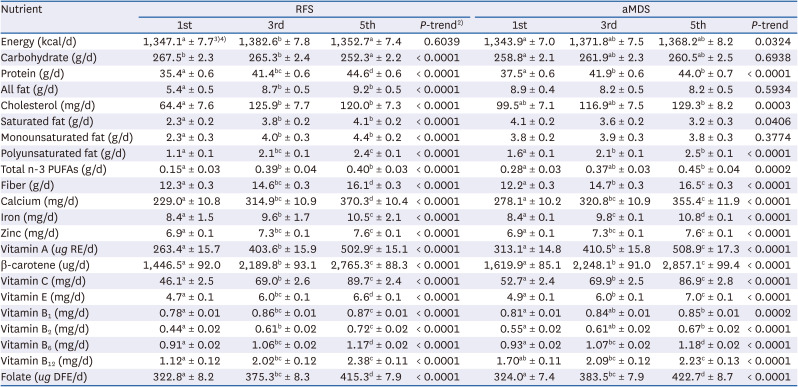
Table 3
Nutrient intake of study subjects by quintile of RFS and aMDS1)
RFS, Recommended Food Score; aMDS, alternative Mediterranean Diet Score PUFAs, polyunsaturated fatty acids.
1)Adjusted for total energy intakes, age, and gender.
2)P-trend by general linear model.
3)LS mean ± SE.
4)Tukey's multiple comparison. Mean values within a column with unlike superscript letters were significantly different.
![]()
MMSE-KC scores according to RFS and aMDS
Averages of MMSE-KC scores by RFS and aMDS are demonstrated in Table 4. Model 1 was adjusted for age gender, and education, Model 2 was adjusted for age, gender, education, exercise, living status, social activity, and alcohol drinking.
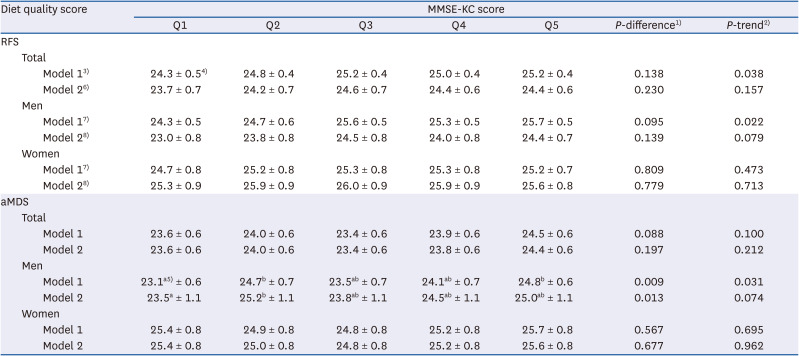
Table 4
Average of MMSE-KC score by quintile of RFS and aMDS
MMSE-KC, Korean version of Mini-Mental State Examination; RFS, Recommended Food Score; aMDS, alternative Mediterranean Diet Score.
1)P-difference by general linear model.
2)P-trend by general linear model.
3)Adjusted for age, gender, and education.
4)LS mean ± SE.
5)Tukey's multiple comparison. Mean values within a column with unlike superscript letters were significantly different.
6)Adjusted for age, gender, education, exercise, living status, social activity, and alcohol drinking.
7)Adjusted for age and education.
8)Adjusted for age, education, exercise, living status, social activity, and alcohol drinking.
![]()
In total subjects and men, averages of MMSE-KC scores tended to increase as the RFS level increased in Model 1. In men, averages of MMSE-KC scores tended to increase as the aMDS level increased in Model 1. However, these significant trends disappeared in Model 2. Any significant trends were not found in women.
Adjusted odds ratios (ORs) and 95% CI of MCI according to RFS and aMDS
Adjusted ORs and 95% CI of MCI by RFS and aMDS are shown in Table 5. In total subjects, higher adherence to RFS and aMDS were associated with a lower risk of MCI. There was a significant inverse relationship between RFS and risk of MCI after adjusting for age, gender, education, exercise, living status, social activity, and alcohol drinking (Q5 vs. Q1; OR, 0.49; 95% CI, 0.28–0.83; P for trend = 0.010). aMDS was inversely associated with the risk of MCI after adjusting for age, gender, education, exercise, living status, social activity, and alcohol drinking (Q5 vs. Q1; OR, 0.51; 95% CI, 0.29–0.89; P for trend = 0.132). In men, aMDS was inversely related to the risk of MCI after adjusting for age, education, exercise, living status, social activity, and alcohol drinking (Q5 vs. Q1; OR, 0.36; 95% CI, 0.15–0.83; P for trend = 0.127). Any significant associations were not found in women.
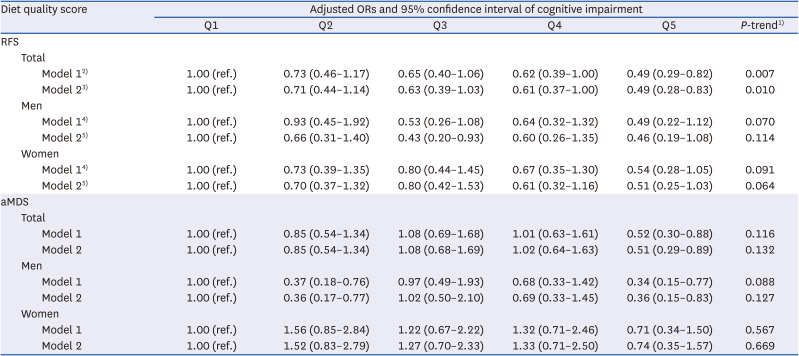
Table 5
Adjusted ORs and 95% CI of mild cognitive impairment by quintile of RFS and aMDS
OR, odds ratio; CI, confidence interval; RFS, Recommended Food Score; aMDS, alternative Mediterranean Diet Score.
1)OR and 95% CI were obtained using multiple logistic regression analysis.
2)Model 1: adjusted for age, gender, and education.
3)Model 2: adjusted for age, gender, education, exercise, living status, social activity, and alcohol drinking.
4)Model 1: adjusted for age and education.
5)Model 2: adjusted for age, education, exercise, living status, social activity, and alcohol drinking.
![]()
DISCUSSION
This cross-sectional study of old adults in Yangpyeong, Korea examined the associations of RFS and aMDS with the risk of MCI. A greater adherence to the RFS was associated with a lower risk of MCI after adjusting for age, gender, education, exercise, living status, social activity, and alcohol drinking in total subjects. The RFS was developed to measure diet quality based on dietary diversity. Previous studies have reported that higher dietary diversity is associated with higher cognitive function [26] and that higher diversity of vegetable and fruit intakes is associated with higher cognitive functions including executive, memory, and attention [27]. Unlike other diet quality indices, the RFS included a question for eating 3 meals per day. With a previous finding showing that eating breakfast has a beneficial effect on cognitive function in memory (particularly delayed recall) and attention [28], eating 3 meals per day including breakfast might result in better MMSE-KC scores.
aMDS was inversely associated with the risk of MCI after adjusting for age, gender, education, exercise, living status, social activity, and alcohol drinking in total subjects and men. A prospective cohort study reported that higher aMDS was associated with slower cognitive decline in Chinese older adults [29]. This study suggested that some common ground between the Chinese diet and the Mediterranean diet, including a high intake of plant foods and low intake of fat and meats, despite differences in the use of oil sources and the low intake of dairy products, might be attribute to these significant findings [29]. In the present study, the partial correlation coefficient between aMDS and MMSE-KC in men was 0.227 (P < 0.0001), which was higher than 0.150 (P = 0.001) in women. Due to the relatively high correlation of men, aMDS was significantly associated with the risk of MCI only in men. A follow-up study is needed to determine whether there was a gender difference in the relationship between diet quality score and the risk of MCI.
Over the last several decades, the deposition of Tau protein and amyloid precursor protein in the brain has been reported as the main pathological hallmark of AD [30]. It has been widely recognized that the amyloid cascade hypothesis explains the critical mechanism of the pathogenesis of AD and the accumulation of amyloid-β (Aβ) peptides triggers AD [31]. Results from a cross-sectional study have suggested that higher adherence to the Mediterranean Diet and higher vegetable intake are associated with lower Aβ levels in the brain and better neuroimaging biomarkers [32]. Oxidative stress is also considered as a major risk factor in AD pathogenesis and progression [33]. When redox-active metal ion like copper binds to the Aβ peptide, reactive oxygen species is produced, which may lead to oxidative damage to the Aβ peptide itself and surrounding molecules including proteins, lipids, and DNA [33]. Inflammation plays an important role in the pathogenesis of atherosclerosis, which is a risk factor for dementia and associated with neurodegenerative diseases such as AD, clinical dementia, and cognitive decline [34].
Our results revealed that MCI was inversely associated with RFS and aMDS. Previous studies have found that higher adherence to RFS and aMDS are associated with higher intake of antioxidant-rich foods counteracting oxidative and inflammatory stress [1335]. Our results also showed that higher RFS and aMDS were associated with higher intakes of antioxidants such as vitamin A, β-carotene, vitamin C, and vitamin E. Consequently, associations of lower risk of MCI with higher RFS and aMDS could be explained by reduction of oxidative stress. Higher adherence to aMDS were also associated with lower C-reactive protein (CRP) and interleukin levels, which were markers of inflammation and endothelial dysfunction [19]. A previous review has also suggested that an anti-inflammatory and antioxidants diet might decelerate inflammation and AD progression [36]. Our results supported associations of the highest adherence to RFS and aMDS with the highest intakes of total n-3 fatty acids, which have anti-inflammatory effects. In addition, those with higher RFS and aMDS showed higher intakes of most nutrients, which were energy-adjusted. Therefore, adequate nutrient intake in older adults may positively influence cognitive function.
Our study had some limitations. First, this was a cross-sectional study using baseline Yangpyeong cohort data. Thus, this analysis could not provide causality of RFS and aMDS with the risk of MCI. Second, we could not assess the relationship of cognitive function with depression because only 83 subjects were assessed for depression. A previous review has suggested that depression in older adults can cause cognitive impairment [37]. Therefore, further studies are needed to examine the relationship of cognitive function with psychological symptoms including depression. Third, there was a possible recall bias. Participants could misreport their portion sizes of their food consumption when assessing their dietary intakes from FFQ. In addition, older adults with MCI may have poor memory, which may affect RFS and aMDS. Fourth, participants of our study might not represent all Korean elderly people because they were living in Yangpyeong, a rural area of Korea. Compared to those living in urban and metropolitan locations, those living in rural area had lower education levels, lower income, and different dietary patterns [38]. Therefore, our findings cannot be generalized to all Korean older population.
Nevertheless, literature on the relationship between diet quality scores and cognitive function in Korean older adults is limited. Previous studies conducted in Korea used their own analyses such as K-means cluster analysis and reduced rank regression analysis to assess the diet [2122]. In addition, other studies using a diet quality tool in Korea investigated the relationship with oxidative stress [13], physical activity [39], and metabolic syndrome [40], not cognitive function.
In conclusion, the risk of MCI was lower as the diet quality measured by RFS and aMDS increased in the total subjects. However, when analyzed by gender, aMDS was only associated with the risk of MCI in men, and no significant correlation was found in women.
Further studies are needed to support the casual relationship between diet quality and the risk of MCI. In addition, a follow-up study on dietary quality and cognitive function according to gender is needed.
 XML Download