

 PDF
PDF Citation
 Print
Print


INTRODUCTION
The elderly population aged 65 yrs and above in South Korea is expected to increase from 7.07 million in 2017 to 10 million in 2025 and to 18.27 million in 2067. The super-aged population aged 85 yrs and above is expected to increase from 600,000 in 2017 to over 1 million in 2024 and to 5.12 million in 2067, with an expected increase of 8.6 times compared with 2017. In addition, in 2020, elderly households represented by a householder aged 65 yrs and above accounted for 22.8% of all households, and in 2047, it is expected to account for 49.6%, which is almost half of all households [1]. Social and economic problems are occurring worldwide due to an increase in the aging population, and according to a UN report, the relative poverty rate of South Korea's retirement age group (over 66 yrs) was the highest among OECD member countries [2]. With the increase in the elderly population, the economic difficulties and health problems faced by the elderly are also emerging as social issues. The health of the elderly is important in maintaining their quality of life in their old age, with their diet becoming an essential factor that directly affects their health.
Congregate meal services are a representative service provided by the senior welfare center, a leisure welfare facility for the elderly. As the need for welfare of the elderly increases in an aging society, congregate meal services become one of the center’s more important projects. As of 2019, 391 congregate meal services are in operation [3]. Most of the elderly who make use of congregate meal services at senior welfare centers do so for meals each day, which contribute to the elderly's health maintenance [4]. It has been reported that compared with the elderly who do not use these services, those who do have a better nutritional intake and improved health [5]. To improve the quality of congregate meal services, it is necessary to provide a diet comprising meat, vegetables, and fruits, which are difficult for the elderly to consume on a daily basis owing to economic difficulties and discomfort from chewing [6].
Senescence is a period of many social changes, in addition to the deterioration of physical and mental health. The reduction in social support and social capital leads to social isolation and depression, which cause a loss of appetite, ultimately putting the elderly at nutritional risk [7]. There is a significant association between oral health and food intake in the elderly. Poor oral health affects food intake, narrows the range of food choices available, and causes indigestion, thus negatively affecting their nutritional status [89]. As the number of their remaining teeth decreases, the number of food items they can consume also decreases, and the average intake of calories, saturated fat, and cholesterol that they ingest tends to increase [10]. In previous studies, the elderly who did not wear orthodontic appliances ate more diverse foods of better quality compared with those with poor oral health; thus, the latter had a higher risk of malnutrition [711].
The nutrition quotient (NQ) is a validated checklist that comprehensively evaluates the nutritional and dietary status of individuals and groups, where nutritional indices have been developed for preschool children [12], school-age children [13], adolescents [14], adults [15], and the elderly [16]. The nutrition quotient for the elderly (NQ-E) is a tool whose reliability and validity has been verified to evaluate the quality and nutritional status of congregate meal services for those aged 65 yrs and above in terms of balance, diversity, moderation, and dietary behavior [16]. A comparison of the NQ-E according to gender and health functional food intake of the elderly from a senior welfare center in Gyeonggi-do was conducted [17]. In addition, a study on the factors affecting the NQ-E in the elderly living alone [18], a nutrient intake analysis according to the NQ-E of the elderly in Seoul [19], and a comparison of the NQ-E according to general information about the elderly in the Jecheon region [20] were conducted.
While the oral health and nutritional status of the elderly are evaluated as important factors in maintaining their quality of life, no studies to date have been conducted to evaluate the NQ-E of the elderly according to their oral health status. This study aimed to evaluate the nutritional status and dietary of the elderly using the NQ-E and to analyze the differences in the NQ-E for the elderly according to the different levels of oral health. In addition, this study intended to provide basic data necessary for effective dietary and nutritional management to promote the health of the elderly using congregate meal services.
Go to : 
SUBJECTS AND METHODS
Study population
A pilot survey was conducted with 20 elderly people aged 65 yrs and above who used congregate meal services, and the questionnaire was revised and supplemented based on the results. In this study, 150 elderly people aged 65 yrs and above were selected by convenience sampling in 3 Seoul-based senior welfare centers that provided congregate meal services. Trained investigators directly visited the centers to explain the purpose of the study and response methods and conducted an interview from January 15 to 26, 2018. The data collected from a total of 123 questionnaires were used for the final analysis, excluding insincere responses. This study was conducted after obtaining approval from the the Institutional Review Board of University D (1040647-201612-HR-010-03).
Instrument development
The questionnaire comprised 3 domains: oral health status, general characteristics, and nutritional index for the elderly. Oral health status was evaluated by 7 items on a 5-point Likert scale (1: strongly disagree to 5: strongly agree). The items were on subjective health status, toothache, periodontal problems, dry mouth, bad breath, discomfort in chewing food, and discomfort in pronunciation. The general items comprised 7 items, including age, educational attainment, medication, number of extant teeth, dentures, and whether or not dental examinations were performed in the past year [2122]. The NQ-E was developed by the Korean Nutrition Society and comprised 4 factors and a total of 19 items: 4 items on balance, 6 on diversity, 3 on moderation, and 6 on dietary behavior [16].
Statistical analysis
The collected data were analyzed using SPSS Statistics (ver. 24.0; IBM Corp., Armonk, NY, USA). Basic statistics, such as frequency, mean, and standard deviation, were calculated for each survey item. Based on the average of the total oral health scores (3.7 points), the higher-scoring group was classified as the high group and the lower-scoring group, the low group. The t-test and chi-square tests analysis were performed to determine the difference between the 2 groups. The NQ-E score was calculated out of 100 points by multiplying each of the 19 item scores for NQ measurement by the individual nutritional index item weight within NQ and then summing them up [16]. The resulting score was classified into 4 grades based on the percentile value estimated from the elderly survey data. A subject was considered part of the high group if the score was in the 75–100% percentile (63.5–100 score), in the medium-high group if the score was in the 50% to < 75% percentile (57.6–63.4 score), in the medium group if the score was in the 25% to < 50% percentile (51.9–57.5 score), and in the low group if the score was in the 0% to < 25% percentile (0–51.0 score) [16]. T-tests and chi-square tests were performed to analyze the differences in the NQ-E scores and grades of the 2 groups according to their oral health scores and their scores for each NQ-E factor.
Go to :
RESULTS
Oral health conditions of the subjects
Table 1 shows the analysis results of the oral health status of those aged 65 yrs and above who use congregate meal services. The overall average score for the oral health of the subjects was 3.70 (out of 5). Based on the average value, the oral health score was divided into the high group and low group. The average of the group with the low oral health score was 2.89, and the average of the group with the high oral health score was 4.42. Bad breath was considered the least problematic issue by the respondents, with an average of 3.97 points (low group: 3.39 points, high group: 4.47 points), while their subjective oral health status was the most problematic, with an average of 3.26 points (low group: 2.30 points, high group: 4.15 points). There was a statistically significant difference between the 2 groups in all oral health items (P < 0.001).
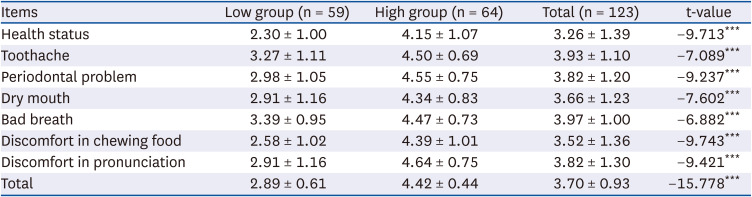
Table 1
Oral health condition of respondents
Data are presented as mean ± SD.
A 5-points Likert scale was used from 1 (strongly disagree) to 5 (strongly agree).
***P < 0.001.
![]()
Demographic characteristics of the subjects
Table 2 shows the demographic characteristics of the 123 subjects comprising the high and low oral health condition groups. The low group comprised 61.0% females and 37.3% males, while the high group comprised 62.5% females and 35.9% males, indicating no significant difference in the gender distribution between the groups. In the low group, 33.9% were aged 75–79 yrs; 28.8%, 80–84 yrs; 22.0%, 70–74 yrs; 10.2%, 65–69 yrs; and 5.1%, 85 yrs and above. In the high group, 57.8% were in their 70s, 23.5% were in their 80s or older, 48.4% graduated from middle and high school, and 37.5% graduated from elementary school. There were multiple answers for medications being taken, the most common being for hypertension (51.2%), followed by hyperemia and arthritis (25.2%), diabetes (17.1%), gastrointestinal disorders (11.4%), and anemia (2.4%), while 25.2% accounted for drugs for other conditions. Approximately 11.4% were not taking any medication. The number of extant teeth was significantly different between the low and high groups (P < 0.001). In the low group, the majority of the subjects had 6–10 teeth (25.4%), and in the high group, 30.1% had 21 or more teeth. The subjects who used dentures showed no significant difference between both groups, with 50.8% in the low group and 31.3% in the high group. Oral examinations were received by 50.4% in the past year, and there was no significant difference between the low and high groups.
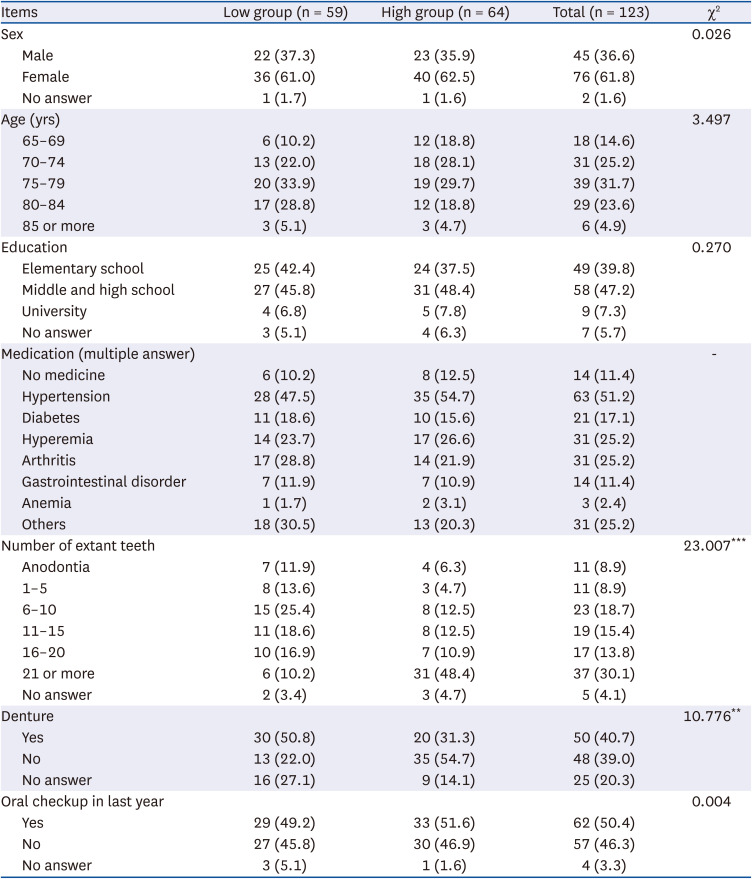
Table 2
General characteristics of respondents
![]()
Comparison of NQ checklist items
Table 3 presents the survey results regarding food intake frequency and dietary behavior using the 19 items of the NQ-E. The balance domain comprised 4 items, and there was no significant difference according to the oral health score in any of the items. Regarding the frequency of dairy consumption, “less than once every 2 wk” was the highest at 32.0%, followed by “once a day” at 27.0% and “1 to 3 times per week” at 25.4%. As for fruit intake, 39.0% answered “once a day,” 22.0% answered “1 to 3 times per week,” 16.3% answered “4 to 6 times per week,” 13.8% answered “twice a day,” and 8.9% answered “less than once every 2 wk.” As for snacks, 42.9% answered “once a day,” and 33.6% answered “never.” For water, “3 to 5 times a day” was the most common answer, accounting for 42.3%.
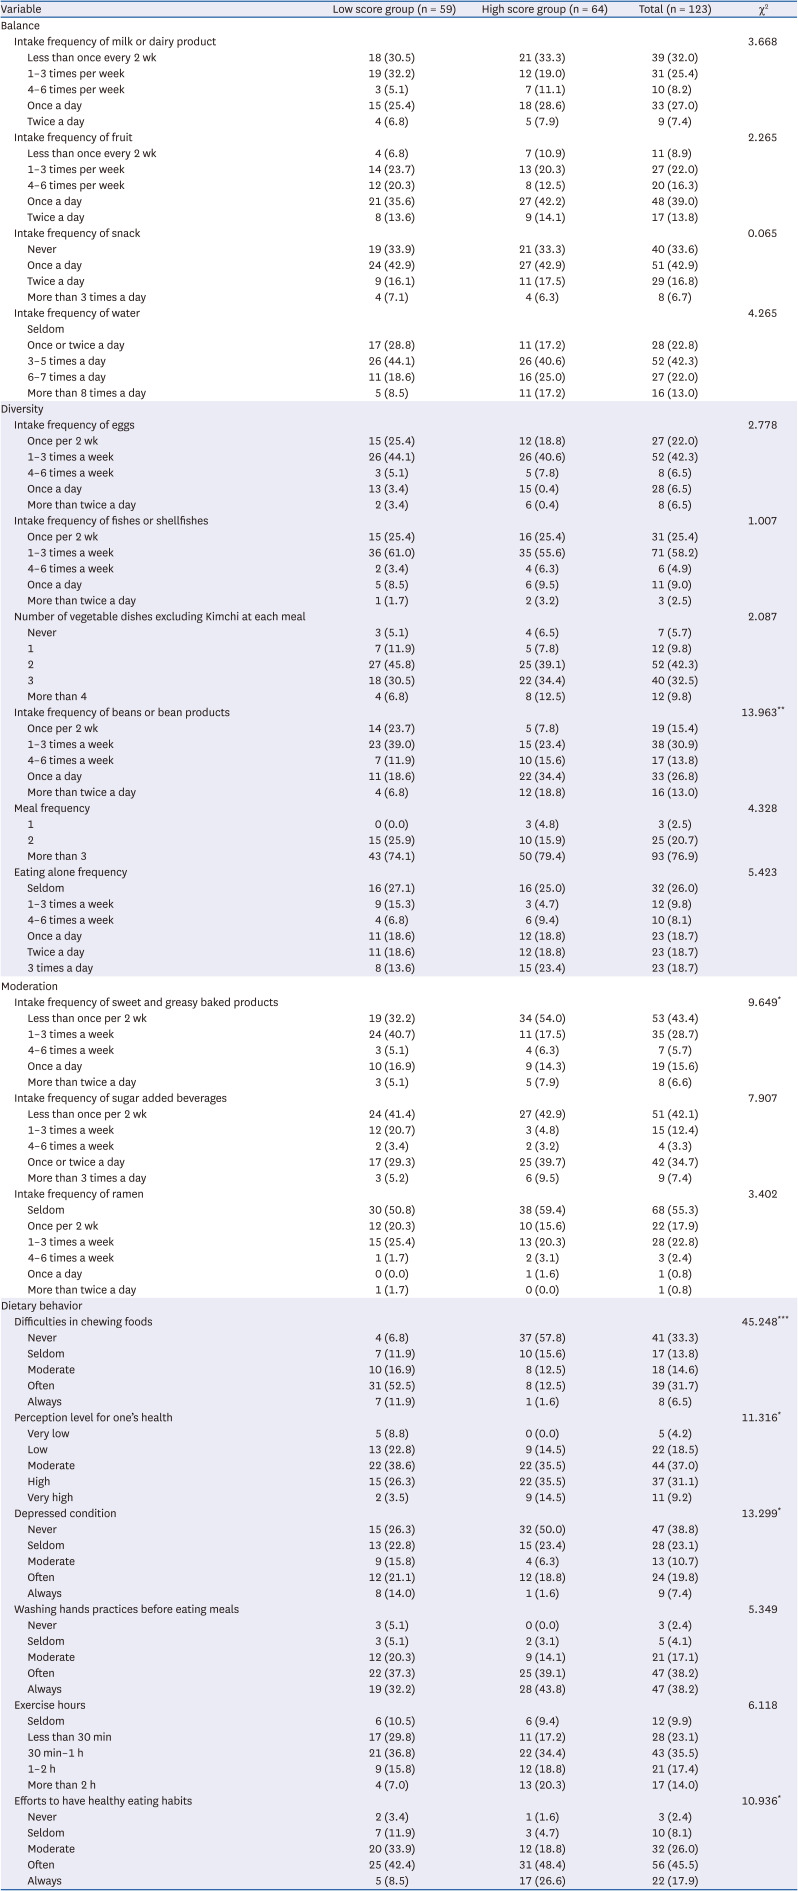
Table 3
Comparison of nutrition quotient checklist items according to oral health condition
![]()
The diversity domain comprised 6 items, and significant differences according to oral health scores were found only in the frequency of beans or bean products (P < 0.01). As a result of the survey on the frequency of egg consumption, 42.3% of the subjects answered that they eat 1 to 3 times a week, while 22.2% said that they eat less than once every 2 wk. In terms of frequency of fish intake, 58.2% answered “1 to 3 times a week,” and 25.4% answered “less than once a week.” The intake of vegetables, including kimchi at meals, was 42.3% for “2 kinds” and 32.5% for “3 kinds,” indicating a relatively good vegetable intake. In the case of soybean intake, “1 to 2 times a week” accounted for 30.9% and “once a day” for 26.8%. In the group with low oral health scores, “1 to 3 times a week” was the highest at 39.0%, and in the group with high oral health scores, “once a day” was the highest at 34.4%; this was significantly different (P < 0.01). As for the number of meals, 76.9% answered “3 or more times a day,” indicating that they ate regularly. On the other hand, the frequency of eating alone was the highest for “almost never” at 26.0%, while “eating alone at least once a day” accounted for 56.1%.
The moderation domain comprised 3 items, and there was a significant difference according to the oral health score in terms of the consumption of sweets or greasy products (P < 0.05). As for the frequency of consumption of sweets or greasy products, 43.4% replied “once a week or less,” 28.7% replied “1 to 3 times a week,” and 15.6% replied “once a day.” In the group with low oral health scores, “1 to 3 times a week” was the highest at 40.7%, and in the group with high oral health scores, 54.0% answered “once a week or less.” As for sugar-sweetened beverages, 42.1% answered “once every 2 weeks or less,” and 34.7% answered “1 to 2 times a day.” Regarding instant noodles, “I rarely eat” was the most common answer at 55.3%, followed by “1 to 3 times a week” at 22.8% and “once every 2 wk” at 17.9%.
The dietary behavior domain comprised 6 items, and there were significant differences in all of the items except for handwashing before meals and exercise. Regarding the discomfort of chewing due to teeth problems, 31.7% answered “not uncomfortable,” and 33% answered “not uncomfortable at all.” In the group with low oral health scores, 52.5% of the group complained of chewing discomfort as “uncomfortable” and 11.9% as “very uncomfortable,” while 57.8% of the group with high oral health scores showed no discomfort at all, showing a significant difference (P < 0.001). Regarding their perception of their health, 37.0% answered “average,” and 31.1% answered “I'm in good health.” In the group with low oral health scores, 31.6% answered “I'm not healthy” or “'I'm not healthy at all,” showing a significant difference between the groups (P < 0.05). An average of 38.8% answered “I do not feel depressed at all,” with 50.0% from the group with high oral health scores and 26.3% from the group with low oral health scores, demonstrating that there were fewer participants in the group with high oral health scores who suffered from depression (P < 0.05). Regarding handwashing before meals, 38.2% answered “I wash my hands,” and 38.2% answered “I wash my hands all the time.” Regarding exercise, 35.5% replied “within 30 min to 1 h per day;” 23.1%, “within 30 min;” 17.4%, “within 1–2 h;” and 14.0%, “more than 2 h.” “I try to eat a healthy diet” was the most common answer at 45.5%. In the group with low oral health scores, 8.5% replied “I try very hard,” and in the group with high oral health scores, 26.6% replied similarly, although there was a significant difference (P < 0.05).
NQ scores of subjects according to their oral health conditions
Table 4 presents the nutritional index scores and scores for each domain according to the oral health scores of the elderly subjects. The average NQ-E score of the subjects was 58.7 out of 100, and the grading standard for the NQ-E score was “medium-high.” For each sub-domain, the average scores were 46.0 points for balance, 47.0 points for diversity, 72.9 points for moderation, and 61.8 points for dietary behavior. When looking at the sub-domain scores, balance was judged as “medium-high,” diversity as “medium-low,” moderation as “medium-low,” and dietary behavior as “medium-high.”
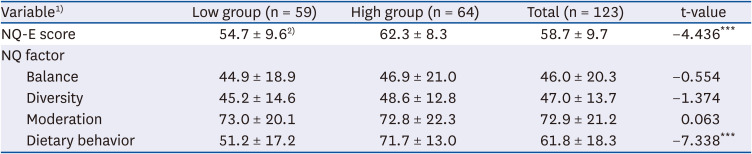
Table 4
NQ score and factor score of subject according to oral health condition
Data are presented as mean ± SD.
NQ, nutrition quotient; NQ-E, nutrition quotient for the elderly.
1)Maximum score is 100.
2)Cut-off points: NE-E score 57.6, balance 41.4, diversity 50.0, moderation 76.5, and dietary 55.0.
***P < 0.001.
![]()
For the NQ-E score, the low group showed 54.7 points, while the high group showed 62.3 points, indicating that the high group had a significantly higher score (P < 0.001). The score of the high group was higher than the reference value (57.6 points) and was thus judged as “favorable.” Looking at the scores for each domain according to the oral health score, the balance score was 44.9 points for the low group and 46.9 points for the high group; thus, there was no significant difference in the scores between the 2 groups. Both groups were found to be “favorable” in terms of balance, as they were both higher than the reference value (41.4 points). In terms of diversity, the low group scored 45.2 points while the high group scored 48.6 points, indicating that there was no significant difference in the scores between the 2 groups. However, both scores were lower than the reference value (50.0 points), indicating a “need to monitor.” In terms of moderation, the low group scored 73.0 points while the high group scored 72.8 points; thus, there was no significant difference in scores between the 2 groups. However, again, both scores were lower than the reference value (76.5 points), indicating a “need to monitor.” In terms of dietary behavior, the low group scored 51.2 points while the high group scored 71.7 points; only the high group scored higher than the reference value (55.0 points), which suggested a “favorable” state and that the score for the high group was significantly higher (P < 0.001). The group with high oral health scores showed a “favorable” nutritional status in terms of the NQ-E, balance, and dietary behavior, while the group with low oral health scores were “favorable” only in terms of balance, indicating that their nutritional status and quality of life were found to be different according to their oral health.
Distribution of the 4-grade criterion of the NQ of subjects according to the level of their oral health conditions
Table 5 shows the distribution of NQ grades according to the oral health levels of the elderly subjects. NQ grades and sub-domain grades were divided into high (75–100%), medium-high (50% to < 75%), medium-low (25% to < 50%), and low (0–25%) categories [16]. NQ grades were classified differently depending on the subject, and they were divided into 4 grades for preschool children [12], 4 for school-age children [13], 3 for adolescents [14], 3 for adults [15], and 4 for the elderly [16]. In the case of the NQ-E scores, the group with high oral health scores was distributed as follows: 47.4% (n = 27) in the “high” grade, 28.1% (n = 16) in the “medium-high” grade, and 15.8% (n = 9) in the “medium-low” grade. The group with low oral health scores was distributed as 36.5% (n = 19) in the “low” group, 25.0% (n = 13) in the “medium-high” group, and 23.1% (n = 12) in the “medium-low” group, indicating a significant difference in the distribution between the 2 groups (P < 0.001). In terms of balance, 36.4% (n = 43) had a “high” grade, 23.7% (n = 28) had a “medium-high” grade, 22.0% (n = 26) had a “medium-low” grade, and 17.8% (n = 21) had a “low” grade, with no significant difference in the grade distribution between the high and low oral health groups. In terms of diversity, 32.8% (n = 39) had a “medium-low” grade, 31.1% (n = 37) had a “low” grade, 18.5% (n = 22) had a “high-medium” grade, and 17.6% (n = 21) had a “high” grade, with no significant difference in the distribution of grades between the high and low oral health groups. In terms of moderation, 36.4% (n = 44) had a “low” grade, 30.6% (n = 37) had a “high” grade, 19.8% (n = 24) had a “medium-high” grade, and 13.2% (n = 16) had a “medium-low” grade, with no significant difference in the grade distribution between the high and low oral health groups. In terms of dietary behavior, in the high oral health group, 72.1% (n = 44) had a “high” grade, 18.0% (n = 11) had a “medium-high” grade, and 6.6% (n = 4) had a “medium-low” grade. In the low oral health group, 49.4% (n = 23) accounted for the “low” group, 22.8% (n =13) for the “medium-high” group, and 19.3% (n = 11) for the “medium-low” group, showing a significant difference in the distribution between the 2 groups (P < 0.001). The group with good oral health had the highest ratio of high dietary behavior scores, while the group with poor oral health had the highest ratio of low dietary behavior scores, with a large difference in the dietary behavior of the elderly according to their level of oral health.
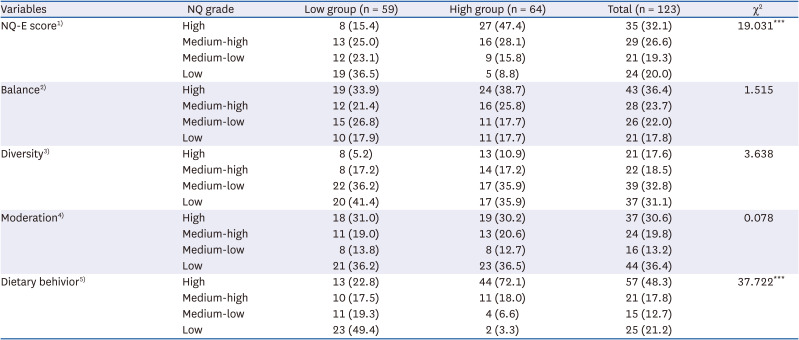
Table 5
Distribution of the 4 grade criterion of NQ of subjects according to the level of oral health condition
NQ, nutrition quotient; NQ-E, nutrition quotient for the elderly.
1)High: 63.5–100, medium-high: 57.6–63.4, medium-low: 51.9–57.5, low: 0–51.8.
2)High: 55.2–100, medium-high: 41.6–55.1, medium-low: 25.8–41.5, low: 0–25.7.
3)High: 60.0–100, medium-high: 50.5–59.9, medium-low: 40.3–50.4, low: 0–40.2.
4)High: 91.5–100, medium-high: 76.3–91.4, medium-low: 67.8–76.2, low: 0–67.7.
5)High: 64.9–100, medium-high: 55.1–64.8, medium-low: 42.2–55.0, low: 0–45.1.
***P < 0.001.
![]()
Go to :
DISCUSSION
The elderly population is increasing because of the extension of life expectancy and low birth rate. Congregate meal services provided at senior welfare centers are one of the projects conducted in the local community. In previous studies, there is a significant relationship between oral health and food intake in the elderly. Thus, this study evaluated the nutritional status and dietary behavior of 123 elderly people over 65 yrs of age who use congregate meal services. We employed the NQ-E and analyzed their differences according to their oral health scores. The group with high oral health scores had a “favorable” nutritional status in terms of the NQ-E, balance, and dietary behavior, while the group with low oral health scores had a “favorable” nutritional status only in terms of balance, demonstrating a difference in nutritional status and quality according to oral health.
Oral health is very important because the oral cavity is the first step in the digestive process of ingesting and degrading food through chewing and plays an important role in maintaining a good quality of life. In the elderly population, oral health conditions can cause problems with chewing ability, restrict food selection and intake [23], and cause physical problems, such as indigestion and malnutrition [242526], that may affect their quality of life [27]. As for the subjective evaluation of the status of masticatory ability as perceived by the elderly population themselves, it was found that as their age increased, their discomfort with mastication also increased [28]. Even after controlling for demographic, economic, and health-related factors, it was found that oral health had a large effect on the nutritional status of the elderly [7]. A small number of remaining teeth or a large number of missing teeth causes disturbances in food intake, limiting the range of food choices and reducing the quantity and quality of meals of the elderly, in turn affecting their health maintenance [29]. It has been reported that oral diseases and mastication-related problems increase with age and decrease the quality of life [30].
The intake of all nutrients and food groups was significantly lower in the elderly with difficulty chewing compared with those who were comfortable with mastication [31]. The elderly with mastication difficulties preferred soft food, prioritizing food that would be easier to masticate over those with good nutritional value [32]. Those who perceived their oral health as poor had a low preference for all foods except grains, oils, and sugars; those with chewing and chewing problems had a low preference for all foods; and those with speech discomfort had a low preference for all foods except oils and sugars [33]. The elderly with good oral health preferred vegetables and fruits [34], and it has been reported that the higher the number of existing natural teeth, the higher the intake of iron, potassium, thiamine, riboflavin, niacin, vitamin C, and protein [35]. It has also been reported that tooth loss in the elderly causes chewing function deterioration, interferes with regular eating, and reduces the intake of food that is difficult to chew [36]. Older people with oral health problems have a lower preference for hard-to-chew vegetables, fruits, and meat, which leads to decreased intake and an imbalance in nutritional status [24].
The balance domain comprised the frequency of consuming milk and other dairy products, fruit, daily snacks, and water. In a previous survey of the elderly at the senior welfare center, the highest frequency was “once a day” for milk and other dairy products, “1 to 3 times a week” for fruits, “never” for snacks, and “3 to 5 times a day” for water. Water intake was similar to the results of this study [20]. For milk, 33.5% accounted for “almost never drink” and 30.8% for “once a day”; for fruits, 40.0% for “once a day”; for snacks, 65% for “at least once a day;” and for water, 45.4% for “3 to 5 times a day,” which were similar to the current study except for snack intake [37]. From a study on the eating habits of elderly women, milk showed the highest rate of “1 to 2 times a week” at 63.6%, while 64.1% had “0 to 2 times a week” of consumption of snacks [38]. Consumption of milk and other dairy products should be encouraged because dairy intake lowers the incidence of diabetes [39]. In addition, increasing calcium intake through dairy consumption reduces or delays bone mineral density loss in old age [40]. As a result of the analysis of snack intake patterns in the elderly, the elderly preferred to consume grains and fruits with high carbohydrate content as snacks. Unfortunately, an increase in carbohydrate consumption through snacks is undesirable for the nutritional status of the elderly despite the supplementation of their total energy intake [41]. In previous studies on the elderly, it was found that the elderly preferred fruit as snacks [42]. The water intake of the elderly living in rural areas was significantly insufficient compared with those living in urban neighborhoods. Since water intake is very important in old age, a sufficient intake is recommended [43].
The diversity domain comprised items such as eggs, fish, shellfish, vegetable dishes excluding kimchi at each meal, beans or bean products, and meal frequency. In a study by Park [37], the proportion of subjects who answered “more than 2 kinds of vegetables except for kimchi” at mealtime was 79.7% for the 65–74-yr-olds and 67.4% for the 75-yr-old-and-above group, indicating that the 65–74-yr-olds consumed significantly more vegetables during mealtimes (P < 0.05). As a result of the survey on the consumption of vegetables among elderly women, 40.4% responded “3 to 5 times a week” while 34.3% responded “6 to 7 times a week.” For the regularity of meat, fish, egg, and legume consumption, “0 to 2 times a week” was the most common answer at 55.1%, followed by “3 to 5 times a week” at 33.8% [38]. According to the 2013–2017 National Health and Nutrition Examination Survey data, the average daily protein intake was 69.2 and 58.0 g/day for men aged 64–75 yrs and 75 yrs and above, respectively, and 49.6 and 37.7 g/day for women aged 65–74 yrs and 75 yrs and above, respectively. For 65–74-yr-olds, the intake exceeded 100% of the average requirement. In the case of women aged 75 yrs and above, particularly, it was found that the intake was less than the average requirement. Thus, sufficient protein intake in old age should be prioritized [44]. In addition, the elderly population needs sufficient protein to preserve their muscle mass and to prevent sarcopenia [45]. It is important to consume 20 g or more protein at each meal [46]. Older people decrease their food consumption due to a reduced income, reliance on food support, and monotonous food intake due to the hassle of cooking, resulting in decreased dietary diversity. Therefore, a meal support program that includes meals for the elderly is required for the elderly who have difficulties consuming a variety of foods. The fifth National Health and Nutrition Examination Survey showed that 97.0% of the elderly subjects ate 3 meals a day [47], while the seventh National Health Statistics showed that 5.7% of the population over 65 yrs of age in South Korea skipped breakfast [48]. In a study on whether the elderly ate together with other people [49], the rate of eating all meals alone was high among those aged 65–74 yrs, and the proportion of eating breakfast and dinner alone was high among those aged 75 yrs and above. As a result of comparing the frequency of eating alone according to income levels, low-income elderly had a higher rate of eating alone, although there was no difference according to income level due to the expansion of welfare service provision in the form of communal meals, such as those given in senior welfare centers and senior citizen centers for lunch [50]. In Japan, the importance of having someone to eat with is emphasized for the elderly, and a policy was proposed to provide a place where the elderly can eat together [51]. In this study, 54.1% of people ate alone more than once a day. Thus, it is necessary to ensure the provision of meals at senior welfare centers and senior community centers to enable the elderly to have a meal together at least once a day.
The moderation domain comprised 3 items: sweet and greasy baked products, sugar-added beverages, and the frequency of consumption of instant noodles. As a result of a survey on the frequency of consumption of sugary drinks among the elderly eating at senior welfare centers [37], 41.2% “rarely eat” sweet and greasy baked products, 46.2% consumed sweetened drinks “1 to 2 times a day,” and 50.0% “rarely” consumed instant noodles, which was similar to the results of this study except for the intake of sugary drinks. As a result of examining the types of snacks preferred by the elderly, candy, confectionery, and bread were found to be highly preferred after fruits [52]. Coffee was analyzed as the main source of energy intake for the elderly [53]. As for the consumption of carbonated drinks by elderly women, 94.4% answered that they consumed carbonated drinks “0 to 2 times,” 5.6%, “3 to 5 times,” and 0.0%, “6 to 7 times,” indicating that the elderly hardly consumed carbonated drinks [38]. As for the taste of food preferred by the elderly, “light food” took up the highest proportion, while “sweet food” and “oily food” were the least preferred [54].
The dietary behavior domain comprised 6 items: difficulties in chewing food, perception level of one’s health, depressed condition, washing hands before eating meals, exercise hours, and healthy eating habits. The elderly with chewing problems adversely affect food intake, thereby worsening nutrition and health status, and negatively affecting subjective health status perception [8955]. In addition, they are subject to symptoms of indigestion and decreased chewing ability due to tooth loss, which is a cause of starvation [42]. The elderly who have a less-than-average iron intake tend to have a low health-related quality of life, masticatory discomfort, and a negative effect on subjective health status perception. Depression is a major threat to the quality of life in the elderly. The subjective health status of the elderly gets better as they engage in aerobic physical exercise, have low stress levels, are not depressed, and have no activity restrictions [55]. For the elderly living alone, the higher the depression score, the higher the nutritional risk, and the lower the exercise score, the higher the nutritional risk [56]. In addition, the elderly reported that they have no desire to purchase, to cook, or to consume food to maintain a proper nutritional status when they have depressive symptoms [57]. For washing hands before meals, 61.7% of the elderly using congregate meal services answered that they always wash their hands, indicating that hand washing before meals was performed better than that in this study. The elderly subjects of this study were striving for a healthier diet than the elderly eating at senior citizen centers [20].
As a result of evaluating nutritional status with the NQ-E in this study, it was found that the average NQ-E score was 58.7 points, with 46.0 points in the balance domain, 47.0 points in the diversity domain, 72.9 points in the moderation domain, and 61.8 points in the dietary behavior domain. In a study [19] targeting the elderly in some areas of Seoul, the NQ-E was 61.9 points, which was higher than the NQ-E of this study. In the case of the domains (for detailed domains: balance, 47.3 points; diversity, 42.7 points; moderation, 88.5 points; and dietary behavior, 57.9 points), the score in the diversity and dietary behavior domains of this study was higher than that of the elderly in some areas of Seoul.
In a study [20] targeting the elderly in Jecheon, the NQ-E score was 53.9 points (balance domain, 43.8 points; diversity domain, 47.1 points; moderation domain, 69.1 points; and eating behavior domain, 49.9 points), which were generally lower than those of the subjects of this study. In a study [18] involving the elderly in 17 provinces, the NQ-E score was 51.1 points (for detailed domains: balance, 29.3 points; variety, 41.4 points; moderation, 77.0 points; and eating behavior, 46.3 points); the subjects in this study had higher scores in all of the domains except for moderation. In a study [19] targeting elderly people in Gyeonggi-do, the scores were lower than those in this study except for the dietary behavior domain. The average NQ-E score of the subjects of this study was higher than the national NQ-E score of 57.6 points in the study by Chung et al. [16]. In addition, all of the sub-domain results (balance, 41.4 points; diversity, 50.0 points; moderation, 76.5 points; and dietary behavior, 55.0 points), yielded higher scores except for dietary behavior.
The NQ-E score (62.3 points) of the group with high oral health scores was higher than the nationwide elderly NQ-E score [16], and the NQ-E score (54.7 points) of the group with low oral health scores was lower than the nationwide elderly score. There was a significant difference in the NQ-E score according to oral health (P < 0.001), and the group with low oral health scores also had a low nutritional index score, indicating that the group with poor oral health was analyzed to have low nutritional status and poorer management. According to the NQ-E criterion (57.6 points) [16], the group with high oral health scores had a “favorable” condition, while the low oral health group was classified as a “need to monitor” group. According to a study by Lee et al. [15], the “favorable” group had a significantly higher intake of potassium and vitamin C than the “need to monitor” group, and it was analyzed that their nutritional intake status was better. In this study, the NQ-E (62.3 points) of the group with high oral health scores showed a higher score than that in most previous studies [16181920]. It has been reported that the elderly eat different foods depending on their oral health and that the elderly with chewing difficulties mainly choose foods that are easy to chew, leading to a reduced intake of fruits and vegetables and an imbalanced nutrient intake [24]. Many previous studies related to oral health found that the oral health of the elderly affects their chewing of food, causing problems with their digestion and absorption of meals as well as leading to nutritional imbalances [585960].
In terms of the NQ-E score, the high oral health group had an average of 62.3 points, which was distributed as 47.4% (n = 27) in the “high” group, 28.1% (n = 16) in the “medium-high” group, and 15.8% (n = 9) in the “medium-low” group. The low oral health group had an average score of 54.7 points, with 36.5% (n = 19) in the “low” group, 25.0% (n = 13) in the “medium-high” group, 23.1% (n = 12) in the “medium-low” group, and 15.4 (n = 8) in the “high” group. There was a significant difference in the distribution between groups (P < 0.001).
Aging, nutrition, and quality of life are interdependent. As age increases, discomfort due to mastication increases, owing to which the range of food choices becomes limited. This leads to a reduction in the quality of meals and quality of life, thereby affecting health maintenance. This study evaluated NQ-E according to oral health conditions and determined whether nutritional status and dietary quality were good depending on oral health status. In addition, scores were calculated for 4 domains of balance, diversity, moderation, and dietary behavior depending on oral health status to be used for the systematic nutritional management of the elderly. The NQ-E score (62.3 points) of the group with high oral health scores was higher than the reference value (57.6 points), which was “favorable,” whereas the NQ-E score (54.7 points) of the group with low oral health scores was lower than the reference value, thus identified as “need to monitor,” indicating that the elderly with poor oral health have a low quality of meals and nutritional status. Concerning the NQ domain scores, the elderly with good oral health status had “favorable” results in terms of balance and dietary behavior, and the elderly with poor oral health status had “favorable” results only in terms of balance. Overall, several dietary areas needed improvement in general. Those with poor oral health conditions urgently needed to improve related factors to minimize the risk of increasing imbalanced nutrition and comorbidities due to insufficient nutrition and undesirable eating habits. Therefore, our results could contribute in improving the nutritional status and eating habits of the elderly as they emphasize providing congregate meal services and developing a manual for nutrition education and counseling.
To improve the nutritional status and eating habit of the elderly, it is necessary to encourage them to practice such behaviors in their daily lives by providing dietary education, nutrition counseling, and high-quality customized congregate meal services. The elderly population in South Korea is increasing rapidly, and interest in elderly nutrition is also growing. Therefore, various applications of the NQ-E are expected in the future. This study has limitations in reflecting the real eating habits because the subjective judgment of the elderly is conducted as a self-reported evaluation. However, since the NQ-E is a tool whose reliability and validity have been verified, it is believed that if research is conducted on the elderly of different classes in the future, the dietary status of the elderly will be identified. Also, this study has a limitation in that it cannot represent the daily diet of the elderly in the whole of South Korea by simply surveying the elderly who use senior welfare centers in Seoul. Hence, this is insufficient to secure objective data. In future studies, the NQ-E can be used as primary data for preparing policies to improve the health of the general elderly as well as elderly using congregate meal services by identifying trends in their dietary behavior.
Go to :
 XML Download