Journal List > Nutr Res Pract > v.16(Suppl 1) > 1516079337

Ndahimana, Kim, Wang, and Kim: Energy cost of walking in older adults: accuracy of the ActiGraph accelerometer predictive equations

Abstract

BACKGROUND/OBJECTIVES

Various accelerometer equations are used to predict energy expenditure (EE). On the other hand, the development of these equations and their validation studies have been conducted primarily without including older adults. This study assessed the accuracy of 8 ActiGraph accelerometer equations to predict the energy cost of walking in older adults.

SUBJECTS/METHODS

Thirty-one participants with a mean age of 74.3 ± 3.3 yrs were enrolled in this study (20 men and 11 women). The participants completed 8 walking activities, including 5 treadmill and 3 self-paced walking activities. The EE was measured using a portable indirect calorimeter, with each participant simultaneously wearing the ActiGraph accelerometer. Eight ActiGraph equations were assessed for accuracy by comparing the predicted EE with indirect calorimetry results.

RESULTS

All equations resulted in an overall underestimation of the EE across the activities (bias −1 to −1.8 kcal·min−1 and −0.7 to −1.8 metabolic equivalents [METs]), as well as during treadmill-based (bias −1.5 to −2.9 kcal·min−1 and −0.9 to −2.1 METs) and self-paced (bias −1.2 to −1.7 kcal·min−1 and −0.2 to −1.3 METs) walking. In addition, there were higher rates of activity intensity misclassifications, particularly among vigorous physical activities.

CONCLUSIONS

The ActiGraph equations underestimated the EE for walking activities in older adults. In addition, these equations inaccurately classified the activities based on their intensities. The present study suggests a need to develop ActiGraph equations specific to older adults.

INTRODUCTION

According to a recent 2017 United Nations report on the world’s aging population [1], globally, the number of people aged 60 yrs and over has increased from 382 million in 1980 to 962 million in 2017 and is expected to reach approximately 2.1 billion by 2050. This rapid demographic change has implications for global health and the economy [2] because aging is associated with an increased risk of chronic non-communicable diseases [34]. There is currently strong research interest regarding suitable approaches to promote more healthy aging by reducing the risks of morbidity and mortality associated with non-communicable diseases in older adults [56].
The role of physical activity (PA) in health promotion is well established, including the prevention and management of chronic non-communicable diseases, such as type-2 diabetes, cardiovascular disease, and cancer [789]. In older adults, PA promotes cognitive health [10], and recent evidence suggests that it may prevent or slow down sarcopenia [1112]. The measurements of PA and energy expenditure (EE) are important in both clinical and epidemiological studies on the association between PA and health outcomes.
During the assessment of PA in public health interventions, researchers are interested in the estimation of EE and the classification of PA according to intensity level [13]. The PA intensity is also taken into consideration in the guidelines for the population. For example, the 2010 World Health Organization (WHO) guidelines for PA [14] recommended that individuals aged 65 yrs and over perform at least 150 min of moderate-intensity aerobic PA per week or perform at least 75 min of vigorous-intensity aerobic PA per week or an equivalent combination of moderate- and vigorous-intensity activity. The ability of an instrument to measure the PA intensity accurately helps evaluate the adherence to interventions and assess the impact of the amount of PA on health.
Different methods are currently being used to assess PA and EE. Each has its advantages and limitations related to cost, accuracy, or burden placed on the participants [1516]. Recently, accelerometers have been developed as monitors of PA. These tools have proven to be reliable, objective, less burdening to the participants, versatile, and less expensive than other methods of a PA assessment [17]. Accelerometers measure acceleration and produce outcomes in the form of counts. These counts can be translated into EE variables, such as kcal or metabolic equivalents (METs) using predictive equations developed by the manufacturers [18] or by researchers in subsequent studies [19]. The development and validation of these equations have been conducted mostly in younger subjects, with few studies involving older adults [2021]. On the other hand, studies have shown that the energy cost of physical activities is affected by age, with older adults having higher energy costs than younger individuals when examined under similar conditions [222324].
In this context, there is a need to assess the impact of such differences in the energy metabolism across age categories on the ability of accelerometer equations to estimate EE accurately. The objective of this study was to assess the accuracy of 8 accelerometer equations for predicting the energy cost of walking by older adults.

SUBJECTS AND METHODS

Study participants

The present study involved 31 older adults (20 men and 11 women) aged between 70 and 83 yrs. They were recruited from Gangneung City, Gangwon Province, Korea, using flyers displayed at senior citizen centers, and by direct visits to these places. The following inclusion criteria were applied: 1) age 65 yrs or older, 2) no contraindications to exercise, and 3) being physically able to complete the activities, including treadmill walking. The protocol was approved by the Gangneung-Wonju National University Institutional Review Board (approval number GWNUIRB-2015-4-1), and every participant read and signed an informed consent form.

Anthropometric measurements

Before testing, the participants’ height and body weight were measured (without shoes and wearing light clothes) using a stadiometer. The BMI was calculated as the body mass (kg) divided by height squared (m2).

Testing protocol

The testing protocol was adopted from Hall et al. [22], with some modifications. During the testing session, each participant performed walking activities in 2 sessions, starting with session 1 and then session 2, after a resting time of at least 5 min between sessions.
  • Session 1: Treadmill walking, which was divided into 5 bouts, corresponding to 5 different speeds: 2.4 km·h−1 (1.5 mph), 3.2 km·h−1 (2.0 mph), 4.0 km·h−1 (2.5 mph), 4.8 km·h−1 (3.0 mph), and 5.6 km·h−1 (3.5 mph). The treadmill gradient was held constant at 0% during the entire routine [22].

  • Session 2: Self-paced hallway walking activities, which were divided into 3 bouts: “leisurely” walking, “brisk” walking, and “fast” walking. For the leisurely pace, the participants were instructed to “walk as if they were walking and talking with a friend”; for the brisk pace, the instructions were to “walk as if they were hurrying across the street at a cross-walk”; for the fast pace, the instructions were to “walk as fast as they could but not so fast that they felt unsafe” [22].

For both activity sessions, each bout was performed for 5 min, with at least 5 min of quiet sitting between bouts until the participant’s heart rate returned to within 4 beats per minute of their resting heart rate [22]. This resting time between 2 sessions of activities was to allow the participants’ heart rate to slow down.
During the treadmill walking activities, 2 participants were unable to complete the 5.6 km·h−1 bout, while among the self-paced hallway walking, one participant did not perform the bouts of leisurely and brisk walking, and 7 participants were unable to complete the fast walking bout. During each testing interval, the participants simultaneously wore a portable indirect calorimeter and the ActiGraph accelerometer.

Indirect calorimetry

The participants wore a Cosmed K4b2 portable indirect calorimeter (Cosmed, Rome, Italy). A detailed description of the Cosmed K4b2 is reported elsewhere [25]. The instrument weighed 1.5 kg, including the battery and its specially designed harness, which allowed it to be fitted securely to the participant. The Cosmed K4b2 uses a breath-by-breath gas exchange measurement system that has been validated by both the Douglas bag method [26] and the traditional, stationary gas exchange system [27]. Before starting each routine, the K4b2 was warmed up for 30 min, followed by the calibration according to the manufacturer’s guidelines. After the room air calibration, the reference gas calibration was conducted using 16% oxygen and 5% carbon dioxide. Next, a flow turbine was calibrated using a 3-liter syringe (Hans-Rudolph, Inc., Shawnee, KS, USA). A delay calibration was then performed to adjust the lag time between the expiratory flow measurement and the gas analyzers.

ActiGraph accelerometer

The ActiGraph accelerometer GT3X+ (ActiGraph, Pensacola, FL, USA) is a small (4.6 × 3.3 × 1.5 cm), lightweight (19 grams), water-resistant tri-axial accelerometer. This monitor measures acceleration in the vertical, anteroposterior, and mediolateral planes. This has been validated in different studies [282930]. Before each testing session, the ActiGraph was initialized according to the manufacturer’s specifications, and the epoch length was set to 10 s. The activity counts were scaled up to 1 min before applying the ActiGraph equations to calculate the EE and METs. During the measurements, the accelerometer time was synchronized with a digital clock to ensure synchronized data collection between the monitor and the K4b2 indirect calorimeter. The monitor was worn on the right waist using a nylon belt supplied by the manufacturer. During the activity time, researchers continuously verified that the belt tightly fitted the participant’s hip. At the end of each measurement session, ActiGraph data were downloaded to the computer for analysis.

Predictive equations

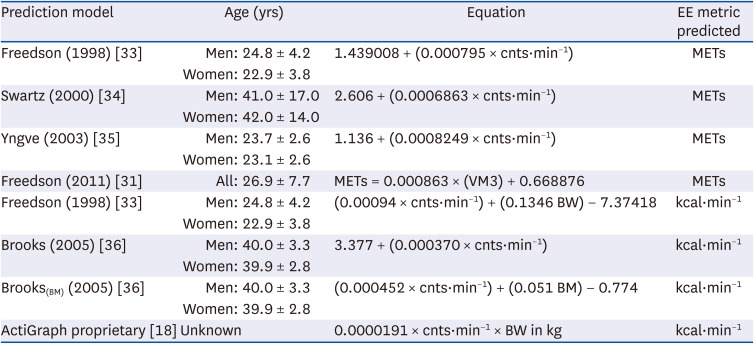
Eight predictive equations were assessed in this study, including 7 published equations and one proprietary equation. The details of these equations are provided in Table 1. The ActiGraph GT3X+, which is a triaxial accelerometer, was used for activity measurements. On the other hand, apart from the Freedson (2011) equation [31], which is based on vector magnitude (VM) activity counts, the remaining equations assessed in this study were developed using uniaxial accelerometers. The VM activity counts were applied to assess the accuracy of the Freedson (2011) equation [31]. In the case of the remaining equations, the vertical axis counts were applied to predict the subjects’ EE and METs. Studies have shown that the PA prediction equations developed using uniaxial ActiGraph accelerometers can be used with vertical axis activity counts from later versions of the triaxial ActiGraph accelerometers [3132].
Table 1

ActiGraph prediction models assessed in the present study

nrp-16-565-i001
Prediction model Age (yrs) Equation EE metric predicted
Freedson (1998) [33] Men: 24.8 ± 4.2 1.439008 + (0.000795 × cnts·min−1) METs
Women: 22.9 ± 3.8
Swartz (2000) [34] Men: 41.0 ± 17.0 2.606 + (0.0006863 × cnts·min−1) METs
Women: 42.0 ± 14.0
Yngve (2003) [35] Men: 23.7 ± 2.6 1.136 + (0.0008249 × cnts·min−1) METs
Women: 23.1 ± 2.6
Freedson (2011) [31] All: 26.9 ± 7.7 METs = 0.000863 × (VM3) + 0.668876 METs
Freedson (1998) [33] Men: 24.8 ± 4.2 (0.00094 × cnts·min−1) + (0.1346 BW) − 7.37418 kcal·min−1
Women: 22.9 ± 3.8
Brooks (2005) [36] Men: 40.0 ± 3.3 3.377 + (0.000370 × cnts·min−1) kcal·min−1
Women: 39.9 ± 2.8
Brooks(BM) (2005) [36] Men: 40.0 ± 3.3 (0.000452 × cnts·min−1) + (0.051 BM) − 0.774 kcal·min−1
Women: 39.9 ± 2.8
ActiGraph proprietary [18] Unknown 0.0000191 × cnts·min−1 × BW in kg kcal·min−1
Values are presented as mean ± SD.
EE, energy expenditure; cnts, activity counts; VM3, vector magnitude activity counts; BM, body mass; Brooks(BM), Brooks equation including body mass; BW, body weight.

Activity intensity classification

Ainsworth et al. [37] used various research data on PA and compiled a compendium of different activities and their intensities as METs. A MET has been defined as the ratio of the work metabolic rate to a standard resting metabolic rate of 1 kcal (4.184 kJ)·kg−1·h−1 or 3.5 mL(O2)·kg−1·min−1; 1 MET is considered the resting metabolic rate (RMR) obtained during quiet sitting [3738]. In this study, the measured METs were calculated using the following equation: METs = VO2/3.5 mL·kg−1·min−1 [19]. Although many recent studies have shown that the standard RMR of 3.5 mL·kg−1·min−1 significantly differs from the measured RMR [153940], this standard RMR was applied because all assessed equations were developed based on this approach. The focus of this study was not to assess the difference between the measured and standard RMR, but to evaluate the accuracy of the ActiGraph equations in the way they were developed and commonly used in different studies. Given that some of the equations assessed are based on the prediction of EE as kcal/min, the predicted EE was converted to the predicted METs before assessing the intensity classification accuracy based on concerned equations. Given that 1 L of oxygen consumed is approximately 5 kcal and considering the definition of a MET, the following formula was used to convert predicted kcal/min to the METs:
METs = (kcal.min−1 × 200)/(3.5 × weight of participant in kg)
According to their MET values, the activities were classified in one of the 3 intensity categories (light activities, < 3 METs; moderate activities, 3–6 METs; vigorous activities, > 6 METs) [37]. The activity intensity misclassification was defined as cases where for the same activity, the intensity category based on the measured METs differed from the category based on the predicted METs.

Data analysis

At the end of each participant’s visit, the data collected from the Cosmed K4b2 and ActiGraph were downloaded to the computer. Before analysis, the first 2 min of each bout were removed to minimize the error caused by the transition time between the participant’s rest and PA. The last 10 s were discarded to minimize the error in the synchronization between ActiGraph and Cosmed K4b2.
Statistical analysis was conducted using SPSS version 23.0 for Windows (SPSS Inc., Chicago, IL, USA). Descriptive statistics were used to summarize the participants’ data on the EE variables. A paired t-test was used to compare the predicted and measured EE and METs, and 95% confidence intervals (CIs) were used to determine the significant differences. If the CI spanned 0, then there were no significant differences between the predicted and measured EE. The root mean square prediction error (RMSE) was used to assess the magnitude of the difference between the measured and predicted EE. The accelerometer accuracy in the activity intensity classification was assessed using the misclassification rate and was defined as the percentage of activities for which the assigned intensity category based on the measured METs differed from the category based on the predicted METs.

RESULTS

Characteristics of the participants

Table 2 lists the characteristics of the participants. Men were significantly taller than women (P < 0.05), but there were no significant differences between sexes regarding age, body weight, and BMI.
Table 2

Characteristics of the participants

nrp-16-565-i002
Characteristic All (n = 31) Men (n = 20) Women (n = 11) P-value
Age (yrs) 74.3 ± 3.3 74.7 ± 3.4 73.6 ± 3.3 0.3601)
Body weight (kg) 65.5 ± 10.5 68.1 ± 11.2 60.8 ± 3.3 0.0632)
Height (cm) 160.4 ± 8.1 164.2 ± 6.4 153.4 ± 5.8 < 0.0012)
Body mass index (kg·m−2) 25.4 ± 3.3 25.2 ± 3.6 25.9 ± 2.9 0.6002)
Values are presented as mean ± SD.
P-value obtained by using 1)Mann-Whitney U test or 2)independent t-test.

Accelerometer activity counts and energy cost of walking

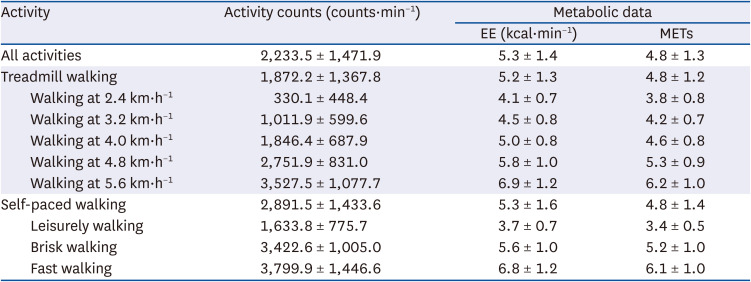
Table 3 lists the results of accelerometry and EE measurements. The total number of expected observations was 248 (31 participants × 8 activities). On the other hand, some activities were not completed as planned because participants were unable to perform the tasks in case of too high speed of the treadmill, or the activities were eliminated because of errors in the instrument manipulation. Therefore, the final number of observations was 237. Both the activity counts and metabolic data increased with increasing activity intensity during both treadmill and self-spaced walking. The lowest mean activity counts were 330.1 ± 448.4 counts·min−1, which were observed from treadmill walking at 2.4 km·h−1. The highest number was 3,799.9 ± 1,446.6 counts·min−1, observed from fast self-paced hallway walking. The smallest mean EE of the participants was 3.7 ± 0.7 kcal·min−1 observed from leisurely walking, and the highest EE was 6.9 ± 1.2 kcal·min−1 observed from treadmill walking at 5.6 km·h−1. The average measured activity intensity varied from 3.4 ± 0.5 METs for the self-paced leisurely walking to 6.2 ± 1.0 METs observed for treadmill walking at 5.6 km·h−1.
Table 3

Activity counts and energy cost of walking

nrp-16-565-i003
Activity Activity counts (counts·min−1) Metabolic data
EE (kcal·min−1) METs
All activities 2,233.5 ± 1,471.9 5.3 ± 1.4 4.8 ± 1.3
Treadmill walking 1,872.2 ± 1,367.8 5.2 ± 1.3 4.8 ± 1.2
Walking at 2.4 km·h−1 330.1 ± 448.4 4.1 ± 0.7 3.8 ± 0.8
Walking at 3.2 km·h−1 1,011.9 ± 599.6 4.5 ± 0.8 4.2 ± 0.7
Walking at 4.0 km·h−1 1,846.4 ± 687.9 5.0 ± 0.8 4.6 ± 0.8
Walking at 4.8 km·h−1 2,751.9 ± 831.0 5.8 ± 1.0 5.3 ± 0.9
Walking at 5.6 km·h−1 3,527.5 ± 1,077.7 6.9 ± 1.2 6.2 ± 1.0
Self-paced walking 2,891.5 ± 1,433.6 5.3 ± 1.6 4.8 ± 1.4
Leisurely walking 1,633.8 ± 775.7 3.7 ± 0.7 3.4 ± 0.5
Brisk walking 3,422.6 ± 1,005.0 5.6 ± 1.0 5.2 ± 1.0
Fast walking 3,799.9 ± 1,446.6 6.8 ± 1.2 6.1 ± 1.0
Values are presented as mean ± SD.
EE, energy expenditure; MET, metabolic equivalent.

EE prediction bias

Table 4 presents the ActiGraph EE (kcal) prediction bias. All assessed equations underpredicted EE during treadmill walking and self-paced hallway walking. Across all activities, the Brooks equation had the lowest degree of underprediction (−1.0 kcal·min−1), while the Freedson (1998) equation [33] appeared to have the greatest underprediction (−1.8 kcal·min−1). This corresponded to a variation of the RMSE, which was the smallest for the Brooks equation (1.6 kcal·min−1), and largest for the Freedson (1998) equation [33] (2.3 kcal·min−1). Concerning the individual activities, the smallest underprediction was observed in the case of the brisk self-paced walking using the manufacturer’s equation (−0.1 kcal·min−1), and the largest underprediction was found with the Brooks(BM) equation (−2.7 kcal·min−1), observed during treadmill walking at 5.6 km·h−1.
Table 4

ActiGraph EE (kcal·min−1) prediction bias

nrp-16-565-i004
Activity No. of activities Brooks (kcal·min−1) Brooks(BM) (kcal·min−1) Freedson (1998) (kcal·min−1) Manufacturer’s equation (kcal·min−1)
Bias (95% CI) RMSE Bias (95% CI) RMSE Bias (95% CI) RMSE Bias (95% CI) RMSE
All activities 237 −1.0 (−1.2, −0.9) 1.6 −1.7 (−1.8, −1.6) 2.0 −1.8 (−2.0, −1.6) 2.3 −1.2 (−1.39, −1.0) 2.0
Treadmill walking 153 −1.5 (−1.7, −1.3) 1.9 −1.8 (−2.0, −1.7) 2.1 −2.1 (−2.3, −1.8) 2.5 −2.9 (−3.1, −2.6) 3.2
Walking at 2.4 km·h−1 31 −0.6 (−0.9, −0.4) 0.9 −1.4 (−1.7, −1.2) 1.6 −2.4 (−2.9, −1.9) 2.7 −2.4 (−2.7, −2.2) 2.5
Walking at 3.2 km·h−1 31 −0.8 (−1.1, −0.5) 1.1 −1.5 (−1.8, −1.3) 1.7 −2.1 (−2.6, −1.7) 2.5 −2.0 (−2.4, −1.7) 2.3
Walking at 4.0 km·h−1 31 −0.9 (−1.2, −0.6) 1.2 −1.6 (−1.8, −1.3) 1.7 −1.8 (−2.3, −1.3) 2.2 −1.4 (−1.8, −0.9) 1.8
Walking at 4.8 km·h−1 31 −1.4 (−1.8, −1.0) 1.8 −2.0 (−2.3, −1.6) 2.2 −1.8 (−2.3, −1.2) 2.3 −1.0 (−1.6, −0.5) 1.9
Walking at 5.6 km·h−1 29 −2.2 (−2.7, −1.7) 2.6 −2.7 (−3.2, −2.2) 3.0 −2.2 (−2.8, −1.5) 2.8 −1.2 (−2.0, −0.4) 2.3
Self-paced walking 84 −1.7 (−2.1, −1.3) 2.4 −1.4 (−1.7, −1.2) 1.9 −1.2 (−1.6, −0.9) 1.9 −1.7 (−2.0, −1.4) 2.3
Leisurely walking 30 0.3 (0.0, 0.5) 0.7 −0.5 (−0.6, −0.3) 0.6 −0.9 (−1.3, −0.4) 1.4 −0.4 (−0.7, −0.1) 0.8
Brisk walking 30 −1.0 (−1.4, −0.6) 1.4 −1.6 (−1.9, 1.2) 1.8 −1.1 (−1.7, −0.5) 1.8 −0.1 (−0.7, 0.4) 1.5
Fast walking 24 −2.0 (−2.6, −1.4) 2.4 −1.3 (−3.1, −2.0) 2.8 −1.9 (−2.6, −1.1) 2.6 −0.8 (−1.7, 0.1) 2.3
EE, energy expenditure; RMSE, root mean squared prediction error; Brooks(BM), Brooks equation including body mass.

Activity intensity prediction bias

The Swartz equation showed the smallest underprediction value for all activities with a mean bias of −0.7 METs, and for individual activities with a bias of −0.2 METs observed in brisk self-paced hallway walking (Table 5). On the other hand, the largest underprediction was observed with the Yngve equation for all activities with an average bias of −1.8 METs and for individual activities with a bias of −2.4 METs observed during treadmill walking at 2.4 km·h−1. The average RMSE for all activities varied analogously with the intensity prediction bias; the smallest value was obtained from the Swartz equation, and the largest value was obtained from the Yngve equation (Table 5).
Table 5

ActiGraph METs prediction bias

nrp-16-565-i005
Activity No. Freedson (1998) (METs) Swartz (METs) Yngve (METs) Freedson (2011) (VM3; METs)
Bias (95% CI) RMSE Bias (95% CI) RMSE Bias (95% CI) RMSE Bias (95% CI) RMSE
All activities 237 −1.6 (−1.7, −1.4) 2.0 −0.7 (−0.8, −0.5) 1.3 −1.8 (−2.0, −1.7) 2.2 −1.7 (−1.8, −1.5) 2.1
Treadmill walking 153 −1.9 (−2.0, −1.7) 2.1 −0.9 (−1.1, −0.8) 1.3 −2.1 (−2.3, −2.0) 2.4 −2.0 (−2.2, −1.8) 2.3
Walking at 2.4 km·h−1 31 −2.1 (−2.4, −1.9) 2.2 −1.0 (−1.3, −0.7) 1.2 −2.4 (−2.7, −2.2) 2.5 −2.3 (−2.6, −1.9) 2.5
Walking at 3.2 km·h−1 31 −1.9 (−2.2, −1.6) 2.1 −0.9 (−1.2, −0.6) 1.2 −2.2 (−2.5, −1.9) 2.3 −2.1 (−2.4, −1.7) 2.3
Walking at 4.0 km·h−1 31 −1.7 (−2.0, −1.3) 1.9 −0.7 (−1.0, −0.4) 1.1 −1.9 (−2.2, −1.6) 2.1 −1.8 (−2.2, −1.5) 2.0
Walking at 4.8 km·h−1 31 −1.7 (−2.1, −1.2) 2.0 −0.8 (−1.2, −0.4) 1.4 −1.9 (−2.3, −1.5) 2.2 −1.8 (−2.2, −1.3) 2.1
Walking at 5.6 km·h−1 29 −2.0 (−2.6, −1.4) 2.5 −1.2 (−1.7, −0.7) 1.8 −2.2 (−2.8, −1.6) 2.6 −2.0 (−2.5, −1.4) 2.5
Self-paced walking 84 −1.1 (−1.3, −0.8) 1.6 −0.2 (−0.5, 0.1) 1.2 −1.3 (−1.6, −1.0) 1.8 −1.1 (−1.4, −0.8) 1.6
Leisurely walking 30 −0.7 (−0.9, −0.5) 0.9 −0.3 (−0.1, 0.5) 0.6 −0.9 (−1.1, −0.7) 1.1 −0.7 (−1.0, −0.5) 1.0
Brisk walking 30 −1.0 (−1.5, −0.5) 1.6 −0.2 (−0.7, −0.3) 1.2 −1.2 (−1.7, −0.7) 1.8 −1.1 (−1.5, −0.6) 1.6
Fast walking 24 −1.6 (−2.3, −1.0) 2.3 −0.9 (−1.5, −0.3) 1.7 −1.8 (−2.5, −1.1) 2.4 −1.6 (−2.3, −0.9) 2.2
MET, metabolic equivalent; RMSE, root mean squared prediction error; CI, confidence interval; VM3, vector magnitude activity counts.

Activity intensity misclassification rates

Fig. 1 presents the rates of activity intensity misclassification by the different equations assessed in this study. Across all intensities, the misclassification rates ranged from 32% for the Swartz equation to 62% for the Yngve equation. All the models had the highest rates of misclassification in vigorous-intensity activities.
Fig. 1

Activity intensity misclassification rates for the different ActiGraph prediction equations.

BM, body mass; MET, metabolic equivalent.
nrp-16-565-g001

DISCUSSION

Different researchers have focused their attention on studying the relationship between PA and health [4142]. In this context, accelerometers have become important tools for the objective measurement of PA and EE. On the other hand, most accelerometer predictive equations for EE have been developed using young and middle-aged populations. There is a limited number of validation studies in older adults. To the best of the authors’ knowledge, this was the first study to assess the accuracy of different accelerometer equations for predicting EE during walking activities in older adults. The main finding was that all the equations assessed underestimated the EE and METs in different walking activities in older adults. In addition, these equations were inaccurate for classifying the activities according to their intensities.
The present study included the Freedson (1998) equations [33] for kcal and MET predictions. Similar to the other models assessed, the 2 equations underestimated the EE both on treadmill walking and in self-paced walking activities. This underprediction could be because the Freedson (1998) study [33] involved a limited number of activities, namely 4.8, 6.4, and 9.7 km·h−1 treadmill walking activities. In addition, these equations were developed in subjects aged 24.8 ± 4.2 yrs compared to our subjects aged 74.3 ± 3.3 yrs. Among the treadmill walking activities, the bias from the Freedson MET equation was −1.9 METs (95% CI, −2.0, −1.7). The extent of bias tended to be lower in the self-paced walking activities (bias, −1.1 METs; 95% CI, −1.3, −0.8), compared to treadmill-based walking. More studies will be needed to confirm and understand the reason for this difference. Across all activities, the bias was −1.6 METs (95% CI, −1.7, −1.4).
In this study, the Swartz equation performed better than the Freedson METs model in treadmill walking activities (bias, −0.9 METs; 95% CI, −1.1, −0.8), in self-paced walking activities (bias, −0.2; 95% CI, −0.5, 0.1), and across all activities (bias, −0.7 METs; 95% CI, −0.8, −0.5). These results agree with Lyden et al. [19], who reported that the Swartz equation resulted in smaller MET bias than the Freedson MET model. This could be because the study to develop the Swartz equation [34] included both a large number of activities (2 walking activities and 26 lifestyle activities) and a wider range of participants’ ages (70 participants aged between 19 and 74 yrs).
In the present study, no single equation could accurately predict the activity intensity across all activities. In all prediction models, vigorous physical activities (VPA) were the most highly misclassified, with misclassification rates ranging from 79.5% for the manufacturer’s equation to 100% VPA misclassified by the equation of Brooks(BM). Compared to other equations, the Swartz and Brooks models were characterized by a high rate of misclassifications for the light intensity physical activities (62% in the case of the Swartz equation and 62.5% for the Brooks equation). This appears to be related to the high y-intercept in the 2 prediction models, which is as high as 2.606 for the Swartz equation and 3.377 for the Brooks equation. On the other hand, the 2 equations had the lowest misclassification rates among the moderate-intensity activities (19% in the case of the Swartz equation and 17.9% in the case of the Brooks equation).
Previous studies in other age groups reported limitations in translating the activity counts into EE [1943]. Crouter et al. [44] examined the validity of published regression equations designed to predict the EE from accelerometers (ActiGraph, Actical, and AMP-331) compared to indirect calorimetry measurements over a wide range of activities. The participants in their study were 24 men aged 36 ± 12.8 yrs and 24 women aged 35 ± 10.3 yrs. The results showed that no single regression equation worked well across a wide range of activities for predicting EE or time spent in light, moderate, and vigorous PA.
In another study, Lyden et al. [19] assessed the accuracy of the commonly used accelerometer EE and MET prediction equations in a large sample of 270 healthy men and women aged between 20 and 60 yrs. In agreement with these findings, their study showed that prediction equations did not yield accurate point estimates of EE across a broad range of activities, nor were they accurate in classifying activities across a range of intensities. However, compared to their study results, the present study observed higher rates of activity intensity misclassification, particularly among the VPA. This could be related to the participants’ age difference between the 2 studies, as the energy cost of physical activities has been reported to be higher in older people than in younger individuals [244445].
Ortega and Farley [44] measured the metabolic rate while 10 elderly (aged 76 ± 4 yrs) and 10 young subjects (aged 25 ± 4 yrs) walked at 5 speeds between 0.7 and 1.8 m·s−1. The study findings showed that the elderly subjects consumed an average of 20% more metabolic energy (P < 0.05) than younger subjects. Whitcher and Papadopoulos [24], who compared accelerometer activity counts and oxygen consumption in 16 young (21.3 ± 2.5 yrs) and 16 elderly (66.6 ± 2.9 yrs) participants, in four 6-minute walking intensities ranging from 27 to 94 m·min−1, reported a similar finding. The findings indicated that activity counts were similar between the age groups across the different walking speeds, while exercise oxygen consumption was significantly higher for the elderly group (P < 0.05). Mian et al. [45] observed similar results in a study that compared the cost of walking between 12 young (27 ± 3 yrs) and older subjects (74 ± 3 yrs) during a treadmill walking exercise at 4 speeds (ranging from 0.83 to 1.67 m·s−1). The study found the cost of walking to be significantly higher in the older subjects than the younger subjects.
Consistent with the above studies, the activity-measured intensities were higher than the values for the same activities in the compendium of physical activities [37]. For example, walking at speeds of 2.4 and 3.2 km·h−1 were both classified as moderate-intensity physical activities (3.8 and 4.2 METs, respectively), while the compendium classified these activities in the light intensity category (with METs of 2 and 2.5, respectively).
This study was limited by the small sample size. In addition, only the equations using the ActiGraph accelerometer were assessed. Thus, additional studies should be conducted to confirm these findings with a larger sample size and using different types of accelerometers.
In conclusion, the ActiGraph equations underestimated EE for different walking activities in older adults. In addition, these equations were inaccurate for classifying activities according to their intensities. The present study suggests a need to develop equations specific for predicting EE in older adults.

ACKNOWLEDGMENTS

The authors are very grateful to the participants who contributed their valuable time to this study.

Notes

Conflict of Interest: The authors declare no potential conflicts of interests.

Author Contributions:

  • Conceptualization: Kim EK, Kim YJ, Wang CS.

  • Formal analysis: Ndahimana D, Kim YJ.

  • Investigation: Kim EK, Kim YJ, Wang CS.

  • Methodology: Kim EK, Kim YJ, Wang CS.

  • Supervision: Kim EK.

  • Writing - original draft: Ndahimana D.

  • Writing - review & editing: Ndahimana D, Kim EK.

References

1. United Nations. World Population Ageing 2017 - Highlights (ST/ESA/SER.A/397). New York (NY): UN;2017.
2. Arredondo A, Aviles R. Costs and epidemiological changes of chronic diseases: implications and challenges for health systems. PLoS One. 2015; 10:e0118611. PMID: 25781625.
crossref
3. Kennedy BK, Berger SL, Brunet A, Campisi J, Cuervo AM, Epel ES, Franceschi C, Lithgow GJ, Morimoto RI, Pessin JE, et al. Aging: a common driver of chronic diseases and a target for novel interventions. Cell. 2014; 159:709–713. PMID: 25417146.
4. Population Reference Bureau. Noncommunicable diseases among older adults in low- and middle-income countries. Washington, D.C.: Population Reference Bureau;2012. cited 2021 December 26. Available from: https://www.prb.org/resources/noncommunicable-diseases-among-older-adults-in-low-and-middle-income-countries/.
5. Sowa A, Tobiasz-Adamczyk B, Topór-Mądry R, Poscia A, la Milia DI. Predictors of healthy ageing: public health policy targets. BMC Health Serv Res. 2016; 16(Suppl 5):289. PMID: 27609315.
crossref
6. Hanson MA, Cooper C, Aihie Sayer A, Eendebak RJ, Clough GF, Beard JR. Developmental aspects of a life course approach to healthy ageing. J Physiol. 2016; 594:2147–2160. PMID: 26518329.
crossref
7. Crichton GE, Alkerwi A. Physical activity, sedentary behavior time and lipid levels in the Observation of Cardiovascular Risk Factors in Luxembourg study. Lipids Health Dis. 2015; 14:87. PMID: 26256803.
crossref
8. Qiu S, Cai X, Schumann U, Velders M, Sun Z, Steinacker JM. Impact of walking on glycemic control and other cardiovascular risk factors in type 2 diabetes: a meta-analysis. PLoS One. 2014; 9:e109767. PMID: 25329391.
crossref
9. Friedenreich CM, Neilson HK, Farris MS, Courneya KS. Physical activity and cancer outcomes: a precision medicine approach. Clin Cancer Res. 2016; 22:4766–4775. PMID: 27407093.
crossref
10. Bherer L, Erickson KI, Liu-Ambrose T. A review of the effects of physical activity and exercise on cognitive and brain functions in older adults. J Aging Res. 2013; 2013:657508. PMID: 24102028.
crossref
11. Steffl M, Bohannon RW, Sontakova L, Tufano JJ, Shiells K, Holmerova I. Relationship between sarcopenia and physical activity in older people: a systematic review and meta-analysis. Clin Interv Aging. 2017; 12:835–845. PMID: 28553092.
crossref
12. Iolascon G, Di Pietro G, Gimigliano F, Mauro GL, Moretti A, Giamattei MT, Ortolani S, Tarantino U, Brandi ML. Physical exercise and sarcopenia in older people: position paper of the Italian Society of Orthopaedics and Medicine (OrtoMed). Clin Cases Miner Bone Metab. 2014; 11:215–221. PMID: 25568656.
crossref
13. Welk GJ. Physical Activity Assessments for Health-Related Research. Champaign (IL): Human Kinetics;2002.
14. WHO. Global Recommendations on Physical Activity for Health. Geneva: WHO Press;2010.
15. Pinheiro Volp AC, Esteves de Oliveira FC, Duarte Moreira Alves R, Esteves EA, Bressan J. Energy expenditure: components and evaluation methods. Nutr Hosp. 2011; 26:430–440. PMID: 21892558.
16. Ndahimana D, Kim EK. Measurement methods for physical activity and energy expenditure: a review. Clin Nutr Res. 2017; 6:68–80. PMID: 28503503.
crossref
17. Crouter SE, Clowers KG, Bassett DR Jr. A novel method for using accelerometer data to predict energy expenditure. J Appl Physiol (1985). 2006; 100:1324–1331. PMID: 16322367.
crossref
18. ActiGraph, LLC. Kcal estimates from activity counts using the potential energy method. Pensacola (FL): ActiGraph, LLC.;1998. cited 2017 October 24. Available from: http://actigraphcorp.com/research-database/kcal-estimates-from-activity-counts-using-the-potential-energy-method/.
19. Lyden K, Kozey SL, Staudenmeyer JW, Freedson PS. A comprehensive evaluation of commonly used accelerometer energy expenditure and MET prediction equations. Eur J Appl Physiol. 2011; 111:187–201. PMID: 20842375.
crossref
20. Santos-Lozano A, Santín-Medeiros F, Cardon G, Torres-Luque G, Bailón R, Bergmeir C, Ruiz JR, Lucia A, Garatachea N. ActiGraph GT3X: validation and determination of physical activity intensity cut points. Int J Sports Med. 2013; 34:975–982. PMID: 23700330.
crossref
21. Aguilar-Farias N, Peeters GM, Brychta RJ, Chen KY, Brown WJ. Comparing ActiGraph equations for estimating energy expenditure in older adults. J Sports Sci. 2019; 37:188–195. PMID: 29912666.
crossref
22. Hall KS, Howe CA, Rana SR, Martin CL, Morey MC. METs and accelerometry of walking in older adults: standard versus measured energy cost. Med Sci Sports Exerc. 2013; 45:574–582. PMID: 23059862.
23. Jones LM, Waters DL, Legge M. Walking speed at self-selected exercise pace is lower but energy cost higher in older versus younger women. J Phys Act Health. 2009; 6:327–332. PMID: 19564661.
crossref
24. Whitcher L, Papadopoulos C. Accelerometer derived activity counts and oxygen consumption between young and older individuals. J Aging Res. 2014; 2014:184693. PMID: 25006459.
crossref
25. Pinnington HC, Wong P, Tay J, Green D, Dawson B. The level of accuracy and agreement in measures of FEO2, FECO2 and VE between the Cosmed K4b2 portable, respiratory gas analysis system and a metabolic cart. J Sci Med Sport. 2001; 4:324–335. PMID: 11702919.
crossref
26. McLaughlin JE, King GA, Howley ET, Bassett DR Jr, Ainsworth BE. Validation of the COSMED K4 b2 portable metabolic system. Int J Sports Med. 2001; 22:280–284. PMID: 11414671.
crossref
27. Schrack JA, Simonsick EM, Ferrucci L. Comparison of the Cosmed K4b2 portable metabolic system in measuring steady-state walking energy expenditure. PLoS One. 2010; 5:e9292. PMID: 20174583.
28. Mcminn D, Acharya R, Rowe DA, Gray SR, Allan JL. Measuring activity energy expenditure: accuracy of the GT3X+ and Actiheart monitors. Int J Exerc Sci. 2013; 6:217–229.
29. Aadland E, Ylvisåker E. Reliability of the ActiGraph GT3X+ accelerometer in adults under free-living conditions. PLoS One. 2015; 10:e0134606. PMID: 26274586.
crossref
30. Schneller MB, Pedersen MT, Gupta N, Aadahl M, Holtermann A. Validation of five minimally obstructive methods to estimate physical activity energy expenditure in young adults in semi-standardized settings. Sensors (Basel). 2015; 15:6133–6151. PMID: 25781506.
crossref
31. Sasaki JE, John D, Freedson PS. Validation and comparison of ActiGraph activity monitors. J Sci Med Sport. 2011; 14:411–416. PMID: 21616714.
crossref
32. Robusto KM, Trost SG. Comparison of three generations of ActiGraph™ activity monitors in children and adolescents. J Sports Sci. 2012; 30:1429–1435. PMID: 22857599.
crossref
33. Freedson PS, Melanson E, Sirard J. Calibration of the Computer Science and Applications, Inc. accelerometer. Med Sci Sports Exerc. 1998; 30:777–781. PMID: 9588623.
crossref
34. Swartz AM, Strath SJ, Bassett DR Jr, O’Brien WL, King GA, Ainsworth BE. Estimation of energy expenditure using CSA accelerometers at hip and wrist sites. Med Sci Sports Exerc. 2000; 32:S450–S456. PMID: 10993414.
crossref
35. Yngve A, Nilsson A, Sjöström M, Ekelund U. Effect of monitor placement and of activity setting on the MTI accelerometer output. Med Sci Sports Exerc. 2003; 35:320–326. PMID: 12569223.
crossref
36. Brooks AG, Gunn SM, Withers RT, Gore CJ, Plummer JL. Predicting walking METs and energy expenditure from speed or accelerometry. Med Sci Sports Exerc. 2005; 37:1216–1223. PMID: 16015141.
crossref
37. Ainsworth BE, Haskell WL, Whitt MC, Irwin ML, Swartz AM, Strath SJ, O’Brien WL, Bassett DR, Schmitz KH, Emplaincourt PO, et al. Compendium of physical activities: an update of activity codes and MET intensities. Med Sci Sports Exerc. 2000; 32:S498–S516. PMID: 10993420.
crossref
38. Institute of Medicine of the National Academies (US). Dietary Reference Intakes for Energy, Carbohydrate, Fiber, Fat, Fatty Acids, Cholesterol, Protein, and Amino Acids. Washington, D.C.: National Academies Press;2002.
39. Byrne NM, Hills AP, Hunter GR, Weinsier RL, Schutz Y. Metabolic equivalent: one size does not fit all. J Appl Physiol (1985). 2005; 99:1112–1119. PMID: 15831804.
crossref
40. Kwan M, Woo J, Kwok T. The standard oxygen consumption value equivalent to one metabolic equivalent (3.5 ml/min/kg) is not appropriate for elderly people. Int J Food Sci Nutr. 2004; 55:179–182. PMID: 15223593.
crossref
41. Bird SR, Hawley JA. Update on the effects of physical activity on insulin sensitivity in humans. BMJ Open Sport Exerc Med. 2017; 2:e000143.
crossref
42. Mansikkamäki K, Raitanen J, Nygård CH, Tomás E, Rutanen R, Luoto R. Long-term effect of physical activity on health-related quality of life among menopausal women: a 4-year follow-up study to a randomised controlled trial. BMJ Open. 2015; 5:e008232.
crossref
43. Crouter SE, Churilla JR, Bassett DR Jr. Estimating energy expenditure using accelerometers. Eur J Appl Physiol. 2006; 98:601–612. PMID: 17058102.
crossref
44. Ortega JD, Farley CT. Individual limb work does not explain the greater metabolic cost of walking in elderly adults. J Appl Physiol (1985). 2007; 102:2266–2273. PMID: 17363623.
crossref
45. Mian OS, Thom JM, Ardigò LP, Narici MV, Minetti AE. Metabolic cost, mechanical work, and efficiency during walking in young and older men. Acta Physiol (Oxf). 2006; 186:127–139. PMID: 16497190.
crossref
TOOLS
Similar articles