Journal List > Nutr Res Pract > v.16(Suppl 1) > 1516079336

Shim, Kim, Lee, Yoon, and Lee: Dietary intake and major source foods of vitamin E among Koreans: findings of the Korea National Health and Nutrition Examination Survey 2016–2019

Abstract

BACKGROUND/OBJECTIVES

Vitamin E is essential for health, and although vitamin E deficiency seems rare in humans, studies on estimates of dietary intake are lacking. This study aimed to estimate dietary vitamin E intake, evaluate dietary adequacy of vitamin E, and detail major food sources of vitamin E in the Korean population.

SUBJECTS/METHODS

This study used data from the Korea National Health and Nutrition Examination Survey (KNHANES) 2016–2019. Individuals aged ≥ 1 year that participated in a nutrition survey (n = 28,418) were included. Dietary intake was assessed by 24-h recall and individual dietary vitamin E intake was estimated using a newly established vitamin E database. Dietary adequacy was evaluated by comparing dietary intake with adequate intake (AI) as defined by Korean Dietary Reference Intakes 2020.

RESULTS

For all study subjects, mean daily total vitamin E intake was 7.00 mg α-tocopherol equivalents, which was 61.6% of AI. The proportion of individuals that consumed vitamin E at above the AI was 12.9%. Inadequate intake was observed more in females, older individuals, rural residents, and those with a low income. Mean daily intakes of tocopherol (α-, β-, γ-, and δ-forms) and tocotrienol were 6.02, 0.30, 6.19, 1.63, and 1.61 mg, respectively. The major food groups that contributed to total dietary vitamin E intake were grains (22.3%), seasonings (17.0%), vegetables (15.3%), and fish, and shellfish (7.4%). The top 5 individual food items that contributed to total vitamin E intake were baechu kimchi, red pepper powder, eggs, soybean oil, and rice.

CONCLUSIONS

This study shows that mean dietary vitamin E intake by Koreans did not meet the reference adequate intake value. To better understand the status of vitamin E intake, further research is needed that considers intake from dietary supplements.

INTRODUCTION

Vitamin E is an essential fat-soluble vitamin [12], and vitamin E deficiency is rare in humans. Deficiency is only observed in individuals with an absorbance problem or with inherited abnormalities related to abetalipoproteinemia or α-tocopherol transport protein [12]. Blood concentrations of α-tocopherol of Koreans are invariably within the normal range [34], and thus, dietary vitamin E intake by Koreans is considered to be sufficient to prevent deficiency symptoms. Accordingly, there is little concern about vitamin E deficiency in the Korean diet; however, vitamin E deserves attention because of its beneficial impact on human health [12]. Vitamin E is one of the most prominent dietary antioxidants and a free radical scavenger [2], and recently, has been reported to have anti-inflammatory, biochemical, and biomolecular activities [25]. As a result, vitamin E is considered to play important roles in the prevention of chronic diseases such as cardiovascular diseases, cancers, and allergic diseases, and growing evidence suggests that high intakes of vitamin E may lower risks of chronic diseases [256789].
The Korea National Health and Nutrition Examination Survey (KNHANES) is conducted to assess and monitor the health and nutrition statuses of Koreans. However, although KNHANES provides much information, the dietary intakes of vitamin E have not yet been assessed because vitamin E has not been included in the food composition database compiled by KNHANES. Furthermore, though some studies have been conducted on dietary vitamin E intake by Koreans [10111213], evidence is lacking regarding dietary vitamin E intake in the general population. Therefore, we established a database of the vitamin E contents of foods reported to be consumed in KNHANES 2016–2019. Using this newly established vitamin E database, we aimed to estimate dietary vitamin E intakes, evaluate the dietary adequacy of vitamin E, and examine major sources of vitamin E in the diets of Koreans.

SUBJECTS AND METHODS

Study population

This study used data from the KNHANES 2016–2019 surveys. These surveys are nationally representative, cross-sectional surveys that include a health interview, a health examination, and a nutrition survey. KNHANES provides information about the health and nutrition statuses of Koreans aged ≥ 1 year. The protocols and procedures used by KNHANES were approved by the Institutional Review Board of Korea Disease Control and Prevention Agency (KDCA), and written informed consent was obtained from all participants. We used the raw data file and documentation released by KCDA (https://knhanes.cda.go.kr, accessed on March 2, 2021). Of the 31,379 participants in KNHANES 2016–2019, this study included 28,418 individuals that participated in the nutrition survey.

Ethical approval

The protocol of 2016–2019 KNHANES was approved by the Institutional Review Board (IRB) of the Korea Centers for Disease Control and Prevention (IRB approval number in 2016–2018 and 2019–2021: 2018-01-03-P-A and 2018-01-03-C-A). Written informed consent was obtained from all participants.

Dietary assessment

Dietary intake was assessed by 24-h recall. A trained dietitian surveyed details of foods and beverages consumed on the recall day using a standardized protocol. Dietary intakes of food and nutrients were calculated using recipes and nutrient contents of foods developed for KNHANES [141516]. However, KNHANES raw data did not detail vitamin E dietary intakes.

Establishment of a vitamin E database and estimation of dietary vitamin E intake

To assess dietary vitamin E intakes, a vitamin E content database was established for foods reported to be consumed by KNHANES 2016–2019 (n = 4,289). We constructed a database of 4,276 foods that accounted for 99.7% of vitamin E consumption. The data sources used were the Korean food composition table (ver. 9.2 published by the National Institute of Agricultural Science), which included 3,491 foods [17], nutrition facts regarding eating-out [1819], nutrition facts of processed food published by the Korean Ministry of Food and Drug Safety (103 foods) [2021], the US food composition and nutrient database, which contained Standard Reference 28 (219 foods) and 3 branded foods [22], the Japanese standard food composition database (7th version; 293 foods) [23], the Chinese food composition table (6th version; 22 foods) [24], the Australian and New Zealand (AUSNUT 2011–2013) database (30 foods) [25], and a food company website (18 foods). The vitamin E content of 97 foods was zero. Information on the 4 tocopherol (α-, β-, γ-, and δ-tocopherol) and 4 tocotrienol (α-, β-, γ-, and δ-tocotrienol) contents of each food item were collected. When data sources differed regarding the vitamin E content of a food, the vitamin contents used in the analysis were determined using the following principles: data sourced in Korea, latest data, data sourced in nearby countries, and if imported, data from country of origin. If no information was available, we used the vitamin contents of similar foods. Total vitamin E (mg α-tocopherol equivalents, mg α-TE) contents were calculated using isomer contents, as follows [26]:
Vitamin E (mg α-TE) = mg α-tocopherol × 1.0 + mg β-tocopherol × 0.5 + mg γ-tocopherol × 0.1 + δ-tocopherol × 0.03 + mg α-tocotrienol × 0.3 + β-tocotrienol × 0.05
Our vitamin E database included 99.7% of the foods reported in KNHANES 2016–2019. The vitamin E contents of foods included in the KNHANES database were mainly obtained by domestic analyses (84%). Dietary total vitamin E intakes, based on tocopherol (α-, β-, γ-, and δ-forms) and tocotrienol intakes, were calculated using the newly established database. Dietary adequacy was evaluated by comparing dietary intake with adequate intake (AI) for each sex and age group as described in Dietary Reference Intakes for Koreans (KDRI) 2020. Relative intakes were expressed as percentages of dietary vitamin E intake to AI. To identify major food sources that contributed to dietary vitamin E intake, we calculated dietary vitamin E intake for each food and food group.

Sociodemographic variables

Sex, age, residence area, and income were subjected to analysis. These sociodemographic variables were categorized as follows: sex (male or female), age (1–2, 3–5, 6–11, 19–29, 30–49, 50–64, or ≥ 65 yrs), residence (urban or rural), and income (low, 1st quintile or high, 5th quintile).

Statistical analysis

Dietary intakes of total vitamin E and each of its isomers, and dietary vitamin E adequacy were estimated using PROC SURVEYMEANS and PROC SURVEYFREQ. Means and standard errors by sex, age, residential area, and household income level are presented, and differences between subgroups were tested using the PROC SURVEYREG procedure. To identify major food sources of vitamin E, group dietary intakes (mg α-TE) and dietary contributions (%) of each food to total daily vitamin E intake were estimated using the PROC SURVEYMEANS procedure. Sampling weights and survey design were considered for all analyses. The analysis was performed using SAS Ver. 9.4 software (SAS Institute, Cary, NC, USA) and statistical significance was accepted for P values < 0.05.

RESULTS

Dietary intakes of total vitamin E

Mean daily total dietary vitamin E intakes by sex, age, residence area, and household income are summarized in Table 1. For all 28,418 study subjects, mean total dietary vitamin E intake was 7.00 mg α-TE/day, and this was significantly higher for males than females (P value < 0.001). The mean dietary vitamin E intake was lower for children, older individuals (≥ 65 yrs old), rural residents, and those with a low income (all P values < 0.001), regardless of sex.
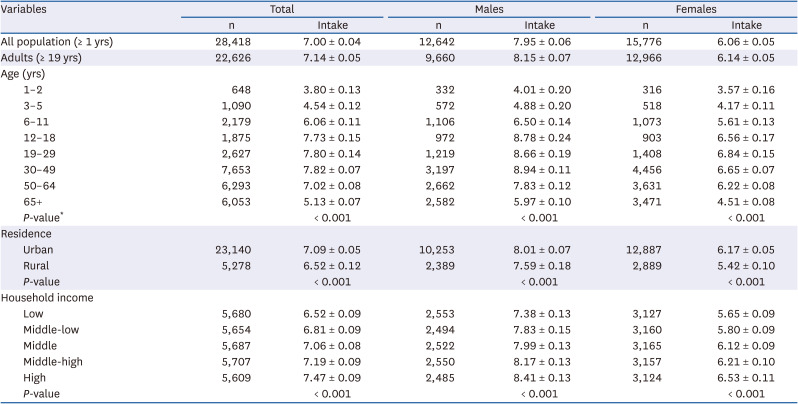
Table 1

Dietary intakes of total vitamin E for Koreans (unit: mg α-TE/day)

nrp-16-616-i001
Variables Total Males Females
n Intake n Intake n Intake
All population (≥ 1 yrs) 28,418 7.00 ± 0.04 12,642 7.95 ± 0.06 15,776 6.06 ± 0.05
Adults (≥ 19 yrs) 22,626 7.14 ± 0.05 9,660 8.15 ± 0.07 12,966 6.14 ± 0.05
Age (yrs)
1–2 648 3.80 ± 0.13 332 4.01 ± 0.20 316 3.57 ± 0.16
3–5 1,090 4.54 ± 0.12 572 4.88 ± 0.20 518 4.17 ± 0.11
6–11 2,179 6.06 ± 0.11 1,106 6.50 ± 0.14 1,073 5.61 ± 0.13
12–18 1,875 7.73 ± 0.15 972 8.78 ± 0.24 903 6.56 ± 0.17
19–29 2,627 7.80 ± 0.14 1,219 8.66 ± 0.19 1,408 6.84 ± 0.15
30–49 7,653 7.82 ± 0.07 3,197 8.94 ± 0.11 4,456 6.65 ± 0.07
50–64 6,293 7.02 ± 0.08 2,662 7.83 ± 0.12 3,631 6.22 ± 0.08
65+ 6,053 5.13 ± 0.07 2,582 5.97 ± 0.10 3,471 4.51 ± 0.08
P-value* < 0.001 < 0.001 < 0.001
Residence
Urban 23,140 7.09 ± 0.05 10,253 8.01 ± 0.07 12,887 6.17 ± 0.05
Rural 5,278 6.52 ± 0.12 2,389 7.59 ± 0.18 2,889 5.42 ± 0.10
P-value < 0.001 < 0.001 < 0.001
Household income
Low 5,680 6.52 ± 0.09 2,553 7.38 ± 0.13 3,127 5.65 ± 0.09
Middle-low 5,654 6.81 ± 0.09 2,494 7.83 ± 0.15 3,160 5.80 ± 0.09
Middle 5,687 7.06 ± 0.08 2,522 7.99 ± 0.13 3,165 6.12 ± 0.09
Middle-high 5,707 7.19 ± 0.09 2,550 8.17 ± 0.13 3,157 6.21 ± 0.10
High 5,609 7.47 ± 0.09 2,485 8.41 ± 0.13 3,124 6.53 ± 0.11
P-value < 0.001 < 0.001 < 0.001
Data are presented as means ± SE.
*Differences between group means.
Table 2 shows the mean daily intakes of tocopherol (α-, β-, γ-, and δ-forms), and tocotrienol. Regarding mean daily intakes of vitamin E isoforms by all study subjects, the mean intake of γ-tocopherol was highest (6.19 mg/day), followed by α-tocopherol (6.02 mg/day), δ-tocopherol (1.63 mg/day), tocotrienol (1.61 mg/day), and β-tocopherol (0.30 mg/day). Regardless of sex, age group, residence area, and household income, α- and γ-tocopherol accounted for a considerable portion of vitamin E intake.
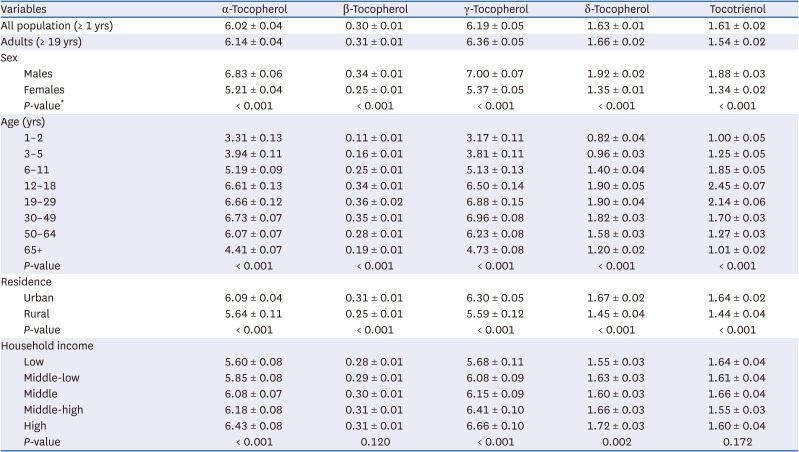
Table 2

Dietary intakes of four tocopherols and tocotrienol for Koreans by age and sex (unit: mg/day)

nrp-16-616-i002
Variables α-Tocopherol β-Tocopherol γ-Tocopherol δ-Tocopherol Tocotrienol
All population (≥ 1 yrs) 6.02 ± 0.04 0.30 ± 0.01 6.19 ± 0.05 1.63 ± 0.01 1.61 ± 0.02
Adults (≥ 19 yrs) 6.14 ± 0.04 0.31 ± 0.01 6.36 ± 0.05 1.66 ± 0.02 1.54 ± 0.02
Sex
Males 6.83 ± 0.06 0.34 ± 0.01 7.00 ± 0.07 1.92 ± 0.02 1.88 ± 0.03
Females 5.21 ± 0.04 0.25 ± 0.01 5.37 ± 0.05 1.35 ± 0.01 1.34 ± 0.02
P-value* < 0.001 < 0.001 < 0.001 < 0.001 < 0.001
Age (yrs)
1–2 3.31 ± 0.13 0.11 ± 0.01 3.17 ± 0.11 0.82 ± 0.04 1.00 ± 0.05
3–5 3.94 ± 0.11 0.16 ± 0.01 3.81 ± 0.11 0.96 ± 0.03 1.25 ± 0.05
6–11 5.19 ± 0.09 0.25 ± 0.01 5.13 ± 0.13 1.40 ± 0.04 1.85 ± 0.05
12–18 6.61 ± 0.13 0.34 ± 0.01 6.50 ± 0.14 1.90 ± 0.05 2.45 ± 0.07
19–29 6.66 ± 0.12 0.36 ± 0.02 6.88 ± 0.15 1.90 ± 0.04 2.14 ± 0.06
30–49 6.73 ± 0.07 0.35 ± 0.01 6.96 ± 0.08 1.82 ± 0.03 1.70 ± 0.03
50–64 6.07 ± 0.07 0.28 ± 0.01 6.23 ± 0.08 1.58 ± 0.03 1.27 ± 0.03
65+ 4.41 ± 0.07 0.19 ± 0.01 4.73 ± 0.08 1.20 ± 0.02 1.01 ± 0.02
P-value < 0.001 < 0.001 < 0.001 < 0.001 < 0.001
Residence
Urban 6.09 ± 0.04 0.31 ± 0.01 6.30 ± 0.05 1.67 ± 0.02 1.64 ± 0.02
Rural 5.64 ± 0.11 0.25 ± 0.01 5.59 ± 0.12 1.45 ± 0.04 1.44 ± 0.04
P-value < 0.001 < 0.001 < 0.001 < 0.001 < 0.001
Household income
Low 5.60 ± 0.08 0.28 ± 0.01 5.68 ± 0.11 1.55 ± 0.03 1.64 ± 0.04
Middle-low 5.85 ± 0.08 0.29 ± 0.01 6.08 ± 0.09 1.63 ± 0.03 1.61 ± 0.04
Middle 6.08 ± 0.07 0.30 ± 0.01 6.15 ± 0.09 1.60 ± 0.03 1.66 ± 0.04
Middle-high 6.18 ± 0.08 0.31 ± 0.01 6.41 ± 0.10 1.66 ± 0.03 1.55 ± 0.03
High 6.43 ± 0.08 0.31 ± 0.01 6.66 ± 0.10 1.72 ± 0.03 1.60 ± 0.04
P-value < 0.001 0.120 < 0.001 0.002 0.172
Data are presented mean ± SE.
*Differences between group means.

Dietary adequacy of vitamin E

Dietary adequacy of vitamin E intake is presented as relative intake (%) with respect to AI by sex and age, as suggested by KDRI 2020, with the prevalence of those that consumed more than AI in Table 3. Mean relative vitamin E intake for all study subjects was 61.6%, and about one in ten Koreans (12.9%) consumed more than the AI for vitamin E. Inadequate intake was observed more frequently for females, older individuals, rural residents, and individuals with a low income. For older adults, mean dietary vitamin E intake was less than half of the AI (42.7%) and only 3.8% met the AI.
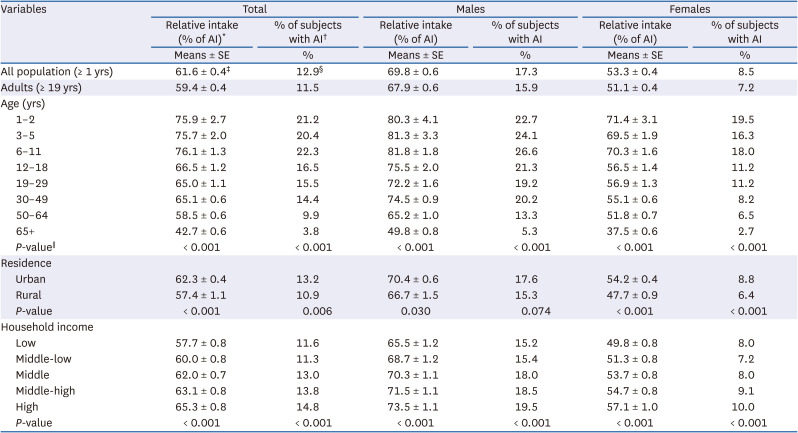
Table 3

Dietary intakes of vitamin E relative to AI and proportions of subjects with AI

nrp-16-616-i003
Variables Total Males Females
Relative intake (% of AI)* % of subjects with AI Relative intake (% of AI) % of subjects with AI Relative intake (% of AI) % of subjects with AI
Means ± SE % Means ± SE % Means ± SE %
All population (≥ 1 yrs) 61.6 ± 0.4 12.9§ 69.8 ± 0.6 17.3 53.3 ± 0.4 8.5
Adults (≥ 19 yrs) 59.4 ± 0.4 11.5 67.9 ± 0.6 15.9 51.1 ± 0.4 7.2
Age (yrs)
1–2 75.9 ± 2.7 21.2 80.3 ± 4.1 22.7 71.4 ± 3.1 19.5
3–5 75.7 ± 2.0 20.4 81.3 ± 3.3 24.1 69.5 ± 1.9 16.3
6–11 76.1 ± 1.3 22.3 81.8 ± 1.8 26.6 70.3 ± 1.6 18.0
12–18 66.5 ± 1.2 16.5 75.5 ± 2.0 21.3 56.5 ± 1.4 11.2
19–29 65.0 ± 1.1 15.5 72.2 ± 1.6 19.2 56.9 ± 1.3 11.2
30–49 65.1 ± 0.6 14.4 74.5 ± 0.9 20.2 55.1 ± 0.6 8.2
50–64 58.5 ± 0.6 9.9 65.2 ± 1.0 13.3 51.8 ± 0.7 6.5
65+ 42.7 ± 0.6 3.8 49.8 ± 0.8 5.3 37.5 ± 0.6 2.7
P-value < 0.001 < 0.001 < 0.001 < 0.001 < 0.001 < 0.001
Residence
Urban 62.3 ± 0.4 13.2 70.4 ± 0.6 17.6 54.2 ± 0.4 8.8
Rural 57.4 ± 1.1 10.9 66.7 ± 1.5 15.3 47.7 ± 0.9 6.4
P-value < 0.001 0.006 0.030 0.074 < 0.001 < 0.001
Household income
Low 57.7 ± 0.8 11.6 65.5 ± 1.2 15.2 49.8 ± 0.8 8.0
Middle-low 60.0 ± 0.8 11.3 68.7 ± 1.2 15.4 51.3 ± 0.8 7.2
Middle 62.0 ± 0.7 13.0 70.3 ± 1.1 18.0 53.7 ± 0.8 8.0
Middle-high 63.1 ± 0.8 13.8 71.5 ± 1.1 18.5 54.7 ± 0.8 9.1
High 65.3 ± 0.8 14.8 73.5 ± 1.1 19.5 57.1 ± 1.0 10.0
P-value < 0.001 < 0.001 < 0.001 < 0.001 < 0.001 < 0.001
AI stands for adequate intake. *Relative intake was calculated as dietary total vitamin E intake (%) of the AI for each sex and age group of the Korean Dietary Reference Intakes 2020. The proportion means the prevalence of subjects whose intakes were more than AI. Data are presented mean ± standard error. §Data are presented as percentage. Differences between the means by groups.

Foods that contributed most to dietary total vitamin E intake

Tables 4 and 5 show mean dietary intakes of vitamin E for each food group. For all study subjects, the major contributors to dietary total vitamin E intake were grains (1.56 mg α-TE), seasonings (1.15 mg α-TE), vegetables (1.05 mg α-TE), and fish and shellfish (0.67 mg α-TE), which accounted for 22.3%, 17.0%, 15.3%, and 7.4% of total dietary vitamin E intake (7.00 mg α-TE/day), respectively. The major contributory food groups were similar by sex and age. Dietary vitamin E intake from grains, seasonings, vegetables, fish and shellfish, and plant oils accounted for up to 70% of total vitamin E intake (Fig. 1), and this tendency was similar by survey year (data not shown).
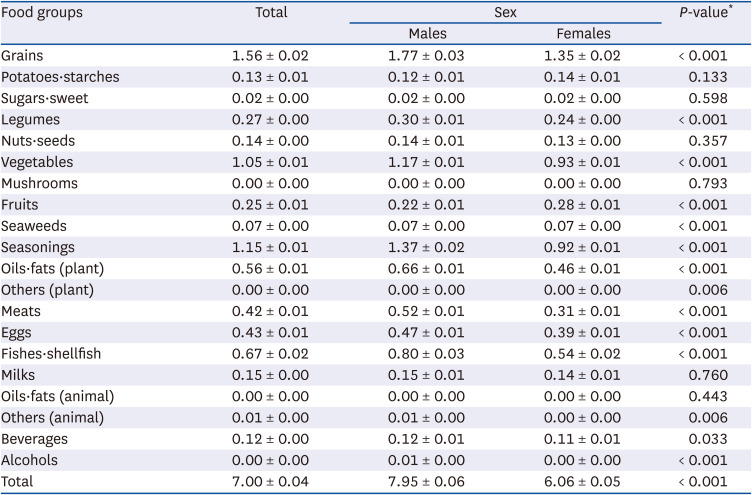
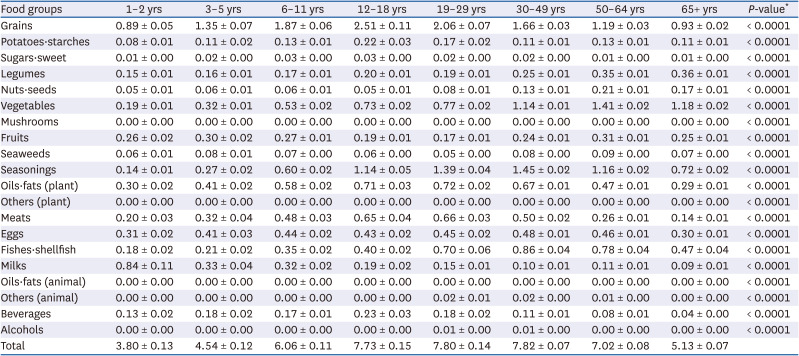
Table 4

Contributions of food groups to vitamin E intake by sex (unit: mg α-TE/day)

nrp-16-616-i004
Food groups Total Sex P-value*
Males Females
Grains 1.56 ± 0.02 1.77 ± 0.03 1.35 ± 0.02 < 0.001
Potatoes·starches 0.13 ± 0.01 0.12 ± 0.01 0.14 ± 0.01 0.133
Sugars·sweet 0.02 ± 0.00 0.02 ± 0.00 0.02 ± 0.00 0.598
Legumes 0.27 ± 0.00 0.30 ± 0.01 0.24 ± 0.00 < 0.001
Nuts·seeds 0.14 ± 0.00 0.14 ± 0.01 0.13 ± 0.00 0.357
Vegetables 1.05 ± 0.01 1.17 ± 0.01 0.93 ± 0.01 < 0.001
Mushrooms 0.00 ± 0.00 0.00 ± 0.00 0.00 ± 0.00 0.793
Fruits 0.25 ± 0.01 0.22 ± 0.01 0.28 ± 0.01 < 0.001
Seaweeds 0.07 ± 0.00 0.07 ± 0.00 0.07 ± 0.00 < 0.001
Seasonings 1.15 ± 0.01 1.37 ± 0.02 0.92 ± 0.01 < 0.001
Oils·fats (plant) 0.56 ± 0.01 0.66 ± 0.01 0.46 ± 0.01 < 0.001
Others (plant) 0.00 ± 0.00 0.00 ± 0.00 0.00 ± 0.00 0.006
Meats 0.42 ± 0.01 0.52 ± 0.01 0.31 ± 0.01 < 0.001
Eggs 0.43 ± 0.01 0.47 ± 0.01 0.39 ± 0.01 < 0.001
Fishes·shellfish 0.67 ± 0.02 0.80 ± 0.03 0.54 ± 0.02 < 0.001
Milks 0.15 ± 0.00 0.15 ± 0.01 0.14 ± 0.01 0.760
Oils·fats (animal) 0.00 ± 0.00 0.00 ± 0.00 0.00 ± 0.00 0.443
Others (animal) 0.01 ± 0.00 0.01 ± 0.00 0.00 ± 0.00 0.006
Beverages 0.12 ± 0.00 0.12 ± 0.01 0.11 ± 0.01 0.033
Alcohols 0.00 ± 0.00 0.01 ± 0.00 0.00 ± 0.00 < 0.001
Total 7.00 ± 0.04 7.95 ± 0.06 6.06 ± 0.05 < 0.001
Data are presented means ± SE.
*Differences between group means.
Table 5

Contributions of food groups to vitamin E intake by age (unit: mg α-TE/day)

nrp-16-616-i005
Food groups 1–2 yrs 3–5 yrs 6–11 yrs 12–18 yrs 19–29 yrs 30–49 yrs 50–64 yrs 65+ yrs P-value*
Grains 0.89 ± 0.05 1.35 ± 0.07 1.87 ± 0.06 2.51 ± 0.11 2.06 ± 0.07 1.66 ± 0.03 1.19 ± 0.03 0.93 ± 0.02 < 0.0001
Potatoes·starches 0.08 ± 0.01 0.11 ± 0.02 0.13 ± 0.01 0.22 ± 0.03 0.17 ± 0.02 0.11 ± 0.01 0.13 ± 0.01 0.11 ± 0.01 < 0.0001
Sugars·sweet 0.01 ± 0.00 0.02 ± 0.00 0.03 ± 0.00 0.03 ± 0.00 0.02 ± 0.00 0.02 ± 0.00 0.01 ± 0.00 0.01 ± 0.00 < 0.0001
Legumes 0.15 ± 0.01 0.16 ± 0.01 0.17 ± 0.01 0.20 ± 0.01 0.19 ± 0.01 0.25 ± 0.01 0.35 ± 0.01 0.36 ± 0.01 < 0.0001
Nuts·seeds 0.05 ± 0.01 0.06 ± 0.01 0.06 ± 0.01 0.05 ± 0.01 0.08 ± 0.01 0.13 ± 0.01 0.21 ± 0.01 0.17 ± 0.01 < 0.0001
Vegetables 0.19 ± 0.01 0.32 ± 0.01 0.53 ± 0.02 0.73 ± 0.02 0.77 ± 0.02 1.14 ± 0.01 1.41 ± 0.02 1.18 ± 0.02 < 0.0001
Mushrooms 0.00 ± 0.00 0.00 ± 0.00 0.00 ± 0.00 0.00 ± 0.00 0.00 ± 0.00 0.00 ± 0.00 0.00 ± 0.00 0.00 ± 0.00 < 0.0001
Fruits 0.26 ± 0.02 0.30 ± 0.02 0.27 ± 0.01 0.19 ± 0.01 0.17 ± 0.01 0.24 ± 0.01 0.31 ± 0.01 0.25 ± 0.01 < 0.0001
Seaweeds 0.06 ± 0.01 0.08 ± 0.01 0.07 ± 0.00 0.06 ± 0.00 0.05 ± 0.00 0.08 ± 0.00 0.09 ± 0.00 0.07 ± 0.00 < 0.0001
Seasonings 0.14 ± 0.01 0.27 ± 0.02 0.60 ± 0.02 1.14 ± 0.05 1.39 ± 0.04 1.45 ± 0.02 1.16 ± 0.02 0.72 ± 0.02 < 0.0001
Oils·fats (plant) 0.30 ± 0.02 0.41 ± 0.02 0.58 ± 0.02 0.71 ± 0.03 0.72 ± 0.02 0.67 ± 0.01 0.47 ± 0.01 0.29 ± 0.01 < 0.0001
Others (plant) 0.00 ± 0.00 0.00 ± 0.00 0.00 ± 0.00 0.00 ± 0.00 0.00 ± 0.00 0.00 ± 0.00 0.00 ± 0.00 0.00 ± 0.00 < 0.0001
Meats 0.20 ± 0.03 0.32 ± 0.04 0.48 ± 0.03 0.65 ± 0.04 0.66 ± 0.03 0.50 ± 0.02 0.26 ± 0.01 0.14 ± 0.01 < 0.0001
Eggs 0.31 ± 0.02 0.41 ± 0.03 0.44 ± 0.02 0.43 ± 0.02 0.45 ± 0.02 0.48 ± 0.01 0.46 ± 0.01 0.30 ± 0.01 < 0.0001
Fishes·shellfish 0.18 ± 0.02 0.21 ± 0.02 0.35 ± 0.02 0.40 ± 0.02 0.70 ± 0.06 0.86 ± 0.04 0.78 ± 0.04 0.47 ± 0.04 < 0.0001
Milks 0.84 ± 0.11 0.33 ± 0.04 0.32 ± 0.02 0.19 ± 0.02 0.15 ± 0.01 0.10 ± 0.01 0.11 ± 0.01 0.09 ± 0.01 < 0.0001
Oils·fats (animal) 0.00 ± 0.00 0.00 ± 0.00 0.00 ± 0.00 0.00 ± 0.00 0.00 ± 0.00 0.00 ± 0.00 0.00 ± 0.00 0.00 ± 0.00 < 0.0001
Others (animal) 0.00 ± 0.00 0.00 ± 0.00 0.00 ± 0.00 0.00 ± 0.00 0.02 ± 0.01 0.02 ± 0.00 0.01 ± 0.00 0.00 ± 0.00 < 0.0001
Beverages 0.13 ± 0.02 0.18 ± 0.02 0.17 ± 0.01 0.23 ± 0.03 0.18 ± 0.02 0.11 ± 0.01 0.08 ± 0.01 0.04 ± 0.00 < 0.0001
Alcohols 0.00 ± 0.00 0.00 ± 0.00 0.00 ± 0.00 0.00 ± 0.00 0.01 ± 0.00 0.01 ± 0.00 0.00 ± 0.00 0.00 ± 0.00 < 0.0001
Total 3.80 ± 0.13 4.54 ± 0.12 6.06 ± 0.11 7.73 ± 0.15 7.80 ± 0.14 7.82 ± 0.07 7.02 ± 0.08 5.13 ± 0.07
Data are presented mean ± SE.
*Differences between the means by groups.
Fig. 1

Contributions of food groups to dietary total vitamin E intakes of Koreans aged ≥ 1 yr.

nrp-16-616-g001
We also present the top 20 food contributors to total vitamin E intake by Koreans (Tables 6 and 7). These items accounted for up to 60% of total vitamin E intake. Baechu kimchi, red pepper powder, egg, soybean oil, and rice were the top 5 contributing food items for males and females (Table 6). However, the main source foods differed slightly in the age groups. More specifically, as regards the top 5 major contributors, snacks replaced baechu kimchi among those aged 1–18 yrs, soybeans replaced soybean oil among those aged ≥ 65 yrs, and ramyeon replaced rice among those aged 12–49 yrs.
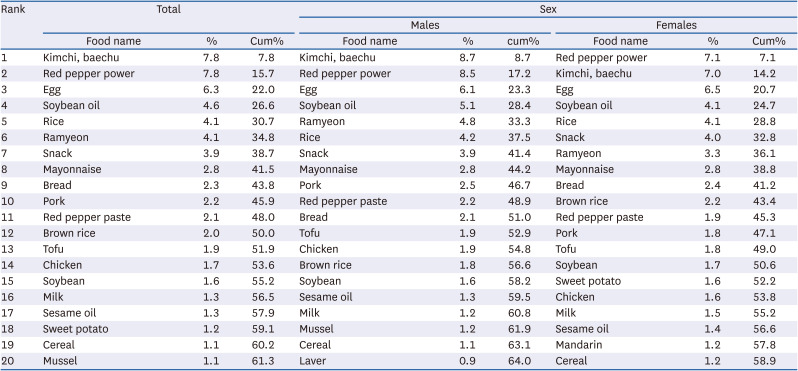
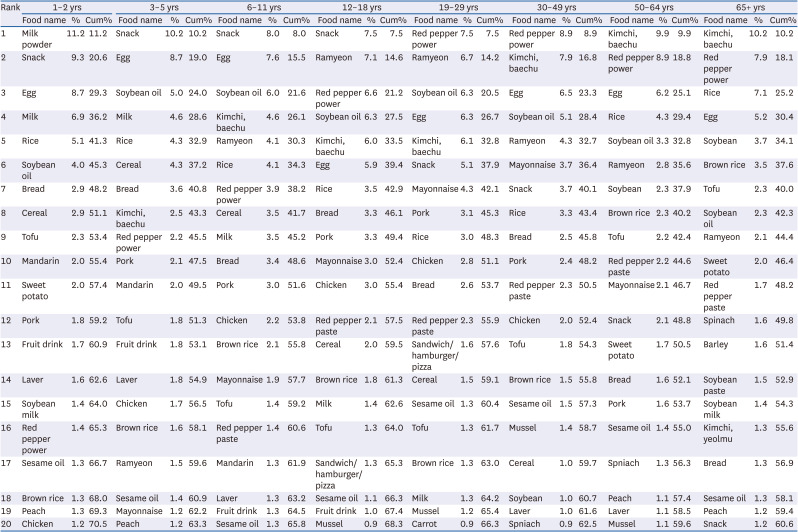
Table 6

Top 20 food contributors to total vitamin E intake by sex

nrp-16-616-i006
Rank Total Sex
Males Females
Food name % Cum% Food name % cum% Food name % Cum%
1 Kimchi, baechu 7.8 7.8 Kimchi, baechu 8.7 8.7 Red pepper power 7.1 7.1
2 Red pepper power 7.8 15.7 Red pepper power 8.5 17.2 Kimchi, baechu 7.0 14.2
3 Egg 6.3 22.0 Egg 6.1 23.3 Egg 6.5 20.7
4 Soybean oil 4.6 26.6 Soybean oil 5.1 28.4 Soybean oil 4.1 24.7
5 Rice 4.1 30.7 Ramyeon 4.8 33.3 Rice 4.1 28.8
6 Ramyeon 4.1 34.8 Rice 4.2 37.5 Snack 4.0 32.8
7 Snack 3.9 38.7 Snack 3.9 41.4 Ramyeon 3.3 36.1
8 Mayonnaise 2.8 41.5 Mayonnaise 2.8 44.2 Mayonnaise 2.8 38.8
9 Bread 2.3 43.8 Pork 2.5 46.7 Bread 2.4 41.2
10 Pork 2.2 45.9 Red pepper paste 2.2 48.9 Brown rice 2.2 43.4
11 Red pepper paste 2.1 48.0 Bread 2.1 51.0 Red pepper paste 1.9 45.3
12 Brown rice 2.0 50.0 Tofu 1.9 52.9 Pork 1.8 47.1
13 Tofu 1.9 51.9 Chicken 1.9 54.8 Tofu 1.8 49.0
14 Chicken 1.7 53.6 Brown rice 1.8 56.6 Soybean 1.7 50.6
15 Soybean 1.6 55.2 Soybean 1.6 58.2 Sweet potato 1.6 52.2
16 Milk 1.3 56.5 Sesame oil 1.3 59.5 Chicken 1.6 53.8
17 Sesame oil 1.3 57.9 Milk 1.2 60.8 Milk 1.5 55.2
18 Sweet potato 1.2 59.1 Mussel 1.2 61.9 Sesame oil 1.4 56.6
19 Cereal 1.1 60.2 Cereal 1.1 63.1 Mandarin 1.2 57.8
20 Mussel 1.1 61.3 Laver 0.9 64.0 Cereal 1.2 58.9
Table 7

Top 20 food contributors to total vitamin E intake by age

nrp-16-616-i007
Rank 1–2 yrs 3–5 yrs 6–11 yrs 12–18 yrs 19–29 yrs 30–49 yrs 50–64 yrs 65+ yrs
Food name % Cum% Food name % Cum% Food name % Cum% Food name % Cum% Food name % Cum% Food name % Cum% Food name % Cum% Food name % Cum%
1 Milk powder 11.2 11.2 Snack 10.2 10.2 Snack 8.0 8.0 Snack 7.5 7.5 Red pepper power 7.5 7.5 Red pepper power 8.9 8.9 Kimchi, baechu 9.9 9.9 Kimchi, baechu 10.2 10.2
2 Snack 9.3 20.6 Egg 8.7 19.0 Egg 7.6 15.5 Ramyeon 7.1 14.6 Ramyeon 6.7 14.2 Kimchi, baechu 7.9 16.8 Red pepper power 8.9 18.8 Red pepper power 7.9 18.1
3 Egg 8.7 29.3 Soybean oil 5.0 24.0 Soybean oil 6.0 21.6 Red pepper power 6.6 21.2 Soybean oil 6.3 20.5 Egg 6.5 23.3 Egg 6.2 25.1 Rice 7.1 25.2
4 Milk 6.9 36.2 Milk 4.6 28.6 Kimchi, baechu 4.6 26.1 Soybean oil 6.3 27.5 Egg 6.3 26.7 Soybean oil 5.1 28.4 Rice 4.3 29.4 Egg 5.2 30.4
5 Rice 5.1 41.3 Rice 4.3 32.9 Ramyeon 4.1 30.3 Kimchi, baechu 6.0 33.5 Kimchi, baechu 6.1 32.8 Ramyeon 4.3 32.7 Soybean oil 3.3 32.8 Soybean 3.7 34.1
6 Soybean oil 4.0 45.3 Cereal 4.3 37.2 Rice 4.1 34.3 Egg 5.9 39.4 Snack 5.1 37.9 Mayonnaise 3.7 36.4 Ramyeon 2.8 35.6 Brown rice 3.5 37.6
7 Bread 2.9 48.2 Bread 3.6 40.8 Red pepper power 3.9 38.2 Rice 3.5 42.9 Mayonnaise 4.3 42.1 Snack 3.7 40.1 Soybean 2.3 37.9 Tofu 2.3 40.0
8 Cereal 2.9 51.1 Kimchi, baechu 2.5 43.3 Cereal 3.5 41.7 Bread 3.3 46.1 Pork 3.1 45.3 Rice 3.3 43.4 Brown rice 2.3 40.2 Soybean oil 2.3 42.3
9 Tofu 2.3 53.4 Red pepper power 2.2 45.5 Milk 3.5 45.2 Pork 3.3 49.4 Rice 3.0 48.3 Bread 2.5 45.8 Tofu 2.2 42.4 Ramyeon 2.1 44.4
10 Mandarin 2.0 55.4 Pork 2.1 47.5 Bread 3.4 48.6 Mayonnaise 3.0 52.4 Chicken 2.8 51.1 Pork 2.4 48.2 Red pepper paste 2.2 44.6 Sweet potato 2.0 46.4
11 Sweet potato 2.0 57.4 Mandarin 2.0 49.5 Pork 3.0 51.6 Chicken 3.0 55.4 Bread 2.6 53.7 Red pepper paste 2.3 50.5 Mayonnaise 2.1 46.7 Red pepper paste 1.7 48.2
12 Pork 1.8 59.2 Tofu 1.8 51.3 Chicken 2.2 53.8 Red pepper paste 2.1 57.5 Red pepper paste 2.3 55.9 Chicken 2.0 52.4 Snack 2.1 48.8 Spinach 1.6 49.8
13 Fruit drink 1.7 60.9 Fruit drink 1.8 53.1 Brown rice 2.1 55.8 Cereal 2.0 59.5 Sandwich/hamburger/pizza 1.6 57.6 Tofu 1.8 54.3 Sweet potato 1.7 50.5 Barley 1.6 51.4
14 Laver 1.6 62.6 Laver 1.8 54.9 Mayonnaise 1.9 57.7 Brown rice 1.8 61.3 Cereal 1.5 59.1 Brown rice 1.5 55.8 Bread 1.6 52.1 Soybean paste 1.5 52.9
15 Soybean milk 1.4 64.0 Chicken 1.7 56.5 Tofu 1.4 59.2 Milk 1.4 62.6 Sesame oil 1.3 60.4 Sesame oil 1.5 57.3 Pork 1.6 53.7 Soybean milk 1.4 54.3
16 Red pepper power 1.4 65.3 Brown rice 1.6 58.1 Red pepper paste 1.4 60.6 Tofu 1.3 64.0 Tofu 1.3 61.7 Mussel 1.4 58.7 Sesame oil 1.4 55.0 Kimchi, yeolmu 1.3 55.6
17 Sesame oil 1.3 66.7 Ramyeon 1.5 59.6 Mandarin 1.3 61.9 Sandwich/hamburger/pizza 1.3 65.3 Brown rice 1.3 63.0 Cereal 1.0 59.7 Spniach 1.3 56.3 Bread 1.3 56.9
18 Brown rice 1.3 68.0 Sesame oil 1.4 60.9 Laver 1.3 63.2 Sesame oil 1.1 66.3 Milk 1.3 64.2 Soybean 1.0 60.7 Peach 1.1 57.4 Sesame oil 1.3 58.1
19 Peach 1.3 69.3 Mayonnaise 1.2 62.2 Fruit drink 1.3 64.5 Fruit drink 1.0 67.4 Mussel 1.2 65.4 Laver 1.0 61.6 Laver 1.1 58.5 Peach 1.2 59.4
20 Chicken 1.2 70.5 Peach 1.2 63.3 Sesame oil 1.3 65.8 Mussel 0.9 68.3 Carrot 0.9 66.3 Spniach 0.9 62.5 Mussel 1.1 59.6 Snack 1.2 60.6

DISCUSSION

In this study, we assessed dietary intakes of vitamin E in the general Korean population using a newly established database of the vitamin E contents of foods reported in KNHANES 2016–2019. The mean daily intake of vitamin E in Koreans aged ≥ 1 year was 7.00 mg α-TE (7.95 mg α-TE for males and 6.06 mg α-TE for females). Mean dietary vitamin E intake was 61.6% of AI for all study subjects, and 12.9% of study subjects met the AI requirement. Inadequate intake was more often observed for females, older individuals, rural residents, and those with a low income. As regards vitamin E isoforms, intakes of α- and γ-tocopherols were greatest. The major food groups that contributed to total vitamin E intake were grains, seasonings, vegetables, and fish and shellfish, which in total accounted for 62.5% of total daily intake.
The term “vitamin E” is a generic name for all tocopherol and tocotrienol derivatives that exhibit the biological activity of α-tocopherol [12]. In nature, there are eight different isoforms, namely, α-, β-, γ-, and δ-tocopherol, and α-, β-, γ-, and δ-tocotrienol. Of these isoforms, α-tocopherol is efficiently absorbed by the body and constitutes over 90% of circulating tocopherol in human plasma. α-Tocopherol has considerable biological activity [1227], and thus, some countries, including the US and Japan, have set daily dietary recommended intakes based on α-tocopherol [228]. However, plants are rich in γ-tocopherol (e.g., sesame seed and corn) and its products [29]. Furthermore, Koreans consume as much, if not more, γ-tocopherol as α-tocopherol [1011]. In the present study, the dietary intake of γ-tocopherol (6.19 mg/day) was slightly more than that of α-tocopherol (6.02 mg/day) for all study subjects. γ-Tocopherol is also present in blood, though at lower concentrations than α-tocopherol, and is known to have biological effects not exhibited by α-tocopherol [112930]. Other isoforms of vitamin E can partly substitute for α-tocopherol and may have beneficial impacts on health [22931]. Based on considerations of the biological activities of the isoforms [26], Korea, Australia, New Zealand, and European countries assess dietary vitamin E intake using α-TE equivalents [132]. Accordingly, definitions of vitamin E (as α-tocopherol or total vitamin E) and dietary vitamin E intakes (mg of α-tocopherol, mg α-TE equivalents of total vitamin E, or mg of summed individual isoform consumptions) vary slightly between studies, and thus, care is required when comparing dietary vitamin E intakes.
Nonetheless, inadequate intake of vitamin E has been reported worldwide [303334]. Péter et al.[30] systematically reviewed 176 published articles, which presented a global picture of vitamin E intakes. This comprehensive review showed that intakes of α-tocopherol and other isoforms were below recommended levels in all countries. When an estimated average requirement (EAR) of 12 mg/day was applied to all individuals aged ≥ 14 yrs, 61% were below the EAR and in North and South America, the Asia-Pacific region, and Europe 89, 68, and 55%, respectively, failed to meet the EAR. Several studies have assessed dietary vitamin E intake by Koreans [310111213]. A study that analyzed adult KNHANES 2013–2015 data reported that mean daily vitamin E intakes for Korean adult men and women were 7.5 and 6.4 mg α-TE, respectively [10]. In a study conducted in 2009–2012 on healthy adults, mean vitamin E intakes were 6.5 and 5.6 mg α-TE for men and women, respectively [12]. Another study conducted in 1997 reported that the mean vitamin E intake by adults was 9.74 mg/day and that about 63% of participants consumed less than the recommended dietary allowance (at that time) of 10 mg/day [3]. Our findings are consistent with those of the more recent study [10] but slightly higher than the findings of the older study [12], which may be partly explained by an increase in vitamin E intake over time [10]. However, caution is required when interpreting reported results because reported dietary nutrient levels depend on the assessment methods and food composition database used and on the characteristics of study populations.
In our study, inadequate vitamin E intake was more severe in females, older individuals, rural residents, and those with a low income. In particular, inadequate vitamin intake was prominent among older adults aged 65 years or older. Vitamin E is known to contribute to disease resistance and human health [57835], and thus, we suggest strategies should be agreed that ensure vitamin E intakes by older people are sufficient.
Vitamin E is abundant in nuts, seeds, legumes, and vegetable oils [14]. In the present study, grains contributed most to total dietary vitamin E intake, followed by seasonings, vegetables, and fish and shellfish. The top 5 individual food items that contributed to total vitamin E intake were baechu kimchi, red pepper powder, egg, soybean oil, and rice. These findings concur with those of previous studies on Koreans [1012], though the number two rating of seasonings was somewhat surprising. We believe that this is explained by a change in Korean diet, that is, a move away from vegetables to processed foods, and the use of a more comprehensive nutrient content database [3637]. This increasing trend of vitamin E intake due to seasonings was also found in a previous study that utilized KNHANES 2003–2015 data [10].
We estimated current intakes and identified major sources of vitamin E in the general Korean population by applying a newly established database of food vitamin E contents to raw KNHANES 2016–2019 data. This database takes into account food contents of all eight vitamin E isoforms and converts these to α-TE units, and contains almost all foods reported to be consumed in KNHANES 2016–2019. However, the study has some limitations. First, we assessed dietary vitamin E intake in foods alone. Although KNHANES surveyed the use of dietary supplements and recently assessed the intakes of several micronutrients in dietary supplements, we did not include information on vitamin E intake from dietary supplements. Second, in the KNHANES, a 24-hr dietary recall was performed according to the standardized protocol to minimize measurement errors according [1416], whereas dietary intake was assessed only for one day. Therefore, our findings on dietary vitamin E intakes may not reflect usual intakes, and thus, the prevalence of dietary inadequacy may have been overestimated [38]. Third, the consumption of processed foods continues to increase, but data on their vitamin E contents are lacking.
In conclusion, vitamin E intakes by Koreans did not meet the AI recommended by KDRI 2020. To better understand the status of vitamin E intake, further research is needed that considers contributions by dietary supplements.

Notes

Funding: This work was supported by a grant from the Korea Disease Control and Prevention Agency (2020E341200) in 2020.

Conflict of Interest: The authors declare no potential conflicts of interests.

Author Contributions:

  • Conceptualization: Shim JS, Lee HS.

  • Formal analysis: Shim JS.

  • Funding acquisition: Lee HS.

  • Investigation: Shim JS, Kim KN, Lee JS, Yoon MO, Lee HS.

  • Methodology: Shim JS, Kim KN, Lee JS, Yoon MO, Lee HS.

  • Supervision: Lee HS.

  • Writing - original draft: Shim JS.

  • Writing - review & editing: Shim JS, Kim KN, Lee JS, Yoon MO, Lee HS.

References

1. Ministry of Health and Welfare. Korean Nutrition Society. Dietary Reference Intakes for Koreans 2020. Seoul: Korean Nutrition Society;2020.
2. Institute of Medicine (US) Panel on Dietary Antioxidants and Related Compounds. Dietary Reference Intakes for Vitamin C, Vitamin E, Selenium, and Carotenoids. Washington, D.C.: National Academies Press;2000.
3. Shim JE, Paik HY, Lee SY, Kim YO, Moon HK, Kwon HH, Kim JH. Assessment of vitamin A and E status in Korean rural adult population by dietary intake and serum levels. Korean J Nutr. 2001; 34:213–221.
4. Korea Disease Control and Prevention Agency. Korean Nutrition Society. Development of Database of Vitamin D and Vitamin E for Korea National Health and Nutrition Examination Survey’s Data Processing. Cheongju: Korea Disease Control and Prevention Agency;2021.
5. Wallert M, Börmel L, Lorkowski S. Inflammatory diseases and vitamin E - what do we know and where do we go? Mol Nutr Food Res. 2021; 65:e2000097. PMID: 32692879.
6. Shams MH, Jafari R, Eskandari N, Masjedi M, Kheirandish F, Ganjalikhani Hakemi M, Ghasemi R, Varzi AM, Sohrabi SM, Baharvand PA, et al. Anti-allergic effects of vitamin E in allergic diseases: an updated review. Int Immunopharmacol. 2021; 90:107196. PMID: 33221170.
crossref
7. Browne D, McGuinness B, Woodside JV, McKay GJ. Vitamin E and Alzheimer’s disease: what do we know so far? Clin Interv Aging. 2019; 14:1303–1317. PMID: 31409980.
8. Cordero Z, Drogan D, Weikert C, Boeing H. Vitamin E and risk of cardiovascular diseases: a review of epidemiologic and clinical trial studies. Crit Rev Food Sci Nutr. 2010; 50:420–440. PMID: 20373188.
crossref
9. Peh HY, Tan WS, Liao W, Wong WS. Vitamin E therapy beyond cancer: tocopherol versus tocotrienol. Pharmacol Ther. 2016; 162:152–169. PMID: 26706242.
crossref
10. Ahn S, Jun S, Kim SA, Ha K, Joung H. H. J. Current status and trends in estimated intakes and major food groups of vitamin E among Korean adults: using the 1~6th Korea National Health and Nutrition Examination Survey. J Nutr Health. 2017; 50:483–493.
crossref
11. Kim YN, Cho YO. Vitamin E status of 20- to 59-year-old adults living in the Seoul metropolitan area of South Korea. Nutr Res Pract. 2015; 9:192–198. PMID: 25861427.
crossref
12. Ahn S, Jun S, Kang M, Shin S, Wie GA, Baik HW, Joung H. Association between intake of antioxidant vitamins and metabolic syndrome risk among Korean adults. J Nutr Health. 2017; 50:313–324.
crossref
13. Choe JS, Paik HY. Several variations of nutritional intake and quality in adults in longevity areas. J Korean Soc Food Sci Nutr. 2004; 33:668–678.
14. Korea Disease Control and Prevention Agency. 2016–2018 Guidebook for using the data from Korea National Health and Nutrition Examination Survey. Cheongju: Korea Disease Control and Prevention Agency;2020.
15. National Institute of Agricultural Sciences. Korean Food Composition Table (version 9.1). Wanju: National Institute of Agricultural Sciences;2019.
16. Ministry of Health and Welfare, Korea Centers for Disease Control and Prevention. Guidelines for Nutrition Survey: Korea National Health and Nutrition Examination Survey 6th (2013–2015). Cheongju: Korea Centers for Disease Control and Prevention;2015.
17. National Institute of Agricultural Sciences. Korean Food Composition Table (9.2 version). Wanju: National Institute of Agricultural Sciences;2020.
18. Ministry of Food and Drug Safety. Nutrition Facts of Eating-Out (2019). Cheongju: Ministry of Food and Drug Safety;2019.
19. Ministry of Food and Drug Safety. Nutrition Facts of Eating-Out (2020). Cheongju: Ministry of Food and Drug Safety;2020.
20. Ministry of Food and Drug Safety. Nutrition Facts of Processed Food (2020). Cheongju: Ministry of Food and Drug Safety;2020.
21. Ministry of Food and Drug Safety. Nutrition Facts of Processed Food (2019). Cheongju: Ministry of Food and Drug Safety;2019.
22. U.S. Department of Agriculture. Methods and Application of Food Composition Laboratory. Standard Release 28. Washington, D.C.: U.S. Department of Agriculture;2020. cited 2020. Available from: https://www.ars.usda.gov/northeast-area/beltsville-md-bhnrc/beltsville-human-nutrition-research-center/methods-and-application-of-food-composition-laboratory/mafcl-site-pages/sr11-sr28/.
23. Ministry of Education, Culture, Sports, Science and Technology. Standard Tables of Food Composition in Japan - 2015 (7th revision). Tokyo: Ministry of Education, Culture, Sports, Science and Technology;2016. cited 2020 May 3. Available from: https://www.mext.go.jp/en/policy/science_technology/policy/title01/detail01/1374030.htm.
24. Chinese Center for Disease Control and Prevention. China Food Composition Table (6th version). Beijing: Chinese Center for Disease Control and Prevention;2019.
25. Food Standards Australia New Zealand. Food Nutrient Database 2019. place unknown: Food Standards Australia New Zealand;2020. cited 2020 Sep 15. Available from: https://www.foodstandards.gov.au/science/monitoringnutrients/ausnut/foodnutrient/Pages/default.aspx.
26. National Research Council. Recommended Dietary Allowance. 10th ed. Washington, D.C.: National Research Council;1989.
27. Sauberlich HE. Laboratory Tests for the Assessment of Nutritional Status. 2nd ed. Boca Raton (FL): CRC Press;1999.
28. Ministry of Health, Labour and Welfare. Dietary Reference Intakes for Japanese (2015). Tokyo: Ministry of Health, Labour and Welfare;2015.
29. Jiang Q, Christen S, Shigenaga MK, Ames BN. γ-tocopherol, the major form of vitamin E in the US diet, deserves more attention. Am J Clin Nutr. 2001; 74:714–722. PMID: 11722951.
crossref
30. Péter S, Friedel A, Roos FF, Wyss A, Eggersdorfer M, Hoffmann K, Weber P. A systematic review of global alpha-tocopherol status as assessed by nutritional intake levels and blood serum concentrations. Int J Vitam Nutr Res. 2015; 85:261–281. PMID: 27414419.
crossref
31. Shin H, Eo H, Lim Y. Similarities and differences between alpha-tocopherol and gamma-tocopherol in amelioration of inflammation, oxidative stress and pre-fibrosis in hyperglycemia induced acute kidney inflammation. Nutr Res Pract. 2016; 10:33–41. PMID: 26865914.
crossref
32. Ministry of Health. Nutrient Reference Values for Australia and New Zealand (version 1.2). Canberra: National Health and Medical Research Council;2017.
33. Reider CA, Chung RY, Devarshi PP, Grant RW, Hazels Mitmesser S. Inadequacy of immune health nutrients: intakes in US adults, the 2005–2016 NHANES. Nutrients. 2020; 12:1735.
crossref
34. Traber MG. Vitamin E inadequacy in humans: causes and consequences. Adv Nutr. 2014; 5:503–514. PMID: 25469382.
crossref
35. Otsuka Y, Iidaka T, Horii C, Muraki S, Oka H, Nakamura K, Izumo T, Rogi T, Shibata H, Tanaka S, et al. Dietary intake of vitamin E and fats associated with sarcopenia in community-dwelling older Japanese people: a cross-sectional study from the fifth survey of the ROAD study. Nutrients. 2021; 13:1730. PMID: 34065253.
crossref
36. Kweon S, Park JY, Park M, Kim Y, Yeon SY, Yoon L, Yun S, Park S, Yang JE, Kim Y, et al. Trends in food and nutrient intake over 20 years: findings from the 1998-2018 Korea National Health and Nutrition Examination Survey. Epidemiol Health. 2021; 43:e2021027. PMID: 33872482.
crossref
37. Shim JS, Shim SY, Cha HJ, Kim J, Kim HC. Socioeconomic characteristics and trends in the consumption of ultra-processed foods in Korea from 2010 to 2018. Nutrients. 2021; 13:1120. PMID: 33805412.
crossref
38. Shim JS, Oh K, Kim HC. Dietary assessment methods in epidemiologic studies. Epidemiol Health. 2014; 36:e2014009. PMID: 25078382.
crossref
TOOLS
Similar articles