

 PDF
PDF Citation
 Print
Print


INTRODUCTION
Gastric cancer is a health problem, which remains the 5th most common cancer worldwide. In recent years, with the development of screening program and comprehensive treatment, gastric cancer prognosis has been significantly improved [1]. More patients can have long-term survival after radical gastrectomy. Therefore, the postoperative quality of life (QOL) has become a big issue in addition to surgical oncological safety.
Nowadays, significant progress has been made in defining and measuring the QOL in patients after gastrectomy. Among the multiple measures, the QOL questionnaire QLQ-C30, which was designed by the European Organization for Research and Treatment of Cancer (EORTC), has been most extensively used [2]. C30 utilizes a 30-item questionnaire to evaluate the general condition of cancer patients [34]. Since C30 is not specialized for gastric cancer, STO22 has been developed for use among gastric cancer patients with varying disease stages and treatment modalities [5]. Moreover, the esophagogastric cancer module named OG25, with 7 different evaluation scales obtained from STO22, is also recommended to supplement C30 when assessing QOL in patients with esophageal, junctional or gastric cancer [6]. All the 3 questionnaires have been translated into Korean and were validated [78].
The extent of gastrectomy and reconstruction method both have been proposed to be related to postprandial symptoms and nutritional performance that can affect the QOL after gastrectomy [910]. A general consensus states that total gastrectomy (TG) has a certain detrimental impact on the postoperative QOL, when compared with partial gastrectomy including distal gastrectomy (DG) and pylorus-preserving gastrectomy (PPG) [891112]. Despite the influences of different anastomosis types, such as gastroduodenal anastomosis in Billroth-I (DGBI), gastrointestinal anastomosis in Billroth-II (DGBII), and Roux-en-Y (DGRY), gastrogastrostomy in PPG still remains controversial [13141516]. In addition, the general condition of patients after gastrectomy usually changes from time to time [16]. A continuous follow-up of their QOL can help develop appropriate interventions to improve the QOL of gastric cancer patients.
In this study, we aimed to use C30, OG25, and STO22 to evaluate the QOL of postgastrectomy patients at different time points after surgery.
METHODS
The study was approved by the Institutional Review Board of the Seoul National University Hospital (No. 1406-108-590). Written informed consent for participation in the study was obtained from all participants.
Study participants
In this prospective study, patients with pathologically proven gastric adenocarcinoma who were expected to receive curative gastrectomy at the Seoul National University Hospital from July 2014 to May 2018 were enrolled. We excluded (1) patients who did not receive gastrectomy as their treatment modality, such as endoscopic submucosal dissection (ESD); (2) patients who did not receive curative (R0) resection; (3) patients who received combined resection; and (4) patients who recurred within 1 year after surgery.
Surgical and oncological outcomes
The following clinicopathologic data were collected and compared: age, sex, initial body weight, initial body mass index (BMI), surgical approach (open vs. minimally invasive), surgical procedures (DG vs. PPG vs. TG), pathological TNM stage, complications, and postoperative hospital stay. The severity of complications was classified according to the Clavien-Dindo classification system. Recurrence-free survival was determined by the image-based results from patients’ follow-up program [17].
Quality of life assessment
All patients were asked to fill out each questionnaire (C30, OG25, and STO22) 5 times: preoperatively, and at 3 weeks and 3, 6, and 12 months postoperatively. Furthermore, body weight was checked at every visit using the same electronic scale for all patients. All questionnaires and anthropometric data were recorded using a table-PC and were automatically transferred to an electronic medical record. The body weight loss percentage was calculated by the formula: (initial body weight – current body weight) / initial body weight × 100%.
Statistics
Statistical analyses were performed using the IBM SPSS Statistics ver. 22.0 (IBM Corp., Armonk, NY, USA) and Prism 8 (GraphPad, San Diego, CA, USA) software. Clinicopathologic features and complications were compared using the chi-square test. Quantitative surgical data including body weight, BMI, and hospital stay was compared using the Student t-test. The weight loss percentage was compared using the 1-way analysis of variance. The mean scores of each scale in the QOL questionnaires were compared between each surgery group by the Student t-test. A P-value less than 0.05 was considered statistically significant.
RESULTS
Patient characteristics and surgical outcomes
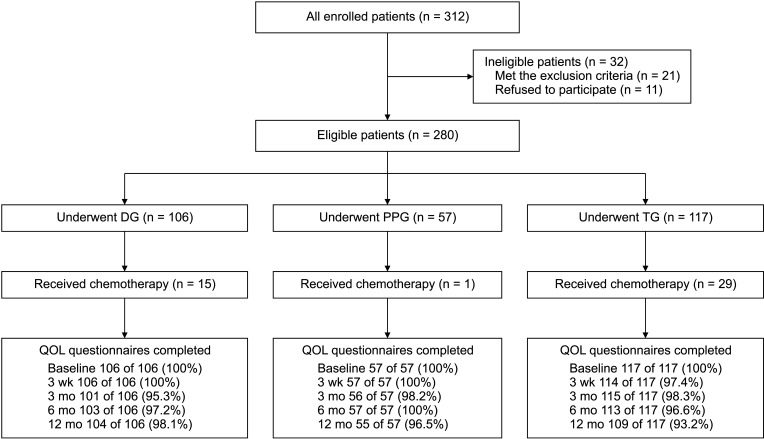
In this study, 312 patients were selected, but 11 refused to participate. After applying the exclusion criteria, 21 cases with 4 who underwent ESD, 4 who received palliative gastrojejunostomy, 1 who received concomitant distal pancreatectomy, and 12 who developed tumor recurrence during follow-up were excluded from this study (Supplementary Table 1). Among the 280 eligible patients, 106, 57, and 117 underwent DG (37.9%), PPG (20.6%), and TG (41.9%), respectively (Fig. 1).
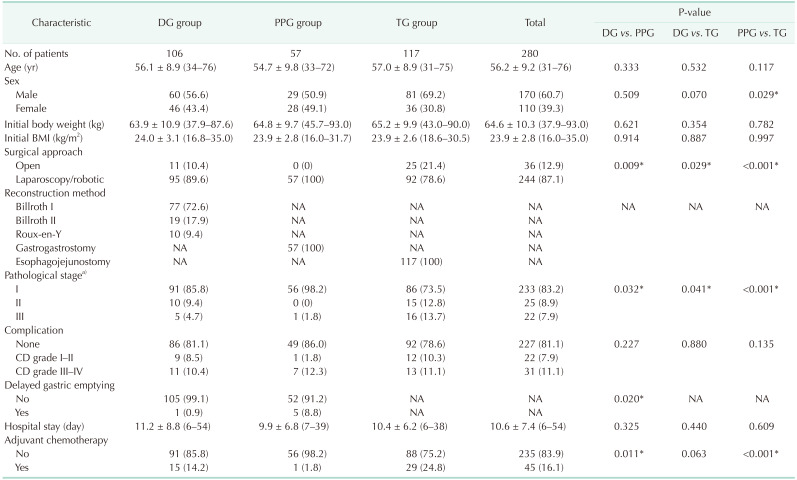
Clinicopathologic features and surgical data of these 280 cases are shown in Table 1. In the DG group, 77 patients received Billroth-I reconstruction (72.6%), 19 received Billroth-II (17.9%), and 10 with Roux-en-Y anastomosis (9.4%). More male patients were observed in TG than in PPG (69.2% vs. 50.9%, P = 0.029). The proportion of minimally invasive surgery was increasing from 78.6% in TG, 89.6% in DG to 100% in PPG (P < 0.001). Further, the proportion of stage I cases was 73.5%, 85.8%, and 98.2% in TG, DG, and PPG, respectively (P < 0.001). Although no significant difference was observed in the postoperative complications among the 3 groups, more delayed gastric emptying (DGE) was observed in PPG than in DG (8.8% vs. 0.9%, P = 0.020). However, there was no significant difference in age, initial body weight, initial BMI, and hospital stay.
For further QOL analysis, we set up a chemo-free subgroup with patients free from adjuvant chemotherapy to reduce bias, and 91, 56, and 88 cases in DG, PPG, and TG were redistributed, respectively. Clinicopathologic features and surgical data of these 235 cases in the chemo-free subgroup are shown in Supplementary Table 2. The proportion of minimally invasive surgery was 93.2% in TG, 96.7% in DG, and 100% in PPG. The proportion of stage I cases was 97.7%, 100%, and 100% in TG, DG, and PPG, respectively. Not only the surgical approach, but also the TNM stage, showed no statistical difference among DG, PPG, and TG in this subgroup analysis.
Follow-up data
The questionnaire completion rates are shown in Fig. 1. All participants were free from tumor recurrence during follow-up (Supplementary Fig. 1). Forty-five patients (16.1%) received adjuvant chemotherapy according to the treatment guideline. All of them started chemotherapy after postoperative 3 weeks. Twenty-five patients finished the course before postoperative 6 months, while the rest finished it before 1 year. The chemotherapy rate was 14.2%, 1.8%, and 24.8% in DG, PPG, and TG, respectively (Table 1).
Body weight loss according to operation type and adjuvant chemotherapy
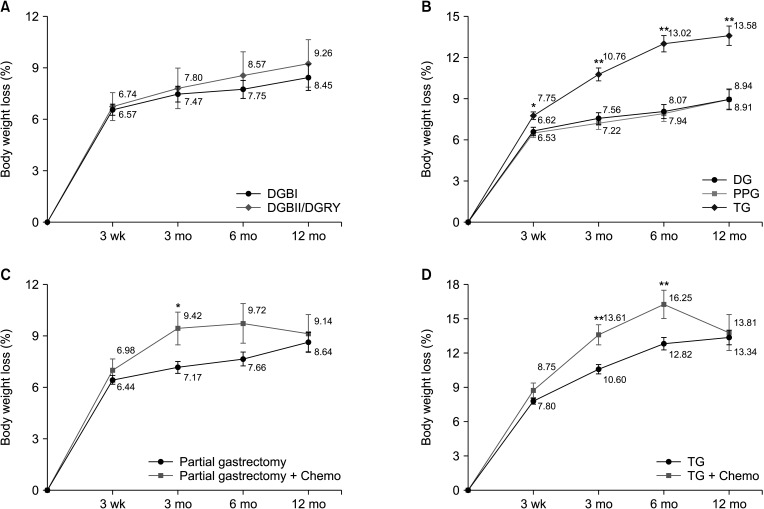
The body weight loss percentage was compared at each time point. In the chemo-free subgroup analysis, there is no significant difference between DGBI (n = 67) and DGBII/DGRY (n = 24), as shown in Fig 2A. When compared among DG (n = 91), PPG (n = 56), and TG (n = 88), patients who underwent TG showed significantly more body weight loss compared to those who underwent DG and PPG. The difference started at postoperative 3 weeks (P = 0.020), and steadily increased until postoperative 12 months (P < 0.001). However, no significant difference was detected between DG and PPG during follow-up (Fig. 2B).
In the combined chemotherapy cases, patients who underwent partial gastrectomy alone (n = 147) exhibited significantly less body weight loss compared to those who underwent partial gastrectomy with adjuvant chemotherapy (n = 16) at 3 months after surgery (P = 0.037), but no significant difference at 3 weeks, 6, and 12 months after surgery (Fig. 2C). In patients who underwent TG, cases with chemotherapy (n = 29) also had more body weight loss compared with those who received surgery alone (n = 88) at postoperative 3 months (P < 0.001) and 6 months (P = 0.004), while no difference at 3 weeks and 12 months (Fig. 2D).
Comparison of C30 scores among postgastrectomy patients without chemotherapy
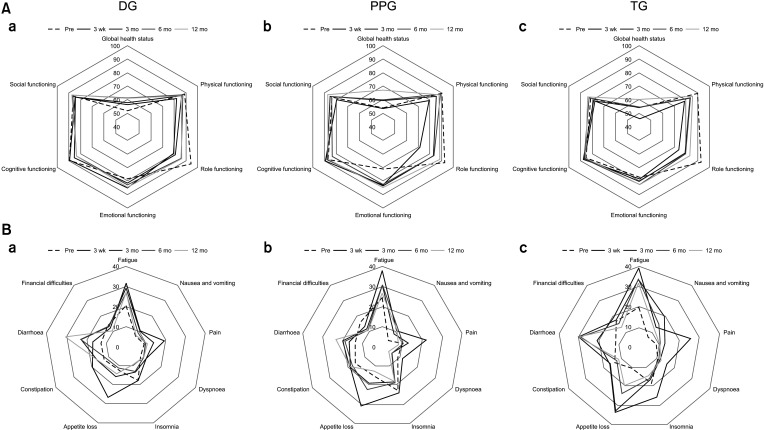
There was no significant difference in each individual score of C30 among the DG, PPG, and TG groups before surgery, except for the emotional functioning, which was better in DG than PPG (P = 0.018).
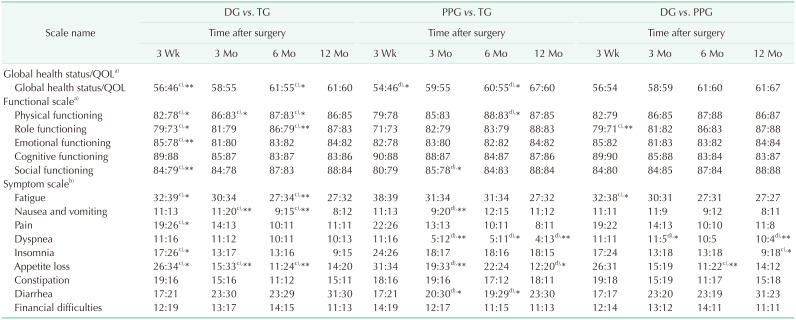
In Table 2 and Fig. 3, between DG and PPG, only the dyspnea symptom scale was observed better in PPG at postoperative 3 months (P = 0.023) and maintained until 1 year (P = 0.008). In addition, between DG and TG, DG was associated with significantly better scores for 9 out of 15 scales in C30 at postoperative 3 weeks. Global health status, physical functioning, role functioning, fatigue, nausea/vomiting, and appetite loss were observed better in DG at 2 time points or more during follow-up. However, all these significant differences disappeared at postoperative 12 months. In the comparison between PPG and TG, 5 out of 15 scales were observed with significantly better scores in the PPG group at postoperative 3 months. Global health status, diarrhea, dyspnea, and appetite loss were observed with significantly better scores in PPG at 2 time points or more, and the statistical difference in the last 2 scales was maintained until 1 year.
Patients after PPG revealed no significantly better QOL than those after DG, while both were superior to TG at 1 year postoperatively according to the C30 questionnaire.
Comparison of OG25 and STO22 scores among postgastrectomy patients without chemotherapy
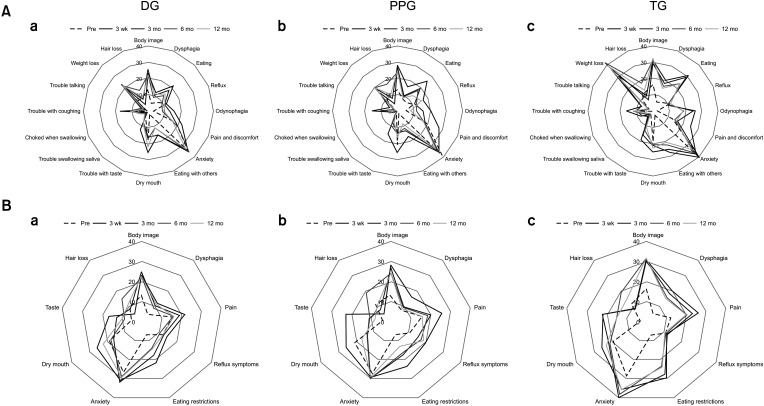
For the baseline analysis, only the symptom of pain in OG25 was significantly better in TG compared with DG (P = 0.035). In contrast, no other difference was observed among the 3 groups before surgery.
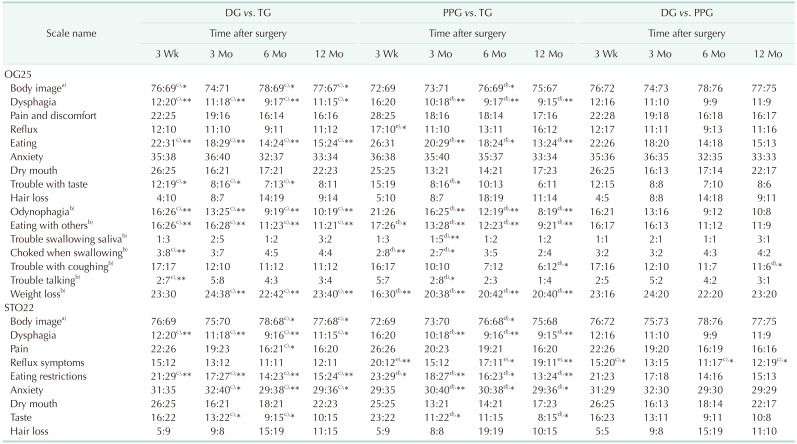
In Table 3 and Fig. 4, the symptom of trouble with coughing in OG25 (P = 0.049) showed significantly worse in DG than in PPG at postoperative 12 months, while the symptom of reflux in STO22 (P = 0.030) showed significantly better in DG than in PPG. When compared between DG and TG, the 7 scales in OG25 appeared significantly better in DG at 3 time points or more, and 6 of them (body image, dysphagia, eating, odynophagia, eating with others, and weight loss) were maintained until 1 year. However, in STO22, only 3 scales (dysphagia, eating restrictions, and anxiety) showed significantly better in DG and were maintained until 1 year. In the PPG and TG comparison, there were 5 scales (dysphagia, eating, odynophagia, eating with others, and weight loss) in OG25 that appeared significantly better in PPG at 3 time points or more, whereas there were 3 scales (dysphagia, eating restrictions, and anxiety) in STO22. In addition, the symptom of reflux in STO22 showed significantly worse in PPG than in TG (P = 0.009).
Patients who underwent PPG and DG tended to have better QOL than TG at postoperative 1 year according to both OG25 and STO22. Moreover, these differences were more obvious in OG25 when compared with STO22.
Quality of life influenced by chemotherapy
There was no significant difference between the DG and DG plus chemotherapy group (DG + Chemo) or TG and TG plus chemotherapy group (TG + Chemo), preoperatively. At postoperative 3 weeks before chemotherapy was applied, emotional functioning (P = 0.039) and dyspnea (P = 0.004) in C30 showed significantly worse in the DG + Chemo group than in DG, and symptoms of appetite loss (P = 0.010), dry mouth (P = 0.029), and weight loss (P = 0.017) were more common in the TG + Chemo group than in TG.
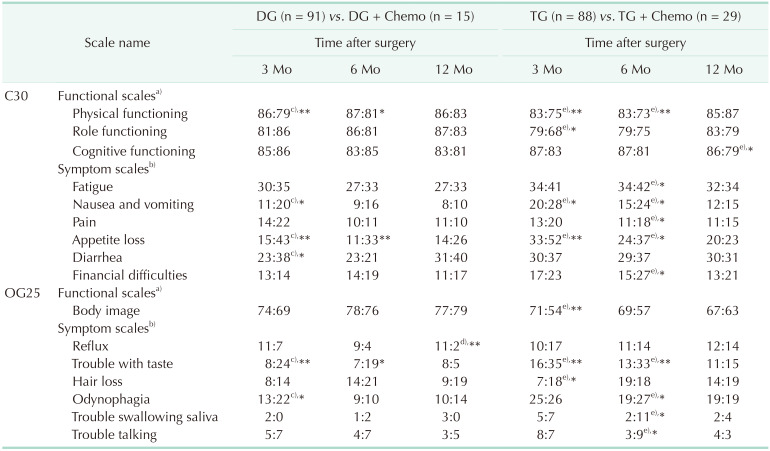
Comparing the DG and DG + Chemo groups, physical functioning, nausea/vomiting, appetite loss, diarrhea in C30 and odynophagia, and trouble with taste, odynophagia in OG25 showed significantly worse in the DG + Chemo group at postoperative 3 months when chemotherapy was started. Nonetheless, all differences disappeared at postoperative 1 year when chemotherapy was finished (Table 4). In the TG and TG + Chemo comparison, physical functioning, role functioning, nausea/vomiting, appetite loss in C30 and body image, trouble with taste, and hair loss in OG25 were observed significantly worse in the TG + Chemo at postoperative 3 months, but these differences also disappeared at the end of the follow-up (Table 4).
DISCUSSION
Patients who underwent gastrectomy would experience various body changes, such as change in body composition, digestive disorder, and psychological problems, especially within the first year after surgery. Objective measurements including blood test, imaging exam, and body composition analysis are widely used for assessing these changes. Although the QOL questionnaire is a subjective indicator, it has become increasingly important as a soft measurement in assessing both surgical and oncological outcomes [18]. Body weight loss is another objective indicator that varies widely among patients after surgery and is reported to have a marked impact on postoperative QOL changes [19].
Since the advanced cancer stage and poor oncologic outcome will severely affect QOL and body weight of cancer patients after surgery [20], we excluded patients who received extended radical surgery and palliative surgery in this study. Patients who suffered from tumor recurrence during follow-up were also excluded to avoid bias.
Generally, the volume of remnant stomach and the reconstruction method are 2 of the major factors for postgastrectomy weight loss. Nakamura et al. [14] reported that Billroth-I procedures resulted in significantly less weight loss than Roux-en-Y procedures, but the time point was at postoperative 3 years. In our study, gastroduodenal anastomosis patients were observed no significant advantage in terms of the change in body weight than those with gastrointestinal anastomosis (Fig. 2A). In addition, the QOL scores between DGBI and DGBII/DGRY also resulted in no difference (data not shown), which was consistent with previous reports [1314]. Thus, we combined them as the DG group for the following analysis. As a result, patients after TG had impaired nutrition due to the loss of stomach volume, which led to significant weight loss than DG and PPG, while no difference was observed between DG and PPG. Additionally, weight loss is more serious during the first 6 months after gastrectomy (Fig. 2B). Combining with the QOL scores, we observed that symptom of appetite loss was commonly getting worse after surgery, but the speed of offset was much slower in TG than in DG/PPG (Fig. 3B). Moreover, although postoperative emotional function and symptom of anxiety usually improve because it is compared with the time of cancer diagnosis, in this study, the degree of changings was also different depending on the surgery group (Figs. 3A, 4B). Hence, we suggest that more serious appetite loss in patients after TG may result in more weight loss. Questionnaire items such as anxious, tensed, worried, irritable, and depressed will worsen owing to their weight loss, and finally leads to poorer QOL. As a result, supportive psychiatric care and medical intervention are needed to break this negative feedback and improve their QOL after surgery, especially within postoperative 6 months.
As a typical function-preserving gastrectomy, PPG has been demonstrated to be a feasible procedure in terms of surgical and oncologic safety [2122]. However, whether PPG is superior to DG in the postoperative QOL still remains debated. Huang et al. [16] reported that laparoscopic-assisted (LA) PPG obtains QOL superiority to LADGBI, especially in symptom of fatigue, diarrhea, nausea/vomiting, and dry mouth at postoperative 12 months. Hosoda et al. [23] also reported that LAPPG group scored significantly better on diarrhea and dumping subscales than LADGBI group, but scored worse on the acid regurgitation subscale. While Eom et al. [24] found that patients after LAPPG might suffer from more pain and reflux symptoms compared to LADGBII. In our prospective study, we had a continuous view of QOL (preoperatively and postoperatively at 3 weeks, and 3, 6, and 12 months) in patients after gastrectomy. Results showed that the symptom of reflux in STO22 was observed worse in PPG than in DG and TG during the whole year follow-up, which was consistent with previous researches [2324]. Although the postoperative morbidity revealed no difference between DG and PPG, more DGE was observed in PPG than in DG (Table 1). Therefore, we suggested that DGE or pyloric dysfunction might be related to more severe reflux symptoms in patients after PPG. Besides, we believed that pyloric dysfunction might also be responsible for worse symptoms of insomnia and appetite loss found in PPG group than in DG group, and these symptoms will maintain for a long period. On the other hand, PPG group showed a significantly better outcome in dyspnea and trouble with coughing than DG group at 12 months after surgery. As a result, we suggested that optimizing the surgical procedures such as retention of pyloric blood supply and manual dilatation of pylorus will be an important issue in PPG [25]. By reducing postoperative pyloric dysfunction, we may improve the QOL of patients after PPG and benefit them from this kind of function-preserving surgery.
Postgastrectomy syndrome is believed to be more serious after TG than DG or PPG and can result in poorer QOL [811]. In this study, significant differences between TG and DG/PPG in several functional and symptom scales were also observed among all the 3 questionnaires (Tables 2, 3). Although 9 of 15 scales in C30 showed worse in TG than in DG, all these differences offset at postoperative 12 months. However, in OG25 and STO22, most differences were maintained until 1 year after surgery, which indicated that patients in the TG group suffered more from postgastrectomy symptoms than in DG/PPG for a long period. The result also proved that OG25 and STO22, as complements to C30, could help measure the QOL in postgastrectomy patients more precisely.
Nowadays, adjuvant chemotherapy is widely accepted for advanced gastric cancer treatment [17]. In clinical practice, numerous patients suffer from toxicity and have negative impacts on QOL [26]. Referring to CROSS (Chemoradiotherapy for Oesophageal Cancer followed by Surgery Study) trial for esophageal or junctional cancer, although physical functioning and fatigue remain reduced after long-term follow-up, no adverse impact of neoadjuvant chemoradiotherapy plus surgery is apparent on QOL compared with surgery alone group [27]. In SCRIPT (Simply Capecitabine in Rectal Cancer after Irradiation Plus Time) trial for rectal cancer, inferior health-related QOL was reported just after completion of adjuvant chemotherapy, and all differences were resolved at 12 months after surgery [28]. While, there is still an overall lack of research on QOL in patients with adjuvant chemotherapy after gastrectomy. According to our results, we found that physical functioning, role functioning, nausea/vomiting, appetite loss in C30 and body image, trouble with taste, and hair loss in OG25 were all observed worse in the chemotherapy group, and all scales were closely related to the side effects of chemotherapy [29]. Moreover, we observed these changings after chemotherapy were more severe in the TG group than in DG, and would take more time to recover (Table 4). A similar result was also shown in the analysis of body weight loss caused by chemotherapy (Fig. 2C, D). Although worse impaired chemotherapy compliance after gastrectomy is universal, it was reported in the REGATTA (Reductive Gastrectomy for Advanced Tumor in Three Asian countries) trial that patients after TG had the worst impaired chemotherapy compliance and might result in worse overall survival than those after DG [30]. Both results suggested that the QOL after TG was worse when combined with chemotherapy than DG. Fortunately, all these changes caused by chemotherapy were reversible and were offset at postoperative 1 year, which was consistent with previous research [27]. Therefore, we suggest supportive psychiatric care to be provided once after surgery. Moreover, certain medical intervention is needed to help patients overcome side effects during their chemotherapy period, especially in patients after TG.
This study had several limitations as follows. First, it was a prospective cohort study at a single center. Patients after proximal gastrectomy were not included in this study because the number of this type of function-preserving surgery cases was not enough for further analysis during this study. And the sample size in the chemotherapy subgroups was also relatively small. Second, uneven demographic data regarding surgical approach can be a limitation (Table 1). However, in the chemo-free subgroup analysis, no significant difference was found in surgical approach among patients with DG, PPG, and TG (P = 0.381). Third, the follow-up period was 12 months, and prolonging this period might be valuable to obtain a long-term QOL evaluation for patients who underwent gastrectomy in further study.
In summary, we utilized the EORTC instruments (QLQ-C30, QLQ-OG25, and QLQ-STO22) to assess the QOL among gastric cancer patients after DG, PPG, and TG. Consequently, PPG was similar to DG in terms of postoperative QOL and maintaining body weight, while TG was always inferior to both DG and PPG. Adjuvant chemotherapy can affect both body weight and QOL, especially in patients after TG, despite all changes being reversible.
 XML Download