INTRODUCTION
METHODS
Patients
Assessment of irAEs and ICI-T1DM
Data and sample collection
Table 1
| Patient | Age, yr | Gender | BH, cm | BW, kg | BMI, kg/m2 | Cancera | ECOG PS | ICI | No. of ICI treatment cycle | Time of onset of ICI-T1DM, wk | Symptoms at onset of ICI-T1DM | Baseline HbA1c, % | Baseline casual PG, mg/dL | HbA1c at onset, % | Casual PG at onset, mg/dL | PH of diabetes | FH of diabetes | Other irAEs | Thyroid autoantibodies | Comorbidities |
|---|---|---|---|---|---|---|---|---|---|---|---|---|---|---|---|---|---|---|---|---|
| 1 | 70 | M | 152 | 46 | 19.8 | NSCLC | 0 | P | 3 | 9 | Thirst | 5.7 | 66 | 6 | 564b | No | No | Eczema | TgAb−TPOAb− | Dyslipidemia |
| 2 | 80 | M | 157 | 48 | 19.4 | NSCLC | 0 | P | 11 | 37 | Thirst, fatigue, anorexia | ND | 108 | 7.3b | 420b | No | No | IP, Grade1 | ND | Hypertension |
| 3 | 79 | M | 182 | 61 | 18.5 | NSCLC | 1 | P | 4 | 12 | Thirst, fatigue, anorexia | 5.5 | ND | 5.3 | 404b | No | No | None | TgAb−TPOAb− | Hashimoto’s thyroiditis |
| 4 | 71 | M | 166 | 50 | 18.1 | NSCLC | 1 | P | 9 | 31 | Thirst, fatigue, body weight loss 1 kg/week, nocturnal urine | 5.9 | 121 | 8.7b | 491b | T2DM | No | None | TgAb−TPOAb− | Hypertension |
| 5 | 72 | M | 177 | 61 | 19.5 | SCLC | 1 | D | 2 | 6 | Thirst | 5.7 | 110 | 6.5b | 502b | No | No | None | TgAb−TPOAb− | None |
| 6 | 80 | F | 153 | 51 | 21.8 | MM | 1 | N/Ipi | N, 20 cycles, then Ipi once | N 60, Ipi 3, total 63 | Thirst, fatigue | 5.4 | 114 | 7.7b | 639b | No | No | None | TgAb−TPOAb− | Hypertension |
| 7 | 78 | M | 163 | 58 | 21.6 | MM | 1 | N | 14 | 29 | Thirst, fatigue | 5.5 | 90 | 8.5b | 940b | No | No | None | TgAb−TPOAb− | Hypertension |
ICI-T1DM, immune-checkpoint inhibitor-induced type 1 diabetes mellitus; BH, body height; BW, body weight; BMI, body mass index; ECOG PS, Eastern Cooperative Oncology Group performance status; HbA1c, hemoglobin A1c (reference range, 4.6%−6.2%); PG, plasma glucose (73−109 mg/dL); PH, past history; FH, familial history; irAE, immune-related adverse event; NSCLC, non-small cell lung cancer; P, pembrolizumab; TgAb, anti-thyroglobulin antibody; TPOAb, anti-thyroperoxidase antibody; ND, not determined; IP, interstitial; T2DM, type 2 diabetes mellitus; SCLC, small cell lung cancer; D, durvalumab; MM, malignant melanoma; N, nivolumab; Ipi, ipilimumab.
Table 2
| Patient | IRI at onset, μU/mL | IRI at 1 month after the onset, μU/mL | Serum CPR at onset, ng/mL | Serum CPR at 1 month after the onset, ng/mL | AMY, U/L | Blood, pHa | BE, mmol/L | HCO3−, mmol/L | BHB, μmol | AcAc, μmol | TKB, μmol | Urine ketone | NEFA, μEq/L | Anti-GAD Ab/Insulin Ab | Tumor response | Continuation of ICI |
|---|---|---|---|---|---|---|---|---|---|---|---|---|---|---|---|---|
| 1 | 0.8b | <0.4b | 0.17b | <0.02b | 83 | 7.372 | 0 | 24.9 | 818b | 452b | 1,270b | Negative | 936b | Ne/Ne | PR | Continued |
| 2 | ND | ND | <0.02b | <0.02b | 70 | 7.306b | −6.2b | 19.2b | 5,159b | 613b | 5,772b | 3+b | 2,311b | Ne/Ne | PR | Continued |
| 3 | 7.7 | <0.4b | 2.31 | <0.02b | 228b | ND | ND | ND | ND | ND | ND | ND | ND | Ne/ND | PR | Discontinued |
| 4 | 0.7b | <0.4b | 1.33 | <0.02b | ND | 7.393 | 0.1 | 24.5 | 1,778b | 583b | 2,361b | 1+b | 1,115b | Ne/Ne | PR | Continued |
| 5 | <0.4b | <0.4b | <0.02b | <0.02b | 47 | 7.43 | 6.1 | 30.8 | 2,865b | 1,093b | 3,958b | 4+b | 1,028b | Ne/Ne | PR | Continued |
| 6 | ND | ND | <0.01b | <0.01b | 47 | 7.43 | −0.2 | 24.2 | 73.4 | 57.5 | 130.9b | 1+b | ND | Ne/Po | CR | Continued |
| 7 | 2.5b | NDb | 0.16b | <0.01b | 137b | 7.234b | −10.9b | 15b | 1,374b | 726b | 2,100b | 1+b | ND | Ne/Ne | CR | Continued |
ICI-T1DM, immune-checkpoint inhibitor-induced type 1 diabetes mellitus; IRI, immunoreactive insulin; CPR, C-peptide immunoreactivity; AMY, amylase (44−132 U/L); BE, base excess (0±4 mmol/L); HCO3−, bicarbonate (22−26 mmol/L); BHB, beta-hydroxybutyrate (<74 μmol); AcAc, acetoacetic acid (14−68 μmoL); TKB, total ketone body (28−120 μmol); NEFA, non-esterified fatty acid (172−586 μEq/L); GAD, glutamic acid decarboxylase; Ab, autoantibody; Ne, negative; PR, partial response; ND, not determined; Po, positive; CR, complete response.
Cytokine and chemokine analysis
HLA-genotyping
Statistical analysis
RESULTS
Clinical characteristics of patients with ICI-T1DM
Assessment of ICI-T1DM
HLA typing results analysis
Table 3
Table 4
| HLA alleles or haplotypes | C | DRB1 | DQB1 | DPA1 | DPB1 | DRB1-DQB1 | DPA1-DPB1 | DRB1-DQB1-DPB1 | |
|---|---|---|---|---|---|---|---|---|---|
|
|
|
|
|
|
|
|
|
||
| *01:02 | *04:05 | *04:01 | *02:02 | *05:01 | *04:05-*04:01 | *02:02-*05:01 | *04:05-*04:01-*05:01 | *08:03-*06:01-*05:01 | |
| Controls, %a | 17.3 | 13.4 | 12.9 | 43.5 | 38.4 | 12.8 | 34.3 | 7.32 | 3.54 |
|
|
|||||||||
| % of alleles or haplotypes in ICI-T1DM patients (total 14) | 42.9 | 35.7 | 35.7 | 78.6 | 78.6 | 35.7 | 71.4 | 4 | 3 |
|
|
|||||||||
| No. of alleles or haplotypes in ICI-T1DM patients (total 14) | 6 | 5 | 5 | 11 | 11 | 5 | 10 | 28.6 | 21.4 |
| P valueb | 0.035d | 0.045d | 0.045d | 0.021d | 0.0075d | 0.045d | 0.016d | 0.029d | 0.039d |
| OR | 3.66 | 3.72 | 3.72 | 4.67 | 5.98 | 3.72 | 4.85 | 5.31 | 6.55 |
| 95% CI | 1.13–11.92 | 1.08–12.83 | 1.08–12.83 | 1.23–17.76 | 1.57–22.82 | 1.08–12.83 | 1.42–16.62 | 1.32–21.36 | 1.29–33.13 |
|
|
|||||||||
| No. of alleles or haplotypes in ICI-controls (total 26) | 6 | 4 | 4 | 10 | 7 | 6 | 7 | 2 | 1 |
| P valuec | NS | NS | NS | 0.022d | 0.0027d | NS | 0.0093d | NS | NS |
| OR | NA | NA | NA | 5.87 | 9.95 | NA | 6.79 | NA | NA |
| 95% CI | NA | NA | NA | 1.31–26.33 | 2.13–46.56 | NA | 1.60–28.86 | NA | NA |
HLA, human leukocyte antigen; ICI-T1DM, immune-checkpoint inhibitor-induced type 1 diabetes mellitus; OR, odds ratio; CI, confidence interval; NS, not significant; NA, not applicable.
a The frequencies in control subjects are shown to the first decimal place. Control subjects for allele analysis: Japanese Society for Histocompatibility and Immunogenetics (http://jshi.umin.ac.jp/standarization/file/JSHI-hyokiallele-2021list.pdf) (JSHI2022) [16], and for haplotype analysis: HLA Laboratory, Japan INC (http://hla.or.jp/med/frequency_search/ja/haplo/) [17];
c P value in comparison to the controls with ICI treatment [7];
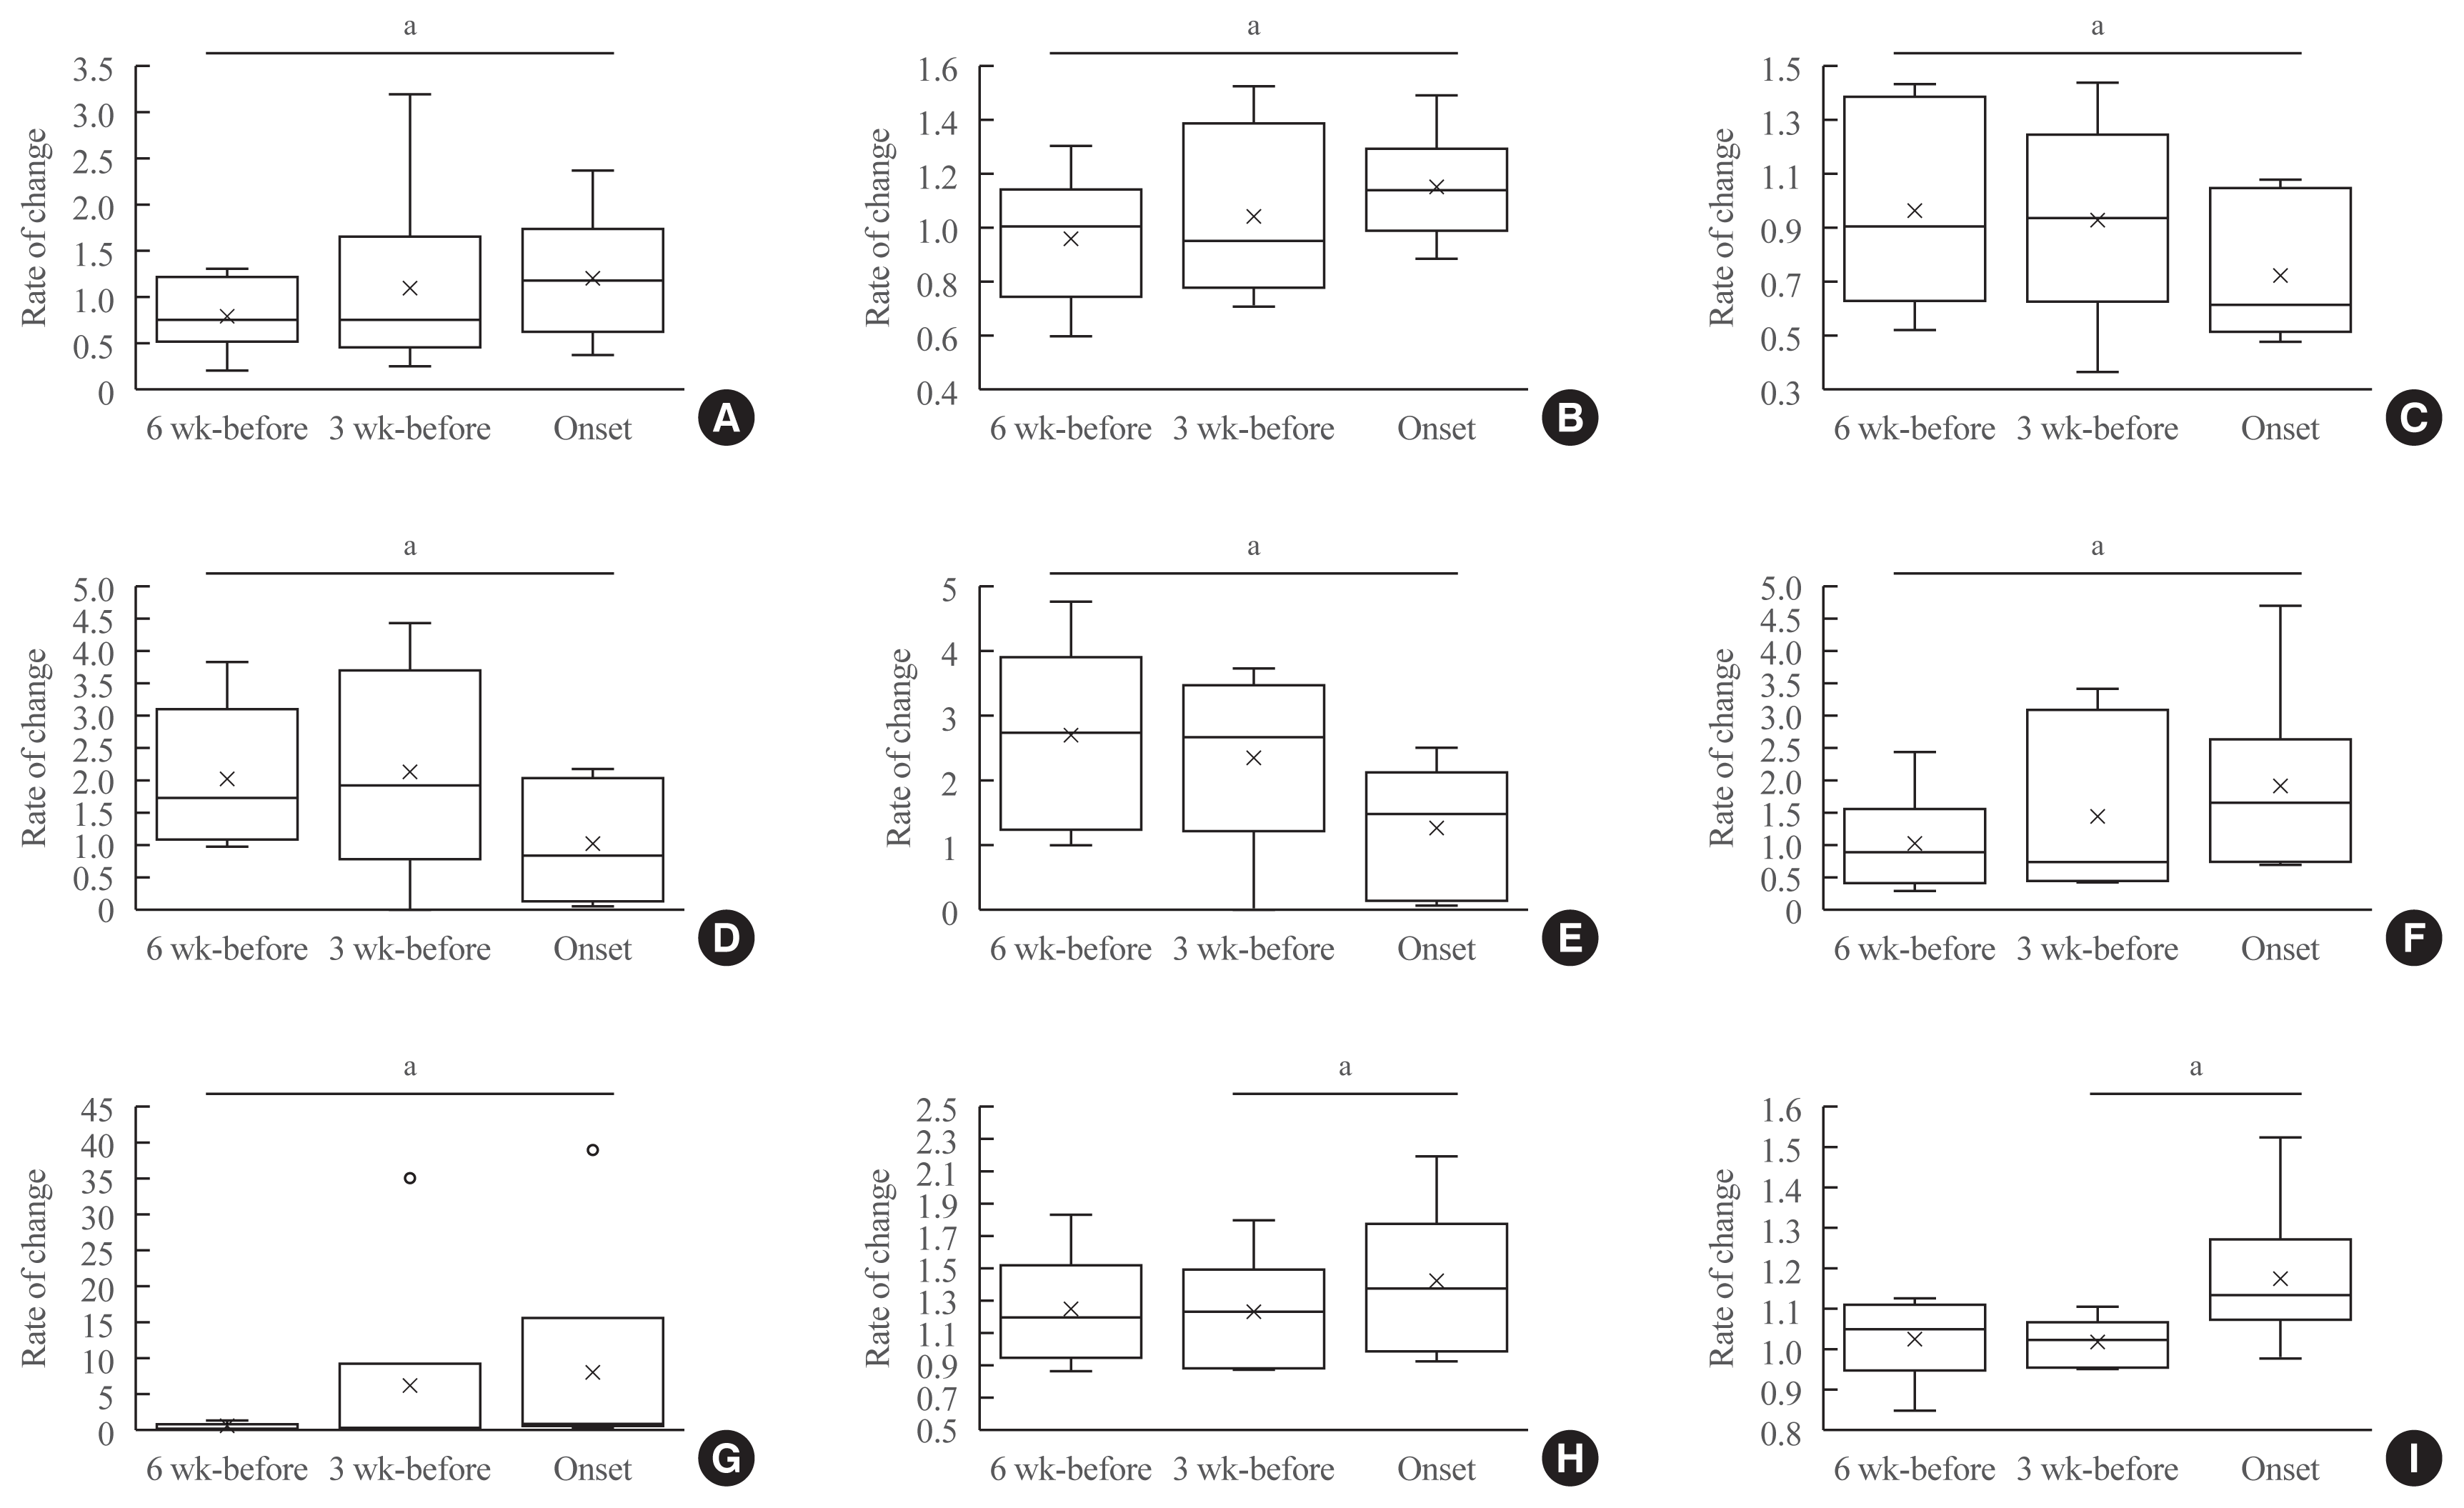
Rate of change in values for each factor after the initiation of ICI treatment
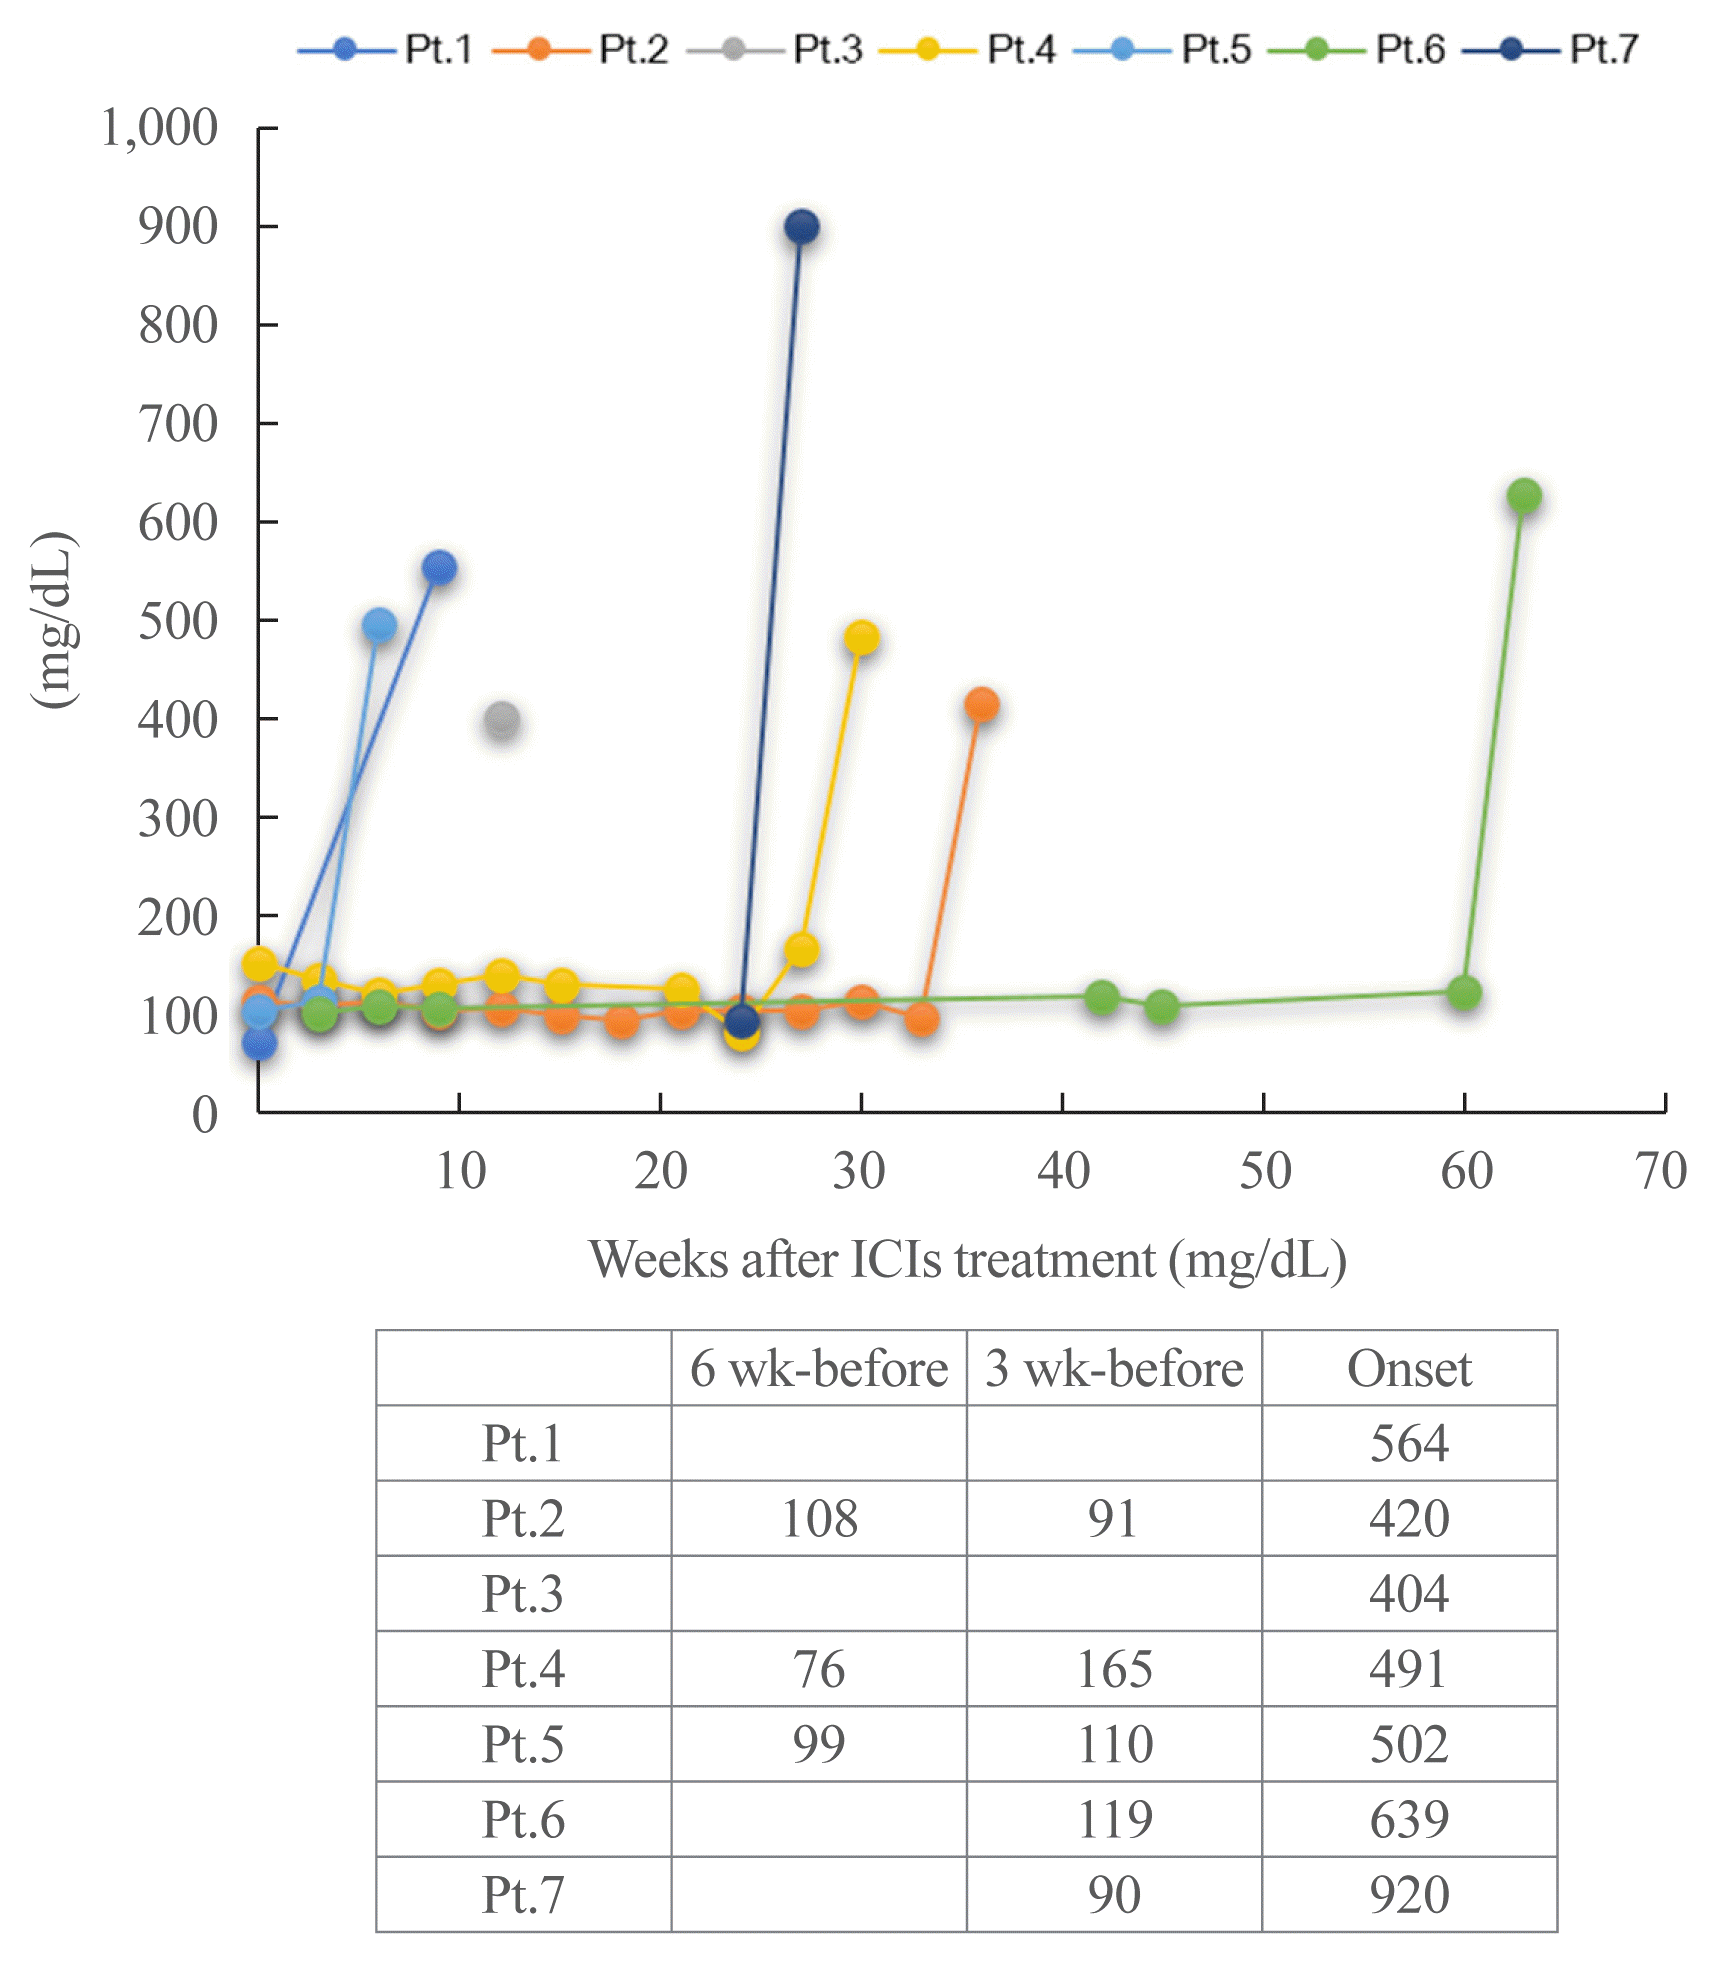
Rate of change in values for each factor at onset of ICI-T1DM
Rate of change in values for each factor for 6 weeks until the onset of ICI-T1DM
Fig. 2


 Citation
 Print
Print


 XML Download