

 PDF
PDF Citation
 Print
Print


INTRODUCTION
Excessive sodium intake has become the number one dietary cause of death worldwide [1]. It increases the risk of hypertension, stroke, cardiovascular diseases, gastric cancer, kidney diseases, and Alzheimer’s diseases, and causes complications in patients with type 2 diabetes [2345678]. According to some Japanese studies, the incidence of gastric cancer is particularly high among East Asians [9]. Sodium intake affects blood pressure in different ways. In some individuals, high sodium content diets increase blood pressure, and low sodium content diets reduce blood pressure, but in other individuals, high- or low-sodium diets have no or the opposite effect [10]. Previous studies have shown that cardiovascular disease risk and mortality rates are lower when sodium intake is below 2,300 mg per day [11]. The World Health Organization recommends a daily sodium intake of 2,000 mg or less [12], while the Global Action Plan for the Prevention and Control of Noncommunicable Diseases 2013–2020 recommends reducing sodium intake by 30% [13]. However, reducing sodium intake is not an easy task because taste is a key component of dietary choice [14].
Numerous sodium reduction programs have also been reported in many countries. In 1972, Finland launched a sodium reduction program in North Karelia [15]. The program was highly successful and continues to be implemented. In 1990, the United Kingdom launched the heartbeat award (HBA) scheme to reduce sodium, fat, and sugar additives in restaurant menus and to encourage the consumption of foods rich in dietary fiber [16]. Through extensive efforts, including the HBA scheme, the United Kingdom reported a decline in adult sodium intake from 9.5 g per day in 2003 to 8.1 g in 2011 [17]. In September 2015, New York the metropolitan government stipulated restaurants attach warning labels to menu items containing sodium at levels exceeding recommended daily consumption and launched a sodium reduction project targeting processed foods [18].
In 2012, the Ministry of Food and Drug Safety (MFDS) established the Korea Center for Sodium Reduction after the Korean Ministry of Health and Welfare (MOHW) found that average sodium intake was 4,878 mg/day [19]. In Korea, the primary sources of dietary sodium were salt (16.7%) and kimchi (11.3%), followed by soy sauce (10.0%), soybean paste (5.4%), ramen (4.5%) and red pepper paste (4.2%) [20]. Under the National Nutrition Management Act proposed by the MOHW, local governments have been establishing and implementing sodium reduction programs in restaurants and schools since 2012 [21]. In addition, MFDS launched the Sodium Reduction Restaurant Project at the local government level in 2015 to achieve a sodium intake target of 3,500 mg per day by 2020 [22]. According to the National Health and Nutrition Examination Survey [23], daily sodium intake in Korea gradually declined from 4,789.2 mg in 2010 to 3,874.2 mg in 2015, and 3,189.3 mg in 2020. However, the average sodium intake of Koreans is still twice the adequate intake (1,500 mg) of Dietary Reference Intakes for Koreans.
In 2015, the Daegu Metropolitan Government launched its Sodium Reduction Restaurant Project, and in 2018, the survey reported a sodium reduction in restaurant menus, a high level of satisfaction with the project among restaurant personnel, and a higher level of customer satisfaction with food taste among customers, which demonstrated the effectiveness and sustainability of the project [24]. In this study, we examined Sodium Reduction Restaurant Project results in Daegu for the 5-yr period 2015 to 2019, and changes in the salinities and sodium contents of certain menu items.
MATERIALS AND METHODS
Study design
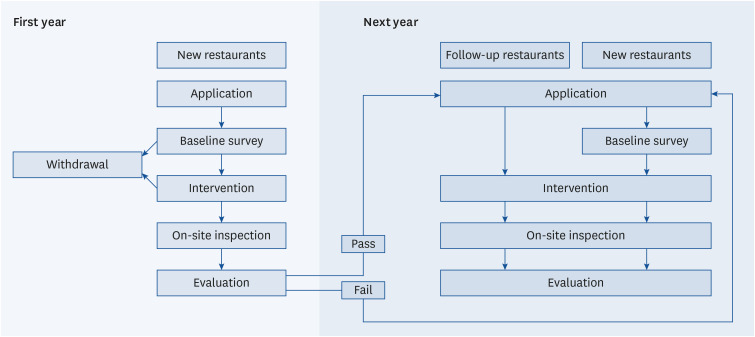
Fig. 1 provides an overview of the study design of the Daegu Sodium Reduction Restaurant Project. Participating restaurants were categorized into new restaurants and follow restaurants. New restaurants were those that applied to join the project for the first time or reapplied because they had previously failed to be designated as sodium reduction restaurants. Follow-up restaurants were those that were designated as sodium reduction restaurants in the previous year and were reapplying to retain their designations. Baseline surveys were conducted to determine the salinities and sodium contents of menu items 1 month after receipt of intervention, which included sodium reduction education and consultation on food preparation and cooking. On-site inspections were conducted in new and follow-up restaurants to determine whether they should be designated Sodium Reduction Restaurants.
Selection of sodium reduction menus
The project required restaurants to select at least 20% of their menu items, excluding non-cooked menu items (e.g., sashimi), seasonal menus, and course menus, as sodium reduction menu items. The cumulative number of menu items selected for sodium reduction by participating restaurants over 5 yrs was 163, that is, 17 cooked rice, 28 noodles, 4 porridges, 2 jeons, 9 soups, 43 broths, 26 stews, 7 grilled dishes, 3 salads, 8 stir-fried dishes, 5 steamed dishes, 2 fried dishes, and 9 other dishes.
Baseline survey
Data on single serving amounts of sodium reduction menu items were obtained from participating restaurants to measure baseline salinities and sodium contents before implementing the intervention. Baseline survey findings were used to determine appropriate interventions.
Salinity and sodium content measurements
To measure menu item salinity, a single-serving was cooled to room temperature and homogenized with a hand blender (Philips HR-1672, Hungary). Then, 20 to 50 g of the homogenate was diluted in 3- to 4-fold with distilled water. Salinity meter (ATAGO ES-421; ATAGO Co., Ltd., Tokyo, Japan) readings were recorded, and average salinity was calculated. Sodium contents per serving were calculated using the single serving amount proposed in the Restaurant Menu Nutrient Book [25]. Sodium contents were calculated as follows: salinity (%)/100 (conversion to %) × single serving amount (g) × 1,000 (conversion to mg) × 0.4 (sodium content in salt).
Intervention
Intervention included education on the importance of sodium reduction, on the relationship between sodium and health, instructions on low-sodium cooking methods, salinity measurement and management methods, and the use of a salinity management app (NaCodi). All personnel in each restaurant underwent 2 tailored consulting sessions on low-sodium cooking and instructed to measure the salinities of sodium reduction menu items more than once per month and input the results in the NaCodi app.
On-site inspection
On-site inspections of restaurants participating in the Sodium Reduction Restaurant Project were conducted according to the Sodium Reduction Restaurant Operation and Management Guidelines [22]. On-site inspections included checklist-based assessments and salinity and sodium analyses of single-serving sodium reduction menu items collected from restaurants by mystery shoppers.
Evaluation
Evaluation items were categorized into mandatory items and optional items. Mandatory items included “sodium reduction menu ratio” (20 points), “sodium reduction rate” (20 points), and “salinity meter placement” (10 points), and optional items included “sodium management for a month” (10 points), “sodium content management” (10 points), “use of measuring tools” (10 points), “no seasoning containers on tables” (10 points), and “sodium management in kimchi” (10 points). Thus, the maximum possible score was 100 points. For follow-up restaurants, 2 additional items were added: “signboard attachment” (10 points) and “menu board attachment” (10 points). Points assigned to “sodium reduction menu ratio” and “sodium reduction rate” were adjusted to 10, respectively, to maintain a total possible score of 100 points.
Sodium reduction menu ratio evaluates whether a restaurant selected at least 20% of its menu items for the project. In contrast, the sodium reduction rate determines whether a restaurant reduced sodium by content by at least 10 to 30% of the reference sodium content for the same items listed in the Restaurant Menu Nutrient Book [25]. For example, if the sodium content of a menu item was below 2,000 mg in the Nutrient Book, the restaurant concerned was required to reduce sodium in the menu item by at least 10% of the reference sodium content, making the sodium content below 1,300 mg. For menu items with sodium contents of ≥ 2,000 mg per serving, restaurants were required to reduce the sodium content by 30% of the reference. For menu items not listed in the Restaurant Menu Nutrient Book [25], the upper limit was defined based on the sodium contents of other foods with similar main ingredients and prepared using similar cooking methods.
Designation of sodium reduction restaurants
To be designated as a sodium reduction restaurant, a restaurant must have satisfied all mandatory items, acquired a score of at least 70 points, and not have any previous records of administrative disposition. Designated Sodium Reduction Restaurant received appropriate sodium reduction certificate from the MFDS and local government.
Statistical analysis
The statistical analysis of survey data was conducted using SPSS Statistics 26 (IBM, Chicago, IL, USA). The significances of differences between baseline and post-intervention measurements of salinity and sodium contents at participating restaurants between 2015 and 2019 were determined using the paired t-test. Longitudinal trends of sodium contents at restaurants that participated in the project for 2 to 5 yrs were analyzed by 1-way analysis of variance, Duncan’s multiple comparison test, and P-values for the trend test. Sodium reduction rate variations for restaurants that participated for different durations were analyzed using 1-way analysis of variance and Duncan’s multiple comparison test. The longitudinal trends of sodium contents by menu item type were analyzed using the same tests.
RESULTS
Number of participating restaurants
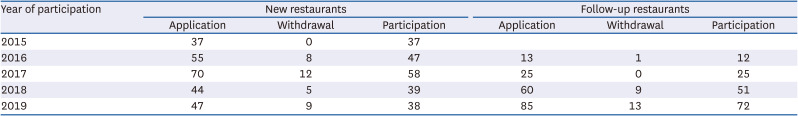
Table 1 lists the number of restaurants that applied, withdrew, or participated in Daegu’s Sodium Reduction Restaurant Project on an annual basis. Every year for 5 yrs, 37 to 70 new restaurants applied for their first designation. However, up to 12 new applicants withdrew before on-site inspection, which resulted in only 37 to 58 restaurants participating in the project. In 2016, 13 restaurants applied for follow-up designation, and numbers of sodium reduction restaurants continued to accumulate in subsequent years, and in 2019, 85 follow-up restaurants applied for the designation. However, only 72 restaurants participated, and 13 withdrew before on-site inspections.
Table 1
Number of restaurants participating in the Sodium Reduction Restaurant Project
Comparison of the salinities and sodium contents of sodium reduction menus after intervention
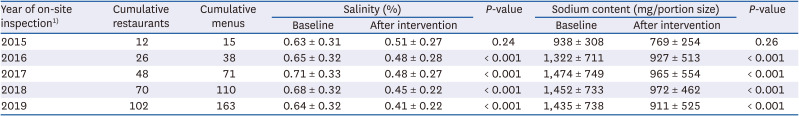
Table 2 shows the salinities and sodium contents of sodium reduction menus at follow-up restaurants between 2015 and 2019. The cumulative number of participants between 2015 and 2019 was 102, while the cumulative number of menu items for the same period was 163. Post-intervention salinities and sodium contents significantly reduced below baseline values reported in 2016 (P < 0.001), 2017 (P < 0.001), 2018 (P < 0.001), and 2019 (P < 0.001). However, sodium content and salinity differences before and after intervention were not significant in 2015.
Table 2
Comparison of the salinities and sodium contents of all sodium reduction menu items between baseline and on-site inspection after intervention
Trends in sodium reduction menus at 5-yr follow-up restaurants
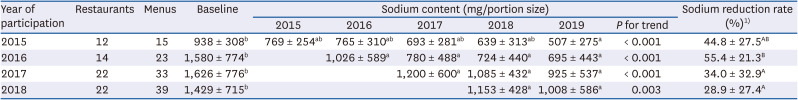
Table 3 shows the sodium contents and reduction rates of sodium reduction menu items offered by 2- to 5-yr follow-up restaurants. Sodium contents fell across all follow-up restaurants regardless of the duration of participation. Restaurants that joined the project in 2015 (P for trend < 0.001), 2016 (P for trend < 0.001), 2017 (P for trend < 0.001), or 2018 (P for trend = 0.003) showed significant declines in post-intervention sodium contents until 2019.
Table 3
Comparison of the sodium contents of sodium reduction menu items from baseline to 2019
The values are reported as the mean ± SD.
a-bMeans with different small letters in the same row are significantly different according to Duncan’s multiple range test (P < 0.05).
A-CMeans with different capital letters in the same column are significantly different according to Duncan’s multiple range test (P < 0.05).
1)Sodium reduction rate (%) = (baseline sodium content − 2019 sodium content)/baseline sodium content × 100.
Sodium reduction rates in 2019, as compared with baseline sodium contents, were 44.8%, 55.4%, 34.0%, and 28.9% for 5-, 4-, 3-, and 2-yr participants, respectively. In addition, the 4-yr participant rate was significantly higher than the 3- and 2-yr rates (P < 0.05).
Comparison of the sodium content of broth, stew, and noodle dishes from baseline to 2019
Table 4 shows the sodium contents of broth, stew, and noodle dishes of 5-yr participants and that sodium contents declined significantly from baseline to 2019 (P < 0.05). In addition, the sodium contents of broth dishes offered by restaurants that participated in the project since 2016 continued to decrease until 2019 (P for trend < 0.001). Sodium content reductions were also evident for the noodle and broth dishes offered by participant restaurants in 2017 (P for trend < 0.003; P for trend < 0.001) and in 2018 for broth dishes (P for trend = 0.014). However, significant changes were not observed in 2018 for stew dishes (P for trend = 0.644).
Table 4
Comparison of sodium contents of broth, stew, and noodle dishes from baseline to 2019
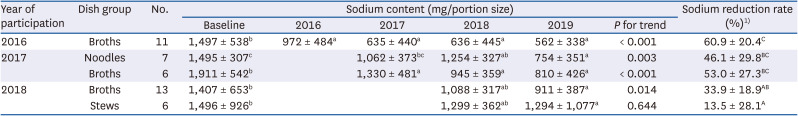
The values are reported as the mean ± SD.
a-cMeans with different small letters in the same row are significantly different according to Duncan’s multiple range test (P < 0.05).
A-CMeans with different capital letters in the same column are significantly different according to Duncan’s multiple range test (P < 0.05).
1)Sodium reduction rate (%) = (baseline sodium content − 2019 sodium content)/baseline sodium content × 100.
Broth dishes had the highest sodium content reduction rate from baseline in 2019 (60.9%). This was not significantly higher than reduction rates for noodle and broth dishes in 2017 (46.1% and 53.0%, respectively) but was significantly higher than those of broth and stew dishes in 2018 (33.9% and 13.5%, respectively).
Evaluation of on-site inspection results
Table 5 shows the scores of annual on-site inspections. In 2015, 14 of 37 new applicants were designated as sodium reduction restaurants. In contrast, 35 of 38 new applicants were designated, and 68 of 72 follow-up restaurants obtained re-designation in 2019 when 103 restaurants were designated as sodium reduction restaurants.
Table 5
Annual on-site inspection score and pass ratios
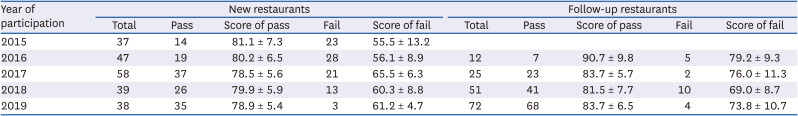
The evaluation scores of new restaurants over the 5-yr study period ranged from 78.5 to 81.1, and those of follow-up restaurants were between 81.5 and 90.7, which exceeded the pass threshold (70). Evaluation scores of rejected new and follow-up restaurants ranged between 55.5 and 65.5 and 69.0 and 79.2, respectively.
Final on-site inspection evaluation scores in 2019 are listed in Table 6. The maximum score of the newly designated restaurants was 85.0, whereas the maximum score of the rejected new restaurants was 65.0 and the score of sodium reduction rate was 0. The maximum score of the follow-up restaurants designated as sodium reduction restaurants was 95.0, while the maximum score of rejected follow-up restaurants was 89.0. Though these restaurants received a perfect score for percentage sodium reductions for many menu items and salinity meter use, they only received a score of 4.5 for sodium reduction rate.
Table 6
Evaluation scores of on-site inspections conducted in 2019
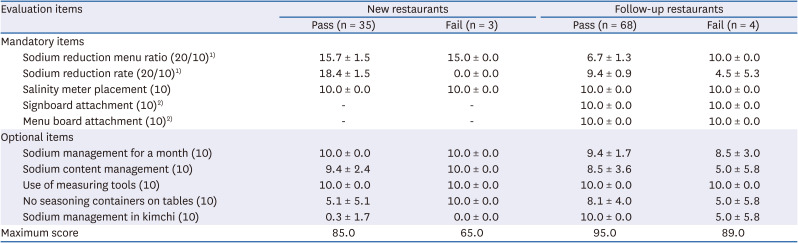
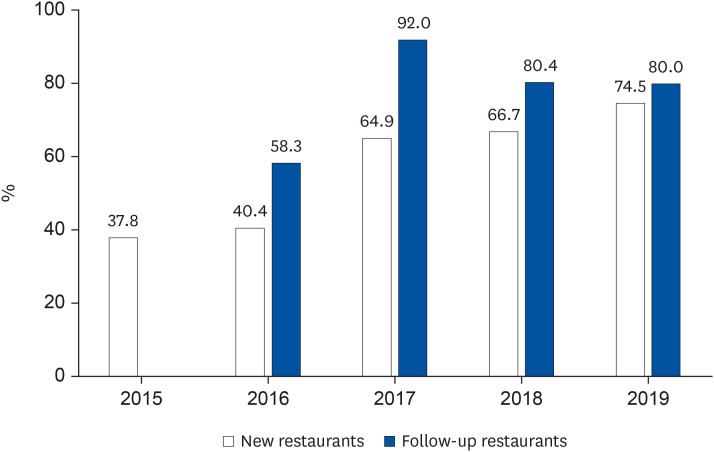
Fig. 2 shows pass ratios between 2015 and 2019. The pass ratio of new restaurants increased annually, from 37.8% in 2015 to 74.5% in 2019, and that of follow-up restaurants also increased from 58.3% to 80.0%.
DISCUSSION
In this study, we analyzed salinity and sodium content changes in sodium reduction menu items at restaurants participating in the Daegu Sodium Reduction Restaurant Project. This project was launched in 2015 with 37 participants, and in 2019, 110 restaurants participated in the project, and 103 of these were designated Sodium Reduction Restaurants.
Restaurants must obtain a total score of at least 70 points during on-site inspections to pass, and they also must meet operational requirements for sodium reduction ratio and sodium reduction rate criteria. A review of 2019 on-site inspection results showed that new restaurants designated as Sodium Reduction Restaurants received a total score of 78.9 and satisfied all operational requirements even if they did not receive any points for kimchi sodium control. On the other hand, rejected restaurants failed to score ≥ 70 points and received zero points for sodium reduction rate. Unlike new restaurants, follow-up restaurants scored 10 out of 10 for kimchi sodium control and achieved a high total score of 83.7. On the other hand, rejected restaurants scored ≥ 70 but did not meet the 10% sodium reduction rate requirement.
When the sodium reduction rates of participating restaurants (2015–2019) were analyzed that of 4-yr participants (2016–2019) was found to be 55.4%, and the reduction rate for broth dishes was 60.9%. The sodium reduction rate of 3-yr participants was 34.0%, and reduction rates for their noodle and broth dishes were 46.1% and 53.0%, respectively. Two-year participants reduced sodium content by 28.9% and achieved a 33.9% reduction in broth menu items. These findings show sodium reduction rates increased with duration of participation.
In this study, follow-up restaurants reported higher pass ratios than new restaurants, which indicates restaurants that continued with the project found it easier to pass evaluations, which indicates the support of government is required to ensure continuation of the project.
For evaluations, salinities of all menu items were measured and converted to sodium contents based on single serving data in the Restaurant Menu Nutrient Book [25]. In 2013 and 2014, a research project conducted in the United States [26] examined how adults and adolescents estimate sodium contents in fast-food restaurant menus, and concluded that subjects underestimated menu item sodium contents by 50–100%. Thus, sodium content labels are needed to determine the sodium contents of restaurant menu items and home-cooked dishes. On the other hand, salinity can be assessed by the gustatory system. According to the results of the 2018 Sodium Reduction Restaurant Project in Daegu, personnel at participating restaurants were highly perceptive of the salinities of different foods and reported high satisfaction with the salinity measurement method [24]. In addition, the use of salinity meters increased sodium reduction awareness among restaurant personnel [27].
Throughout history, Koreans have relied on microorganisms and fermentation techniques to preserve foods. Sauces, such as soybean sauce (ganjang), soybean paste (doenjang), and red pepper paste (gochujang), are key components of the Korean diet [28] and serve as primary sources of sodium [20]. In addition, Koreans typically consume rice, soup, and other side dishes during single meals [28]. As this study presents sodium contents of main dishes, sodium intakes from single meals are higher because of the sodium contents of side dishes. For some sodium reduction menu items such as bone soup (gomtang) and ginseng chicken soup (samgyetang), salt is added by customers after dishes are served, and thus, surveyed salinity and sodium contents are lower than actual sodium intakes.
Taste plays an important role in food choices. A moderate level of salinity (isotonicity, 150 mM, around 0.875%) is known to provide the most attractive taste, and as a result, daily salt intakes do not vary significantly regardless of culture [14]. According to a 2013 study, Korean men and women preferred saline concentrations of 270.6 mM and 213.1 mM, respectively [29]. In the present study, baseline salinity was lower than 0.875% (150 mM) and dropped to 0.41% in 2019, depending on participation duration. Hence, our findings confirm the argument that lower salt intake results in a preference for less salty diets [30]. According to Ma et al. [24], restaurant owners that participated in Daegu’s Sodium Reduction Restaurant Project reported high project satisfaction (41.1 out of 50). Furthermore, according to the findings of a customer satisfaction survey of sodium reduction menu items, customers received the items positively, and 25.0% and 48.9% of surveyed customers responded that the dishes were “very delicious” or “delicious,” respectively.
Lee et al. [31] suggested the following barriers to the sodium reduction project: people’s nutrition knowledge, restaurant use of processed foods, and the limited cooking techniques of restaurant personnel. Under the Sodium Reduction Restaurant Project, the Daegu Metropolitan Government made extensive efforts to spread and publicize nutrition knowledge among its citizens and provided training on low-sodium cooking methods in restaurants, and required signboards and salinity or sodium content labels for evaluation items in follow-up restaurants. The project also set required sodium reduction percentages for menu items at 20%, which reduced the compliance burden on restaurants. Although it would have been ideal had participating restaurants avoided the use of processed foods as ingredients, a franchise restaurant that participated in the project was required by its head office to use at least a certain amount of kimchi each month. For this reason, the restaurant used a large amount of kimchi when preparing kimchi stew (kimchi jjigae), which was one of its main menu items, and thus, because kimchi has a high sodium content, this restaurant could not join the sodium reduction project.
Overall, the Daegu Sodium Reduction Restaurant Project appears to have overcome the barriers mentioned above. However, labels at participating restaurants only indicated the sodium contents of sodium reduction menu items, which demonstrates a need for warning labels on high sodium menu items. According to a previous study, nutrition labels with warning messages raise customer awareness of the sodium contents of menu items and promote the consumption of food items with lower sodium contents [32].
Many countries are taking a keen interest in the sodium contents of restaurant food items. Based on the results of a study conducted on 66 top-earning chain restaurants between 2012 and 2016 in the United States, the government encouraged restaurants to voluntarily reduce sodium contents in accordance with the National Salt Reduction Initiative. However, surveyed restaurants did not change their existing recipes but rather introduced new low sodium menus to meet consumers’ demands and government policies. Disappointingly, the menus produced reduced sodium contents by only 104 mg in 2016 as compared with 2012 [33]. Canada also failed to report a significant decline in the sodium contents of restaurant menus between 2012 and 2016 [34]. These studies indicate the need for government intervention to regulate and incentivize restaurants to reduce the sodium contents of menu items.
In conclusion, this study shows that the Sodium Reduction Restaurant Project effectively reduced the sodium contents of menu items in participating Daegu restaurants. In particular, multi-year participants had significantly greater sodium reduction rates. We hope the success of this project encourages other regions to implement sodium reduction projects to improve the health of their citizens.
 XML Download