

 PDF
PDF Citation
 Print
Print


INTRODUCTION
Globally, the elderly (≥ 65 years old) population in 2020 was estimated to be ≤ 727 million and the world’s population to be 7.8 billion, which in percentage terms is 9.3%, and this percentage is predicted to increase to 16.0% in 2050, that is, by the middle of the 21st century, one sixth of the world’s population will be elderly. This societal aging is caused by socioeconomic and scientific developments and the implementation of policies like public health policies [1]. In Korea, the percentage of elderly individuals increased to 7.2% in 2000 and 14.3% in 2018 and is expected to increase to 20.3% in 2025 [2]. Increased social costs are one of many problems posed by societal aging. In particular, aging is associated with restricted mobility, chronic diseases, dietary intake, and exercise difficulties [34].
A well-balanced diet is important for health and quality of life in the elderly, and improper nutrition could lead to weakness and immunity decline [4]. Regarding the elderly at home and facilities like nursing homes, actual dietary intakes are often less than dietary recommendations and increase the risk of malnutrition [5]. The elderly suffering from chronic underlying diseases in different facilities often have poor appetites and intake difficulties, and their total energy and micronutrient intakes are low, as are indicators of nutritional status such as hemoglobin, folic acid, and albumin blood levels [67]. In a study on the elderly at nursing homes in Korea, mean energy intake was 1,360.2 kcal for men and 1,378.0 kcal for women, which were 68.0% and 86.1% of energy intake standards, respectively [8]. Furthermore, according to a study on nutritional intake statuses of the elderly admitted to welfare facilities in Korea, energy intakes were lower than recommended, and the nutritional statuses of riboflavin, vitamin C, vitamin D, calcium, and potassium were poor [9].
In a cross-sectional, multi-center study on patients in Belgian geriatric hospitals [10], just 24% of 2,329 research subjects had a satisfactory nutritional status while 33% and 43% were malnourished or at risk of malnutrition, respectively. Notably, in the elderly with swallowing difficulties, the rate of malnutrition was five times higher than among healthy elderly people, and elderly living in nursing homes or with a taste disorder were 3 and 2.5 times more likely to be malnourished, which emphasized the need for effective nutrition management policies. The oral health of the elderly is also directly connected to nutrition. Of 3,220 elderly patients at nursing homes in the Netherlands, 25.6% had a problem with chewing, and 10.1% had a problem with dietary intake because of dental problems [11]. Notably, in the elderly with denture problems, the risk of malnutrition was increased two-fold, which demonstrated the importance of oral health in nursing homes.
As one of the representative countries in which societal aging is rapidly progressing, Korea instituted a long-term care insurance system for the elderly to ensure health maintenance and life stability in 2008, which functions in concert with a national-level social welfare system [12]. Also, to secure safe food for the vulnerable, the Korean Ministry of Food and Drug Safety of Korea established ‘regulations on foodservice management support for the vulnerable’ in 2019 [13]. As a result, some local governments have installed Centers for Social Welfare Foodservice Management (CSWFMs), and then support their operations by providing menus, food hygiene & nutrition management, and education to welfare facilities for the elderly that manage less than 50 foodservice recipients per meal, and thus, allows them to operate without hiring a dietitian under the Food Sanitation Act. CSWFMs target vulnerable groups such as the elderly with underlying diseases like dementia, high blood pressure, and diabetes. This system is similar to the Center for Children's Foodservice Management (CCFM), which was instituted in 2011 [14]. CSWFMs have been established on a trial basis in seven Korean cities, and dietitians hired by the center in Cheongju City support foodservice management by targeting the foodservices of 40 welfare facilities for the elderly such as nursing homes and daycare centers. In addition, the center provides hygiene and nutrition education to cooks, directors of facilities, and the elderly in facilities, and the necessary menus, educational materials, and supplies. This study was undertaken to determine the effects of support from the center by comparing the statuses of foodservice nutrition management of 40 welfare facilities for the elderly supported by the CSWFM of Cheongju City and by investigating the effects of the support provided. The results of this study could be used as basic data for foodservice management support for the vulnerable, including the elderly.
SUBJECTS AND METHODS
Research subjects and duration
This study researched the current status of foodservice nutrition management as determined by direct visits by dietitians of the Cheongju CSWFM, to 40 foodservices such as nursing homes and daycare centers for the elderly in Cheongju City. From July to December 2019, three visits were performed to each foodservice. First visits were performed during July-August, second visits during September-October, and third visits during November-December. The results were reviewed and approved by the Seowon University Research Review Committee (approval number 1040820-202102-HR-001-02), which also approved the research and publication of results. In addition, consent for this study was received from the directors of the 40 facilities.
Survey method and contents
This study researched the statuses of foodservice nutrition management at the 40 subject welfare facilities for the elderly. After visiting each foodservice three times, results obtained during 2nd and 3rd visits (the 1st and 2nd support visits) were compared with the results of initial visits, to determine the effects of nutritional education and foodservice management support. To understand the status of nutrition management, we focused on 15 items in the foodservice nutrition management checklist detailed in the CSWFM guidelines [14] and provided by the Ministry of Food and Drug Safety. Soup salinities were measured using CAS Digital Salinometers (SALT-FREE 1000; CAS Co. Ltd., Yangju, Korea).
The 15 items in the nutrition management checklist were classified as ‘menu’, ‘foodservice provision’, ‘cooking’, and ‘distribution’ management items. ‘Menu’ management included six items, namely, ‘Is the registered dietitian’s menu used?’, ‘Is the registered dietitian’s menu used as it is?’, ‘Are surveys performed on underlying diseases and chewing/swallowing abilities?’, ‘Is the menu (general diet, soft diet, liquid diet, special diet, etc.) chosen according to the health statuses of the elderly?’, ‘Are food allergy surveys conducted?’, and ‘Is the menu posted in places like bulletin boards?’. ‘Foodservice provision’ included five items, viz. ‘Is the foodservice according with the menu provided?’, ‘Is the general diet provided minced or ground in accord with the chewing/swallowing abilities of the elderly?’, ‘Are soft and liquid diets provided for the elderly that cannot eat a general diet?’, ‘Are special diets properly provided based on considerations of major diseases?’, and ‘Is alternative food provided to the elderly with food allergies?’. ‘Cooking’ included three items, viz. ‘Is food cooked according to standard recipes?’, ‘Is the soup provided of the recommended salinity?’, and ‘Is the oil used for deep frying reused?’. The last area of ‘distribution’ included one item, namely, ‘Is the proper amount of foodservice provided to the elderly?’ After inspecting these 15 items, education, materials and feedback were provided with focus on items that needed most improvement. Modifying menus and how to use menus mainly concerned how to change menus to provide alternatives, how to provide meals customized for the elderly like providing porridge, rice gruel, low salt diets, and ground or minced food. In addition, education about optimum salinity and meal distribution, and allergy-causing foods was provided.
Data analysis
SPSS ver. 20.0 for Windows (Statistical Package for Social Science; SPSS Inc., Chicago, IL, USA) was used for the statistical analysis. Frequency analysis was performed to understand general matters regarding social welfare facilities and compliance rates at initial inspections. To understand the effects of nutrition management inspection and its feedback, the paired t-test was applied to nutrition management mean scores at initial visits (before support), and after the 1st and 2nd support visits. One-way analysis of variance (α = 0.05) and the Scheffé post hoc test were used to compare differences between mean salinity scores.
RESULTS
General matters regarding facilities
General matters of the 40 subject welfare facilities for the elderly are shown in Table 1. Regarding ages of the elderly at these facilities, 60.5% were in their 80s (515 of 851). Mean number of the elderly in the facilities was 21.28 and the mean number of employees was 12.63. The facilities included 10 common life families (25.0%) with a fixed number of the elderly (≤ 9), 13 nursing homes (32.5%), and 17 daycare centers (42.5%). Regarding numbers of foodservice employees, 21 facilities (52.5%) had one foodservice employee. In 11 facilities (27.3%), the director or caregivers did the cooking. Regarding career experience of foodservice working, the range was 1–3 yrs (15 facilities, 37.5%), and for drinking water, most facilities used a water purifier (28 facilities, 70%). Meals were mostly served in a dining room (15 facilities, 37.5%).
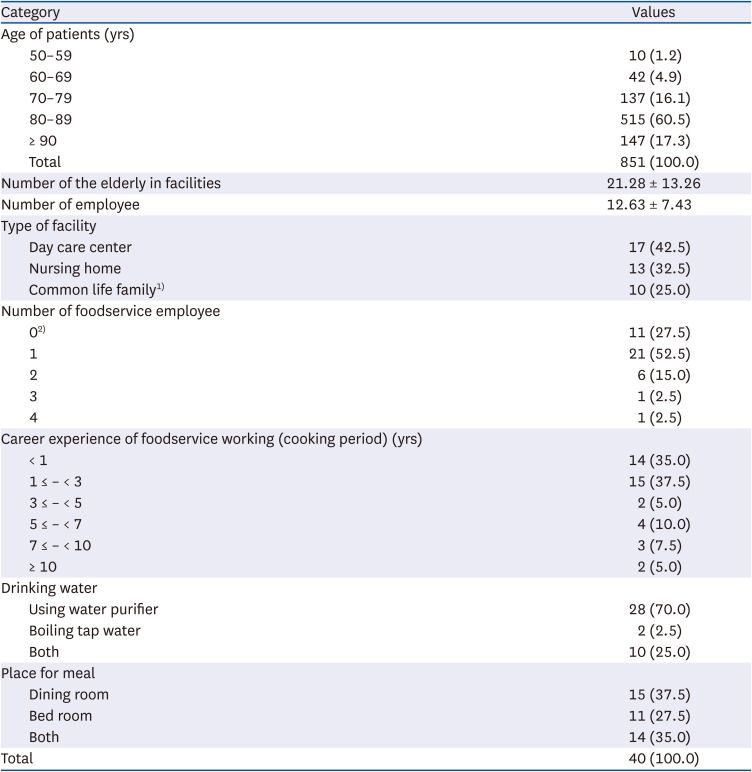
Table 1
General characteristics of facilities
Values are presented as frequency (%) or mean ± SD.
1)Nursing home with no more than nine people.
2)Director or nursing caregivers cook rather a cook.
![]()
Status of nutrition management at welfare facilities before foodservice management support
The status of nutrition management before the CSWFM in Cheongju City supported foodservice management to welfare facilities for the elderly is shown in Table 2. The mean compliance rate for the 15 items was 70.8%, and the area with the lowest compliance rate was ‘cooking (58.3%)’. Eight items had a compliance rate lower than the mean, e.g., ‘Is the soup provided by the foodservice cooked at the recommended salinity? (37.5%)’, ‘Is foodservice cooking performed according to recipes? (42.5%)’, ‘Is the registered dietitian’s menu used as is? (55.0%)’, ‘Is the menu posted on places like bulletin boards? (62.5%)’, and ‘Is the foodservice according to the menu provided? (65.0%)’.
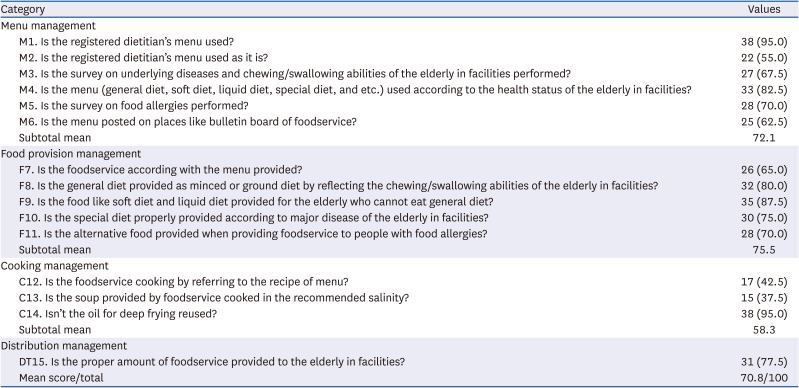
Table 2
The nutrition management status of the welfare facilities before Center for Social Welfare Foodservice Management support (n = 40)
![]()
Comparison of nutrition management scores before and after foodservice management support
To understand differences in nutrition management before and after providing foodservice management support to welfare facilities, nutrition management checklist scores after 1st and 2nd supports visits were compared with those after initial visits (Table 3). After 1st support visits, five of the 15 items showed a significant increase in scores (P < 0.05, P < 0.01, P < 0.001). Of the four areas, mean scores of three areas were significantly increased (P < 0.01, P < 0.001), and total mean score was also significantly increased from 71.80 to 82.18 (P < 0.001).
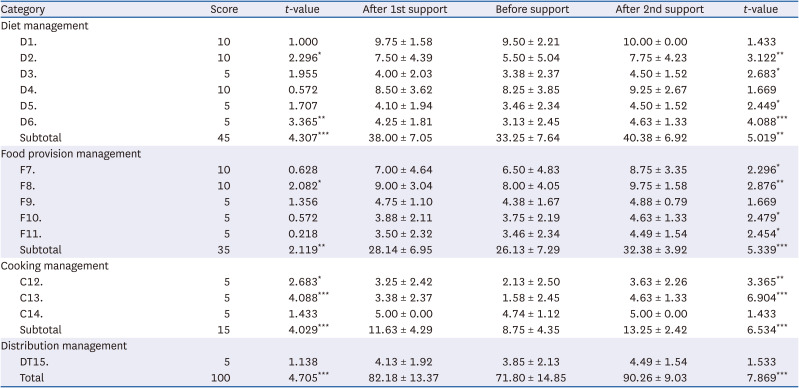
Table 3
Comparison of nutrition managements before and after the 1st and 2nd support visits (n = 40)
![]()
After 2nd support visits, 10 items showed a significant increase in score as compared with initial visits (P < 0.05, P < 0.01, P < 0.001), and five items that were not improved after the 1st support visit were improved after the 2nd support visit. Total mean score was also significantly increased from 71.80 to 90.26 (P < 0.001).
Comparison of salinity results before and after foodservice management support
After measuring the salinity of soup served for lunch during each visit, nutrition education about the need for low-salt foodservice was performed. Soup salinity results are provided in Table 4. Salinity measurements obtained before education was provided regarding the need for a low-salt diet showed at 25 facilities (62.5%) that soup salt content was higher than 0.8%. After 1st support visits, 24 facilities (60.0%) had a soup salinity of ‘0.5–0.8%’, and after 2nd support visits, 33 facilities (82.5%) had the highest rate of salinity classification (0.5–0.8%). Salinities higher than 0.8% decreased from 25 facilities (62.5%) initially to 12 facilities (30.0%) after 1st support visits to 1 facility (2.5%) after 2nd support visits. The mean salinity of soup measured for all 40 welfare facilities was 0.82% at initial visits, 0.68% after 1st support visits, and 0.56% after 2nd support visits (P < 0.001).
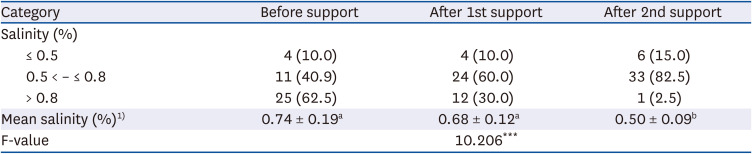
Table 4
Comparison of the salinities before and after support visits (n = 40)
Values are presented as number (%) or mean ± SD.
Different letters mean significant difference between groups by Scheffe's multiple range test.
1)One-way analysis of variance test was used.
***P < 0.001.
![]()
DISCUSSION
This study aimed to understand the effects of foodservice nutrition management support at 40 welfare facilities for the elderly, such as nursing homes and daycare centers, which were members of the CSWFM in Cheongju City, by comparing the statuses of nutrition management before and after support, and measuring the salinity of soup before and after nutrition education support about the importance of optimum salinity management.
Results for the four areas, that is, ‘menu’, ‘foodservice provision’, ‘cooking’, and ‘distribution’ management, showed that the average score of nutrition management in three areas, excluding distribution, improved significantly after two support visits, especially in the ‘cooking’ area. Initial results showed the item with lowest compliance rate was ‘Is the soup provided cooked to the recommended salinity (0.8% or lower)?’. Before support, salinities higher than 0.8% accounted for 62.5%, and this reduced to only 2.5% after 2 support visits. Mean soup salinity reduced significantly after first and second support visits. The Korean Ministry of Food and Drug Safety recommends sodium intake be ≤ 1,300 mg for a lunch as indicated by the term ‘SamSam (meaning ‘low salt’ in Korean) in the Foodservice Operation Management Guidelines’. In the case of soup, it is recommended that it be served in a 200 ml bowl [15]. However, according to the National Health Statistics Data of the Korea Disease Control and Prevention Agency, the national per capita daily sodium intake in 2019 was 3,286.7 mg [16], which is 1.6 times higher than the WHO’s recommended standard, which was determined to reduce the risks of high blood pressure and heart diseases (≤ 2,000 mg) [17]. In one report [18] the mean sodium intake per foodservice meal provided by a welfare center for the elderly in Korea was 2,270 mg. In the present study, the mean salinity of soup before support was higher than 0.8%, and thus, salt intake was higher than that recommended (≤ 0.8%) by the Ministry of Food and Drug Safety [19]. However, as was shown in a previous study [20] showing the significant decrease after the optimum salinity education by the CCFM, we also observed a substantial improvement in salinity management after foodservice management support.
In this study, nutrition management support was performed three times during visits, and the effects of support were observed after first and second support visits. Furthermore, the five items that did not improve after first support visits improved significantly after second visits. In particular, items regarding consideration of underlying diseases and chewing/swallowing abilities and the provision of diabetic diets, low-salt diets, soft diets, dysphagia diets, and dental soft diets resulted in increased intakes by patients with underlying diseases such as diabetes or high blood pressure. According to research targeting long-term care facilities for the elderly [9], mean daily energy intake was 1,538.9 kcal (men: 1,564.9 kcal, women: 1,535.5 kcal), and 85.3% of men and 47.7% of women were eating less than recommended energy requirements. In a similar study [8], mean energy intake was 1,375.5 kcal (men: 1,360.2 kcal, women: 1,378.0 kcal), which was much lower than Korean intake recommendations [21]. Many elderly people are frail and malnourished due to food intake disorders, reduced activity, and muscle loss. To prevent this, it is essential to maintain a normal body mass index by proper nutrition management [2223]. When an elderly person is ill and confined to bed, it is an easy matter to provide energy and protein enhanced snacks and meals [24]. Furthermore, by providing diets with various viscosities for the elderly with dysphagia, intake can be increased [25], and malnutrition in the elderly with various underlying diseases such as diabetes, high blood pressure, and dementia [89] that require individual management rather than providing standard meals, to increase dietary intake and maintain a satisfactory health status [2223].
In the present study, items that showed improvements after second support visits but not after first support visits included the provision of alternative foods to the elderly with food allergies. Over past decades, the number of elderly patients with allergic diseases has increased presumably due to interactions between immunologic, environmental causes, and lifestyle factors [2627]. In a study on food allergies that trigger atopic responses, 50.7% of 2,417 atopic patients of all ages and both genders exhibited food allergies, and among this cohort 44.4% of the elderly (≥ 65) had food allergies. Because of age-related functional declines of skin, heart, and lungs, the elderly are vulnerable to food allergies, and thus, proper management and research on food allergies targeting the elderly and the provision of alternative foods are required in institutions caring for the elderly [27].
Regarding the status of foodservice nutrition management facilities included in this study, items in the questionnaire with a low salinity compliance rate highlighted the importance of cooking according to standard recipes and adhering to menus devised by dietitians. The CSWFM provides menus and recipes monthly and details of cooking methods. However, according to Lee [28], compliance with standard recipes was poor even after support education by the CCFM because foodservice cooks did not understand the importance of complying with standard recipes. In another study [29], home daycare centers were found to be unaware of standard recipes, but subsequently provided details of ingredients in menus and checked recipes after receiving foodservice management support, which demonstrates if social welfare facilities receive adequate CSWFM support, standard recipes will be gradually adopted. Seo et al. [30] reported that many welfare facilities for the elderly arbitrarily change menus without referring to a dietitian and stressed that the use of menus written by non-specialists or unplanned changes in menus could cause nutritional imbalance. In reality, the elderly in welfare facilities with a dietitian have significantly higher intakes of major foods like meat, fish, and beans, and nutrients like calories, protein, calcium, iron, and vitamins C and B [31]. Thus, in order to provide suitable nutrition management to the elderly in facilities, more welfare facilities should be able to access professional dietitians of the CSWFM.
The present study is limited because it was based on support provided by the CSWFM in Cheongju City alone. Nonetheless, ten of 15 research items improved significantly after two support visits, and mean food salinity was significantly decreased. Therefore, the CSWFM should gradually expand its support, so that many more elderly people in welfare facilities can enjoy a healthy and happy life through proper dietary management based on the provision of nutritionally balanced meals, customized diets, and food allergy tailored diets under the guidance of registered dietitians.
 XML Download