

 PDF
PDF Citation
 Print
Print


INTRODUCTION
Recently, consumer interest in health and wellbeing has affected the choice and consumption of foods [12], leading to a decrease in the use of artificial additives and a preference for organic foods and eco-friendly foods [345]. Consumer behaviors, such as the preference and consumption for food, result from interactions with a wide variety of factors. Food-related lifestyle is one of the ways to identify such purchase intentions of consumers and segment the market based on the food choice motives [678]. Previous studies of food-related lifestyle analysis have shown health, price, convenience, taste, and safety to be the consumers’ purchase motives [2910]. Moreover, these consumers’ purchase motives and demands vary according to the cultural, environmental, and periodic differences [1112].
Food literacy means the ability to make decisions for purchase using the food information consumers need [13]. The Korea Rural Economic Research Institute developed the agrifood consumer competency index to evaluate the food literacy of consumers comprehensively [14]. This agrifood consumer competency index has been used to evaluate the competency of a series of consumption stages for agrifoods (choice, consumption, intake, nutrition, and health), which consists of agrifood purchase competency, dietary life competency, and consumer citizen competency. Regarding food literacy, relationships between the dietary intake [15] and wellbeing [16] have been studied.
Several studies have examined the factors affecting the consumers’ perceptions and demands for organic foods, which include education and knowledge, health interest, price [17], safety [1819], government’s certification [20], environmental friendliness [21], and social consciousness [22]. Recently, the consumers’ interests in health and high interest in food safety have increased the demand for organic foods [23]. On the other hand, consumers recognize that organic foods are expensive, and high prices may be a critical barrier to expanding the organic food market [24].
In addition, the purchasing power of consumers acts as the most strongly influential factor in purchasing organic foods [25]. Therefore, it is essential to examine how much a given consumer would be willing to pay for organic foods compared to non-organic foods. On the other hand, there have been few studies on the purchase intentions, such as payment value for organic foods of South Korean, and no studies on agrifood consumer competency index based on lifestyles.
Therefore, this study aims to provide basic data on the consumption tendency for organic foods and agrifoods based on food-related lifestyles by categorizing the consumer clusters of South Korean consumers. This study evaluated the payment value of organic foods and the agrifood consumer competency index according to the food-related lifestyles.
SUBJECTS AND METHODS
Data source and study population
The raw data from the Consumer Behavior Survey for Food (CBSF) performed by the Korea Rural Economic Institute (KREI) [26] were used for the analysis. The CBSF used a characteristic sample representing all South Korean consumers because it selected survey targets with a complex sampling design using the census output areas of Statistics Korea as a frame for sampling. This study enrolled 6,176 participants aged 19 to 74 years old (male: 2,783, female: 3,393), who were adult household survey respondents in the 2019 CBSF. The survey targets were classified based on their food-related lifestyles and were compared based on the demographic characteristics, payment value of organic foods, and agrifood consumer competency index.
Measurements
General characteristics
The general characteristics of the survey subjects were evaluated based on gender, age, marital status, the number of household members, education levels, occupation, average monthly income, interest in health, exercise, and alcohol intake state. Gender was classified into ‘male’ and ‘female.’ The education levels were classified into ‘non-school,’ ‘middle school graduation or less,’ ‘high school graduation,’ ‘college graduation,’ and ‘graduate school graduation.’ The occupation was classified into ‘manager and profession,’ ‘sales and service,’ ‘technical position,’ ‘housewife,’ and ‘others.’ The average monthly income was classified into ‘less than 1 million won,’ ‘1 million–2 million won,’ ‘2 million–3 million won,’ and ‘more than 3 million won.’ The interest in health was classified into ‘very much interested,’ ‘interested,’ ‘normal,’ and ‘little or no interest at all.’
Food-related lifestyle analysis
Fifteen lifestyle-related questions in the CBSF were used to analyze the food-related lifestyles [27]. The questionnaire on food-related lifestyles contained questions related to eating regular meals, eating out and use of delivery foods, choice of healthy and safe foods, and purchase of foods. The food-related lifestyles of subjects were classified using these question categories.
Payment value for organic foods
The payment value for organic foods was examined by comparing the willingness to pay of subjects for organic foods with non-organic foods. The willingness to pay for imported organic food was calculated when the price of imported non-organic food was 100, and the willingness to pay for domestic organic food was calculated when the price of domestic non-organic food was 100. The values of the willingness to pay for organic foods were compared according to the food-related lifestyle clusters.
Agrifood consumer competency index
The agrifood consumer competency index was developed to evaluate consumer competency in the agrifood market and the performance of agrifood-related consumer policies. The questionnaire consisted of 58 questions with the following 3 categories: food choice stage (agrifoods purchase competency), cooking and intake stage (dietary life competency), and rights and responsibilities as a citizen (consumer citizenship competency) [14]. An agrifoods purchase competency consists of 18 questions and 3 subcategories (8 questions for usage and understanding of food and nutrition labels, 6 questions for agrifood information literacy, and four questions for agrifood store environment). A dietary life competency consists of 18 questions and 3 subcategories (10 questions for healthy dietary life, four questions for safe dietary life, and four questions for traditional dietary life). A consumer citizenship competency consists of 20 questions and 3 subcategories (8 questions for consumer right, 8 questions for consumer responsibility, and four questions for consumer problem solving).
The participants rated the 58 questions on a 5-point scale (1=never to 5=definitely). The weighted scores were calculated according to the weight of each item. A 5-point scale was converted to 100 points. The total score and subcategory scores of the agrifood consumer competency index were calculated.
Statistical analysis
SAS 9.4 software was used for statistical analysis (SAS Institute, Cary, NC, USA). The statistical analysis of the CBSF was performed by applying the weights, clusters, and strata variables using the survey data obtained by the complex sampling design. Factor analysis and cluster analysis were performed to analyze the food-related lifestyles. Data were classified into 3 clusters according to the lifestyles, and the differences among clusters were analyzed. As for the categorical variables, a chi-square test through the SURVEYFREQ procedure was performed to calculate frequency and ratio (weighted %) by considering the weights. For the continuous variables, the means and standard errors were calculated using the SURVEYMEANS procedure, and an analysis of the variance using the SURVEYREG procedure was performed to test the significance among the clusters. A post hoc test was then performed using a Tukey’s test. P-values < 0.05 were considered significant.
RESULTS
Reliability and factor analysis
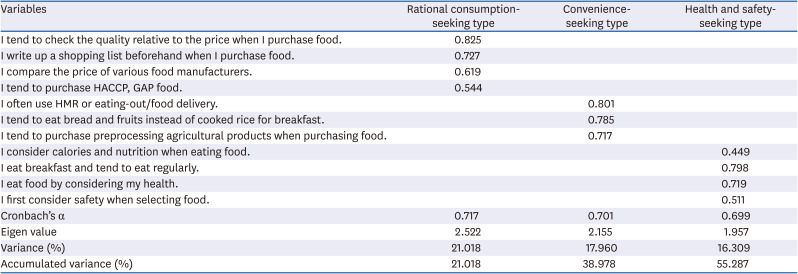
Prior to lifestyle analysis, the internal consistency was first evaluated using Cronbach’s alpha (α). Many studies reported that Cronbach’s alpha was appropriate at the range of 0.65–0.8 (or higher); 0.65 or higher was the acceptance criterion. Among the 15 questions on lifestyles, four questions with low consistency were excluded from the analysis to increase reliability. Factor analysis was performed using 11 questions, and the following 3 factors were extracted: 1) rational consumption-seeking type, 2) convenience-seeking type, and 3) health and safety-seeking type (Table 1). These 3 factors showed an explanatory power of 55.3%. The rational consumption-seeking type showed the characteristics of comparing food prices or evaluating the quality for the price. The convenience-seeking type indicated the characteristics of pursuing convenience, such as using home meal replacements and pretreated foods. The convenience-seeking type had characteristics of eating regular and safe meals for health.
Table 1
Results of factor analysis
Cluster analysis
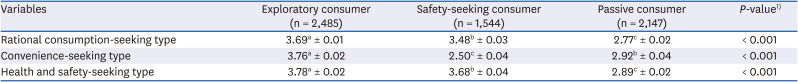
The subjects were segmented using cluster analysis based on the mean scores of the 3 factors (Table 2). The subjects were classified into 3 food-related lifestyles as the ‘exploratory consumers’ (n = 2,485), ‘safety-seeking consumers’ (n = 1,544), and ‘passive consumers’ (n = 2,147). The factor scores were significantly different among the 3 food-related lifestyle groups.
Table 2
Results of cluster analysis for food-related lifestyles
General characteristics according to food-related lifestyles
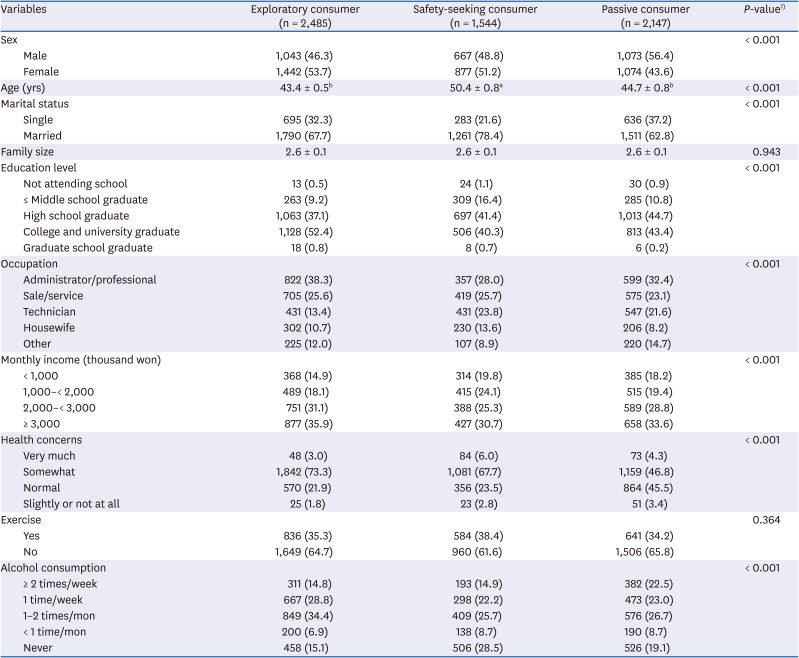
A comparison of the demographic characteristics of each cluster based on the food-related lifestyles showed significant differences in terms of gender, age, marital status, education levels, occupation, monthly income, health interest, and alcohol consumption (P < 0.001) (Table 3). Exploratory consumers had a higher education level than other clusters, a higher proportion of managers and professions, and high-income levels and health concerns (P < 0.001). The safety-seeking consumers were older than other clusters, had a high proportion of married people, and a high proportion of subjects who did not consume alcohol (P < 0.001). Passive consumers showed a high proportion of male subjects (P < 0.001).
Table 3
Socio-demographic characteristics of subjects according to food-related lifestyle
Payment value for organic foods compared to non-organic foods according to the food-related lifestyle
Table 4 lists the results of analyzing the willingness to pay for organic foods when the price for non-organic foods is 100. As for imported organic foods, exploratory consumers showed a significantly higher willingness to pay for organic agricultural products, aquatic products, livestock products, processed foods, eating out, and school meals than passive consumers (P < 0.05). The exploratory consumers indicated a willingness to pay from 112.2 to 113.4 to purchase imported organic foods compared to imported non-organic foods, and expressed the highest willingness to pay for livestock products and school meals. For domestic organic foods, exploratory consumers had significantly higher willingness to pay for eating out than passive consumers, and safety-seeking consumers indicated significantly higher willingness to pay for organic agricultural products, aquatic products, and livestock products than passive consumers (P < 0.05).
Table 4
Payment value for organic food compared to non-organic foods according to food-related lifestyle
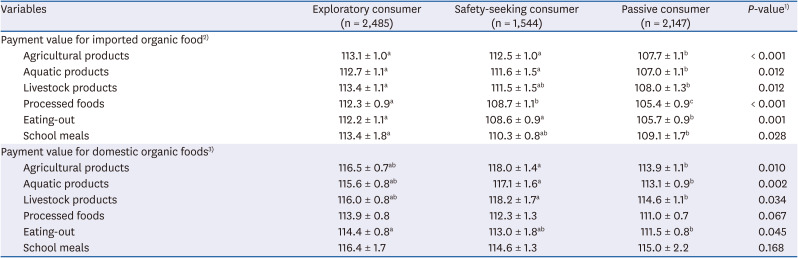
Values are presented as mean ± SE.
abcDifferent superscript letters mean significantly different among groups at the α = 0.05 by Tukey’s test.
1)P-values are calculated by SURVEYREG procedure and adjusted for age, sex, marital status, education, occupation, income, health concern, and alcohol consumption.
2)The willingness to pay for imported organic food was calculated when the price of imported non-organic food was 100.
3)The willingness to pay for domestic organic food was calculated when the price of domestic non-organic food was 100.
Agrifood consumer competency index according to food-related lifestyles
Table 5 lists the agrifood consumer competency index by consumer clusters according to the food-related lifestyles. The agrifood consumer competency index based on the food-related lifestyles was the highest with 69.4 for exploratory consumers, followed by 65.5 for safety-seeking consumers and 57.7 for passive consumers (P < 0.001). For scores of each area in the agrifood consumer competency index, the exploratory consumer cluster had the highest score, followed in order by the safety-seeking consumer cluster and passive consumer cluster in all areas (P < 0.001). In the healthy dietary, however, the passive consumer cluster scored 57.7, which was significantly lower than other lifestyle clusters (P < 0.001).
Table 5
ACCI according to food-related lifestyle1)
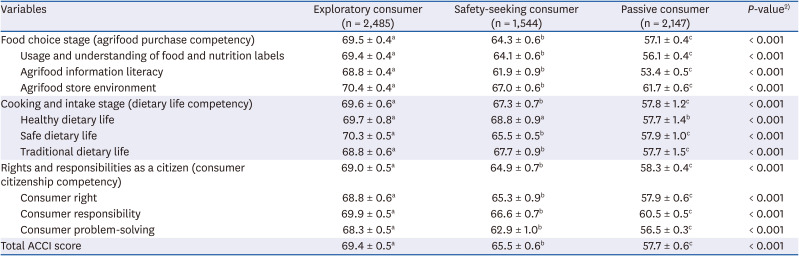
Values are presented as mean ± SE.
abcDifferent superscripts indicate significantly different means by Tukey’s test (P < 0.05).
ACCI, agrifood consumer competency index.
1)A 5-point scale was converted to 100 points. Weighted scores were calculated according to the weight of each item.
2)P-values are calculated using the SURVEYREG procedure.
DISCUSSION
This study analyzed the payment value for organic foods and the agrifood consumer competency index according to the food-related lifestyles of South Korean consumers. The aim was to provide basic data on consumers’ healthy and proper food consumption by identifying their purchase intentions of agrifoods according to the lifestyles based on the analysis results. The results revealed 3 choice motives of foods: the pursuit of rational consumption, the pursuit of convenience, and the pursuit of health and safety. The consumers could be classified into 3 types based on an analysis of the food-related lifestyle clusters using these 3 factors: exploratory consumers, safety-seeking consumers, and passive consumers.
A comparison of the demographic characteristics of the food-related lifestyle clusters showed that exploratory consumers and safety-seeking consumers indicated a higher female percentage and higher interest in health than passive consumers. Health is an important motive of consumers to choose foods [28], and the interest in health is strongly related to food-related behavioral motives [2]. Lee et al. [2] classified consumer clusters based on their health interest, and each cluster showed significant differences in demographic characteristics, such as country, gender, age, and education levels. Consumers with high health interests have high motivation for health and quality of life, and are more likely to choose healthy and natural foods [29]. In this study, exploratory consumers and safety-seeking consumers, which have high health interests, indicated significantly high scores in the healthy dietary-life area of the agrifood consumer competency index than passive consumers and placed a higher score on payment value of organic food purchases.
This study analyzed the willingness to pay to purchase organic foods compared to non-organic foods. In addition, the payment value for organic foods according to the food-related lifestyles was identified. Exploratory consumers placed the highest score for the payment value of imported organic foods, and safety-seeking consumers set the highest score for the payment value of domestic organic foods. The high prices of organic foods may be a critical barrier to developing the organic food market [24]. Therefore, it is very important to examine the prices that consumers would be willing to pay and the motives to purchase. Previous studies reported the following motives that made consumers more willing to pay high prices: positive perception of organic foods [24] and social responsibility [223031].
Smith and Paladino [32] reported that knowledge of organic farming, subjective norms, and interests in environmental protection were closely related to the intentions to purchase organic foods. They stated that the factors influencing the purchase intentions were health interest, quality, subjective norms, and familiarity, but the factor that showed a significant relationship with the purchasing behaviors of organic foods was familiarity. Soroka and Wojciechowska-Solis [33] investigated the purchase motives of organic foods according to the consumer’s lifestyles and reported that the purchase motives varied depending on the physical activities. The purchase motives of physically active respondents were that organic foods were nature-friendly, and less processed foods, whereas the purchase motive of physically inactive respondents was taste.
In this study, the agrifood consumer competency index comprehensively evaluated food literacy and nutrition literacy [14]. A comparison of the agrifood consumer competency index according to lifestyles showed that exploratory consumers had significantly higher scores in all areas. Food literacy means the knowledge and skills consumers need to perform a series of processes of food planning, management, selection, preparation, and cooking and eating [13]. Nutrition literacy, used with this food literacy, expresses the ability to obtain and understand nutritional information [34]. This food and nutrition literacy has been associated with dietary intake and health [3536], and studies have been conducted on educational programs to improve it [37].
These findings show that the willingness to pay to purchase organic foods and agrifood consumer competency index showed significant differences according to the food-related lifestyle groups in Korean consumers. To promote the consumption of organic food and domestic agricultural products, efforts should be made to develop products and services that consider food-related lifestyle characteristics. In addition, food-related lifestyle characteristics need to be considered when developing dietary education programs to improve food and nutrition literacy.
This study had some limitations. Because the CBSF used in this study was a cross-sectional study, there were limitations in deriving a cause and effect relationship. Therefore, this study could not explain the causal relationship among food-related lifestyles, payment value for organic foods, and agrifood consumer competency index. In addition, it is also impossible to identify information on the food environments related to purchasing organic foods, as food environments affecting the food purchase of the survey subjects were not investigated. Nevertheless, this study is meaningful because it is the first study to analyze the payment value for organic foods and the agrifood consumer competency index according to the food-related lifestyles of South Korean consumers. In addition, this study secured representativeness for South Koreans because it selected survey subjects by sampling South Koreans and analyzed the obtained data by applying weights.
In conclusions, this study categorized consumer clusters based on the food-related lifestyles of South Korean consumers and analyzed the payment value of organic foods and the agrifood consumer competency index. Exploratory consumers showed a significantly higher willingness to pay for imported organic foods. Safety-seeking consumers had a significantly higher willingness to pay for domestic organic foods. For the agrifood consumer competency index, exploratory consumers had the highest score, followed in order by safety-seeking consumers and passive consumers. These results can establish marketing strategies and policy development for activating the organic food industry and agrifood consumption.
 XML Download