

 PDF
PDF Citation
 Print
Print


INTRODUCTION
Life expectancy has been increasing in most of the countries and healthy aging is one of the key public health agendas [12]. Healthy aging, defined as “the process of developing and maintaining the functional ability that enables well-being in older age” [2], can be challenging when people have to deal with chronic diseases such as type 2 diabetes mellitus (T2DM). The prevalence of T2DM has been increasing globally (463 million in 2019 to 700 million by 2045 in aged 20–79 yrs) and also in Korea (10.1% in 2008 to 12.4% in 2018 in aged 30 yrs and over) [34]. In Korea, although new T2DM cases have been increased among aged under 60 yrs between 2004 and 2012, the highest new T2DM cases in 2012 were reported among aged 40 yrs and over (aged 40–49, 15.0%; aged 50–59, 28.0%; aged 60–69, 23.0%, aged 70–79, 18.0%) [5]. Considering the given status, it is crucial to understand the relationship between well-being and the management of T2DM among mid-aged and old populations.
Measuring well-being or health-related quality of life (HRQoL) has been an important issue in disease management and patient care [6]. This area of research is still evolving and many researchers use these terms interchangeably [78]. The concept of well-being covers physical and mental well-being that is affected by many key factors such as health, housing, relationships and employment. For public health purposes, HRQoL can be seen as critical to individuals’ overall well-being and has been linked to patient outcomes [9]. HRQoL stresses the changes in physical and mental health dimensions that are associated with disease, aging, or alterations in functional status [10].
Understanding HRQoL among T2DM patients is crucial because it has been known that the illness may affect patients’ quality of life (QoL) substantially through its complications and treatments [1112]. Previous studies showed that lower HRQoL is associated with higher comorbidity among patients with T2DM [13] and overall higher mortality among aging population [14]. Key dimensions of HRQoL, affected by the illness, include physical, role, social, cognitive, and sexual functioning, emotional well-being, pain, and health perceptions or distress [15]. Previous studies also showed that HRQoL among respondents with diabetes was significantly lower than respondents without the illness [13]. Researchers suggested that preventing complications and decreasing onsets of other metabolic diseases have the greatest potential to improve HRQoL in people with T2DM [1113].
Nutritional status can be one of key factors in improving overall HRQoL due to its impact on the development of complications and other possible disease onset. Malnutrition may be common among people with T2DM and negatively affects to diabetes prognosis and eventually to HRQoL [16]. This is because long term diet management is one of the key aspects of diabetes management and this may be one obstacle to increase QoL due to dietary restriction [17]. In spite of the interrelatedness of these factors, nutritional status and QoL among patients with T2DM has not been extensively researched. Studies have shown the relationship between T2DM and impaired HRQoL [111218] and the relationship between malnutrition and HRQoL [141920]. However, only small number of studies explored the association between nutritional status and HRQoL among patients with T2DM [16]. One study used relatively small number of participants, as the authors stated that it was a pilot explanatory study [21]. Therefore, the aim of this study is to examine the potential modifying role of nutritional status on the relationship between diabetes and HRQoL.
SUBJECTS AND METHODS
Study population
A cross-sectional study was established to identify the predictors of QoL and its association between adults with and without T2DM from 2015 to 2017. For this purpose, individuals with T2DM aged 40 yrs and older were recruited from a university hospital and individuals without T2DM aged 40 yrs and older were recruited from welfare centers in Chuncheon. Diabetic status was defined as having serum hemoglobin A1C level higher than 6.5%. A total of 411 people with T2DM and 345 people without T2DM participated in the data collection procedure.
Of 756 potential participants, we excluded participants having missing data on Mini Nutritional Assessment (MNA) (n = 44), HRQoL (n = 26), and key covariates (n = 40) including age, education level, monthly income level, marital status, smoking, drinking, anthropometric measurements, and/or comorbidity. The final analysis included a total of 646 participants (278 without and 368 with T2DM). The study was conducted in accordance with the Declaration of Helsinki and the study protocol was reviewed and approved by the Institutional Review Boards (IRB) of Hallym University (IRB No. 2017-10-102). All participants provided written informed consent and they received compensation as a form of certificates for local stores.
Assessment of nutritional status
We used the MNA tool to assess the nutritional status of participants [2223]. The MNA tool is composed of 18 items including 4 anthropometric measurements and 12 questions of nutrition and health [22]. In specific, study participants were measured on weight, height, mid-arm circumference (MAC), calf circumference (CC) and asked their weight loss during last 3 months, lifestyle, medications, mobility, number of meals eaten, food intake, autonomy of feeding, and self-perceived health and nutrition [22]. For each item, the lower value represents a worse condition and the theoretical maximum score of the MNA is 30 points. Higher scores indicate better nutritional status. Study participants were categorized into 2 groups using 24 points as a cutoff (< 24 for malnourished and at risk of malnutrition, ≥ 24 for well-nourished). When divided into 3 groups, participants with less than 17 points were classified as malnourished and participants with scores between 17 and 23 were classified as at risk of malnutrition [22].
Assessment of covariates
We collected data using standardized protocols for a questionnaire survey and examinations. Interviewers were recruited among graduate and undergraduate students majoring in social welfare and nutrition science and were trained in advance by research coordinator. They were informed of study objectives and research protocol including administration of survey questionnaires and physical measurements. Interviewers administered the questionnaire (but if the participants preferred to fill out the forms by themselves, they were encouraged to do so) and performed their physical examination. Structured questionnaires collected information on demographic (age, gender, education, monthly income, marital status), lifestyle (smoking status and drinking status), medical history (diabetic status, multimorbidity, obesity status), and depressive symptoms. We defined a higher education as ≥ 12 yrs of schooling. Smoking status was classified into current smoking (defined as either smoking every day or occasionally) and non-smoking (defined as either never smoking or past smoking). Drinking status was categorized into current drinking and non-drinking. Multimorbidity was defined as the presence of at least 3 chronic diseases.
Anthropometric measurements
Height was measured with a standard height scale to the nearest 0.1 cm and weight was measured with a metric weight scale to the nearest 0.01 kg with participants in light clothing without shoes. Height and weight were measured with an automatic stadiometer with a scale (DS-103M; Jenix, Seoul, Korea). Body mass index (BMI) was calculated as the ratio of weight (kg) to height squared (m2) and we defined obesity as ≥ 25 of BMI [24]. MAC was measured halfway between the lowest rib margin and the iliac crest. CC was measured at the widest part around the calf and repeated 2 more times to make sure the first measurement was the largest [22].
Center for Epidemiological Studies Depression Scale (CES-D) measurements
To assess the presence of depressive symptoms, we used the Korean-translated version of the CES-D [2526], which has been validated among Koreans [26]. The CES-D has a total of 20 items with 4 Likert scale response options (0, rarely or none of the time; 1, some or a little of the time; 2, occasionally or a moderate amount of time; 3, most or all of the time) [2526]. Total score is calculated by summing responses in each item and theoretically score ranged from 0 to 60 and a higher score indicates the experience of severe degree of depressive symptoms [2526]. Definite depression was defined as ≥ 25 of CES-D [27].
Assessment of HRQoL
The HRQoL was measured using the 36-item Short Form Healthy Survey (SF-36) for use in the Medical Outcome Study [28]. The SF-36 is composed of 8 dimensions of HRQoL scales with totally 36 single items including physical functioning, role limitations due to physical problems, bodily pain, general health, vitality, social functioning, role limitations due to emotional problems, and general mental health [29]. Two summary measures including overall physical HRQoL and overall psychological HRQoL were also calculated by averaging of all 4 items in each dimension. All HRQoL scores ranged from 0 to 100.
Statistical analysis
For categorical analysis, study participants were divided into 2 groups based on diabetic status (participants with and without T2DM). To introduce original characteristics of our study participants, we presented means and standard deviations for continuous variables and frequencies and proportions for categorical variables. Age and gender-adjusted covariates were presented according to diabetic status groups using a general linear model (GLM) for both continuous and categorical variables (yes = 1, no = 0). Variables showing significant differences across diabetic status groups were included in the multivariable model as potential confounders: it included age (yrs), men (yes, no), monthly income with 2 million Korean won (KRW) and more (yes, no), multimorbidity (yes, no), BMI (kg/m2), and CES-D score (points). The multivariable-adjusted HRQoL scores according to diabetic status were assessed using the GLM. A stratification analysis was performed according to nutritional status when examining the effect of nutritional status on the association between diabetic status and HRQoL. Potential interaction in the association by nutritional status was checked by adding the cross-product term of diabetic status and nutritional status to the final model. Multiple linear regression model was used to predict the linear relationship of several predictors including diabetic status, nutritional status, age, gender, monthly income, multimorbidity, BMI, and CES-D score to HRQoL. All statistical tests were 2-sided with statistical significance using an α level of 0.05. We performed all statistical analyses with SAS software version 9.4 (SAS Institute, Cary, NC, USA).
RESULTS
General characteristics of study participants
Table 1 summarizes the general characteristics of the participants at baseline. The mean age was 69.9 yrs, and 50.2% of the study participants were men. Of 646 participants, 19.8% had more than 13 yrs of education, 41.7% earned KRW 2 million and more per month, 68.9% were married or cohabiting with partners, 57.0% had T2DM, 58.1% had at least 3 chronic diseases, and 50.5% had obesity. Mean CES-D score was 13.5 points out of 60 points and 12.3% were classified as having definite depression [27]. For nutritional status, following the MNA criteria suggested by Guigoz and colleagues [22], 5.1% were classified as malnourished, and 71.1% were classified as being at risk of malnutrition according to their MNA scores.

Table 1
General characteristics of the study population (n = 646)
Values are expressed as the mean ± SD for continuous variables or as a number (%) for categorical variables.
KRW, Korean won; BMI, body mass index; CES-D, Center for Epidemiologic Studies Depression Scale; MNA, Mini Nutrition Assessment.
1)Multimorbidity was defined as the presence of at least 3 chronic diseases.
2)The estimate was calculated among only those with complete information on CES-D (n = 617).
![]()
Key characteristics according to diabetic status (age and gender-adjusted)
Table 2 shows the age- and gender-adjusted distributions of key characteristics according to diabetic status groups. Compared to participants without T2DM, participants with T2DM tended to be younger, have higher monthly income, have more diseases, have higher BMI and obesity prevalence, and higher CES-D score and definite depression prevalence. These variables were adjusted in the following multivariable models. Last, MNA scores were higher among participants without T2DM after accounting for age and gender (22.2 points for participants without vs. 21.3 points for participants with T2DM, P = 0.001).

Table 2
Key characteristics of the study population according to diabetic status after adjusting for age and gender
Values were adjusted for age (yrs) and gender (men: yes, no) except for age and gender itself. Values are expressed as the mean ± SE or percentage (%).
T2DM, type 2 diabetes mellitus; KRW, Korean won; BMI, body mass index; CES-D, Center for Epidemiologic Studies Depression Scale; MNA, Mini Nutrition Assessment.
1)P-values for the difference between participants with and without T2DM were obtained using a general linear model.
2)Higher education was defined as completing more than high school (12 yrs of education).
3)Multimorbidity was defined as the presence of at least 3 chronic diseases.
4)Obesity was defined as BMI 25 or higher.
![]()
HRQoL according to diabetic status
Table 3 presents the multivariable-adjusted HRQoL according to diabetic status. Overall physical HRQoL scores were significantly lower in participants with T2DM than without (62.8 vs. 71.0, P < 0.0001); whereas, overall psychological HRQoL did not have any statistical difference between 2 groups (70.0 vs. 72.1, P = 0.185). When examining the individual component of HRQoL, the HRQoL scores of all physical dimensions were significantly lower among participants with T2DM than participants without (range: 58.8–77.3 for people without T2DM, 50.0–67.5 for people with T2DM, all P < 0.05). However, only vitality component in psychological dimensions showed a significant difference (53.8 in people with T2DM vs. 62.4 in people without T2DM, P < 0.0001).
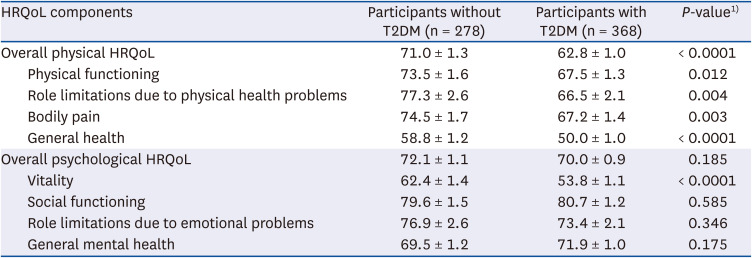
Table 3
HRQoL among participants with and without T2DM
Values are expressed as the mean ± SE.
T2DM, type 2 diabetes mellitus; HRQoL, health-related quality of life.
1)P-values for the difference between participants with and without T2DM were obtained using a general linear model. Multivariable model adjusted for age (yrs), men (yes, no), monthly income of 2 million Korean won and more (yes, no), multimorbidity (yes, no), body mass index (kg/m2), and Center for Epidemiological Studies Depression Scale score.
![]()
Multivariable-adjusted HRQoL scores in diabetic and nondiabetic groups stratified by nutritional status
Table 4 shows the multivariable-adjusted HRQoL scores in participants with and without T2DM stratified by nutritional status. For overall physical HRQoL scores, we observed lower scores in participants with T2DM than without across all nutritional status group. Although there was no significance in interaction in both overall physical and psychological HRQoL scores (all P for interaction > 0.05), relatively larger differences were observed in the well-nourished group than in the at risk and malnourished groups, as depicted by a sharper slope for the well-nourished group (−17.0%, P < 0.0001 in well-nourished; −9.3%, P = 0.004 in at risk of malnutrition; −10.7%, P = 0.689 in malnourished). For overall psychological HRQoL scores, a significant difference between participants with T2DM and without was observed only among malnourished (−1.3%, P = 0.733 in well-nourished; −2.0%, P = 0.474 in at risk of malnutrition; −33.0%, P = 0.040 in malnourished).
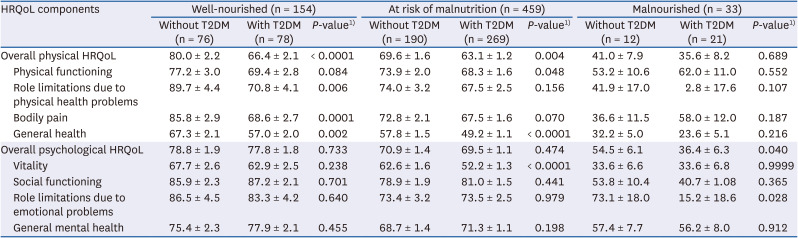
Table 4
HRQoL between participants with and without T2DM stratified by nutritional status
Values are expressed as the mean ± SE. Each nutritional status group was defined as follows: < 17 of MNA for malnourished; 17–23 of MNA for at risk of malnutrition; ≥ 24 of MNA for well-nourished.
T2DM, type 2 diabetes mellitus; HRQoL, health-related quality of life.
1)P-values for the difference between participants with and without T2DM were obtained using a general linear model after adjusting for age (yrs), men (yes, no), monthly income of 2 million Korean won and more (yes, no), multimorbidity (yes, no), body mass index (kg/m2), and Center for Epidemiological Studies Depression Scale score.
![]()
Multiple linear regression for predicting HRQoL
Finally, the results from multiple linear regression for predicting HRQoL are shown in Table 5. Having T2DM, being at risk of malnutrition or malnourished, being older (yrs), being a woman, having lower income, having more than 3 diseases, higher BMI (kg/m2), and higher CES-D score negatively predict lower overall physical and psychological HRQoL scores at the significance level of 0.05. When other predictors were controlled for, having T2DM led to decreases of 7.8 and 1.8 points in overall physical and psychological HRQoL scores, respectively, but the significance was only observed in overall physical HRQoL (physical P < 0.0001; psychological P = 0.250). In addition, a 5-point increase in MNA led to significant increases of 7.5 and 6.3 points in overall physical and psychological HRQoL scores, respectively (all P < 0.0001).
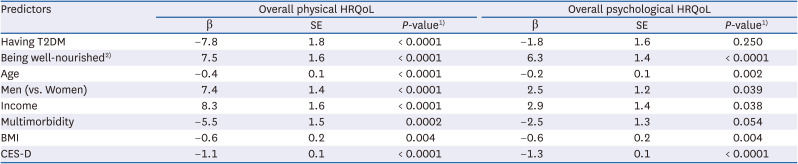
Table 5
Multiple linear regression analyses for variables predicting HRQoL
T2DM, type 2 diabetes mellitus; HRQoL, health-related quality of life; BMI, body mass index; CES-D, Center for Epidemiologic Studies Depression Scale; β, beta coefficient.
1)P-values, regression coefficients, and standard errors were obtained by multiple linear regression analysis.
2)Being well-nourished was defined 5-point increase in mini nutrition assessment score.
![]()
DISCUSSION
In this cross-sectional study of 646 participants, participants with T2DM had significantly lower HRQoL scores than participants without T2DM in all physical dimensions and vitality in psychosocial dimensions irrespective of potential confounders. Many previous studies have discussed the relationship between diabetes and QoL. The results from the current study are in line with previous studies that revealed the negative impact of diabetes on HRQoL [1112131828]. Previous studies argued that the burden of lifelong disease management and restricted diet therapy, sometimes the loss of “enjoyment of eating” along with various complications and comorbidities, impacts patients’ QoL [303132]. Specifically, in one meta-analysis, the presence of complications and hypertension, longer duration of diabetes, diets with more red meat and depression were associated with worse QoL among people with T2DM [32].
Consistent with prior knowledge, our data also showed that most of the DM effect on psychological dimensions of HRQoL was explained by depression, measured with CES-D scale (Supplementary Tables 1 and 2). Depression, HRQoL and diabetes are some of the most well-researched topics [30], and this may explain the link between diabetes and HRQoL. For example, a study with an Australian representative population sample suggested that a higher prevalence of depression among people with diabetes may explain the significantly lower HRQoL among that group. The prevalence of depression was higher among participants with T2DM (24% vs. 17%), and the impact of diabetes on HRQoL was greater for people with T2DM who had depression than for T2DM patients without depression [18]. In addition, another study illustrated that diabetes-related microvascular complications, heart failure and depression were most strongly related to decreased HRQoL among people with diabetes [11]. Since the disease requires lifelong management, various intervention strategies are necessary to improve patients’ QoL. Previous studies suggested that the treatment of depression and other comorbid medical conditions and the prevention of complications may play a role in improving HRQoL in people with T2DM [1113].
As opposed to depression and HRQoL among people with DM, the issue of nutritional status among people with DM and its impact on QoL has not been fully explored [20]. Many studies have examined the association between nutritional status and QoL among the adult population, especially the elderly population [1933] or elderly people with specific diseases [343536]. All these studies demonstrated a correlation between better nutritional status and better QoL. Only one small study in Spain has focused on T2DM patients and reported the moderate positive correlation between nutritional status and HRQoL among T2DM patients after controlling for comorbidity [21].
Notably, the current study shows that the relationship between diabetic status and HRQoL differs by nutritional status. Among well-nourished participants, diabetes only affects the physical dimensions of HRQoL. For people who are at risk of malnutrition, who are the majority group of the current study participants, having T2DM affect most of the physical HRQoL and only vitality components in psychological HRQoL. Lastly, malnourished group did not show any statistically significant differences in physical HRQoL, a significant lower overall psychological HRQoL was observed among participants with T2DM. Since nutritional status among patients is one modifiable factor that can be improved with proper intervention, nutrition components should be considered in caring for people with diabetes.
Along the same line, the current study also showed that even after controlling for strong predictors, such as depressive symptoms, income, age, and gender, well-nourishment has some potential in improving both the physical and psychological aspects of HRQoL. Given the small number of participants who are categorized into well-nourished group, it would be meaningful to target nutritional status among people with diabetes in an attempt to improve their HRQoL.
Although the results of this study provide new insight for nutrition management among people with T2DM, several limitations should be considered. First, we cannot determine a causal relationship between diabetic status and QoL due to the inherent shortcomings of a cross-sectional design. However, it could be hypothesized that well-nourished participants with T2DM might have some protective effect against decreased HRQoL due to this illness, especially regarding their psychological component of HRQoL. Second, our findings focus on relatively older populations; therefore, it may not be applicable to younger populations (aged under 40 yrs). Third, since the participants with T2DM were recruited from a hospital and the healthy counterparts were from local social welfare centers, the participants may not be compatible. In order to overcome this, we measured possible confounders and included them in the statistical analyses. However, we cannot rule out the possibility of residual confounding from unmeasured factors. Fourth, since diabetes is a chronic disease that requires lifelong lifestyle management, how long the diabetic participants had the disease and whether they were under dietary therapy for T2DM management are crucial factors in determining the relationship between QoL and nutritional status. However, the absence of such information hinders us from taking those factors into account. Fifth, our data may have inadequate power to detect an interaction effect of nutritional status on the association between diabetic status and HRQoL. Based on the statistical calculation, 4 times as many participants may be needed to detect an interaction effect as for a main effect [37]. Sixth, there are some limitations in measuring nutritional status using MNA [38]. However, since MNA scores are calculated based on various elements from dietary practice, dietary history and key anthropometric measurements, it would be a more relevant indicator to depict the nutritional status of individuals than measures that only capture one aspect of participants’ nutritional status [22]. Although validating the MNA measure was not within the scope of the current study, we could observe a strong correlation between participants’ MNA scores and serum iron levels (72.9 mcg/dL of serum iron among malnourished and 95.9 mcg/dL among well-nourished participants). Also, considering that the MNA has been used to screen undernourished elderly, the use of MNA in our study still may have a limitation because the majorities of our study participants were overweight or obese. Future studies with more comprehensive assessment tools for measuring nutritional status may provide better picture on nutritional status and its impact on HRQoL.
In conclusion, this study showed that nutritional status was negatively associated with some components of HRQoL among participants with T2DM. Considering its physical and psychological impact on people with the disease, seeking possible intervention strategies to help patients maintain their QoL during treatment is crucial. The present results suggest that nutrition intervention may alleviate the negative impact of T2DM on HRQoL. Future longitudinal or intervention studies are warranted to test the impact of nutritional status on HRQoL among people with T2DM.
 XML Download