

 PDF
PDF Citation
 Print
Print


INTRODUCTION
In patients diagnosed with chronic kidney disease (CKD), solutes are not excreted by the kidneys and therefore linger during circulation to cause negative biologic function, these solutes are called uremic toxins [1]. Uremic toxins are classified into smaller water-soluble molecules (< 500 Da) (i.e., urea, creatinine and phosphorous), middle molecules (≥ 500 Da) (i.e., advanced glycation end-products), and protein-bound molecules (i.e., homocysteine, indoxyl sulfate [IS] and p-cresol sulfate [PCS]) based upon their biochemical and physical properties [12]. Amongst the different types of uremic toxins, protein-bound uremic toxins have attracted much attention, as they have cytotoxic effects and are less efficiently removed during dialysis treatment [3].
One of the protein-bound uremic toxins, homocysteine, is a sulfur-containing amino acid biosynthesized from methionine, which can be metabolized through either remethylation or transsulfuration pathways. IS is another representative protein-bound uremic toxin which is produced from bacterial amino acids (i.e., tryptophan, tyrosine and phenylalanine) fermentation into indole in the large intestine mucosa, with the indole then circulated in the blood stream to the liver. Indole would then be hydroxylated and sulfated to IS in the liver and re-entered into the blood stream [4]. Plasma homocysteine and IS are removed during passage through the kidney, with their concentrations having been observed as gradually increasing during the progression of kidney dysfunction [25678]. Elevated levels of homocysteine [910] and IS [1112] have been shown to induce oxidative stress, which would accelerate the deterioration of kidney function, and therefore be associated with the risk of CKD [13141516]. Restoring the balance between oxidative stress and antioxidant defense capacity would aid in protecting the kidneys from further damage and potentially limit the progression of kidney dysfunction.
A glutathione (GSH)-dependent antioxidant system consisting of reduced GSH, oxidized glutathione (GSSG), and functionally dependent enzymes (i.e., GSH peroxidase [GSH-Px], GSH reductase and GSH S-transferase [GSH-St]), plays a fundamental role in the cellular defense against reactive free radicals and other oxidant species in the human body. Under normal conditions, GSH and GSH-Px are abundant in the kidney [1718]. GSH status and its dependent antioxidant enzyme activities may be depleted to help cope with increased oxidative stress via kidney damage, or their synthesis could be reduced in keeping with the loss of kidney function. Previous studies have indicated that plasma or erythrocyte GSH concentration, GSH-Px, and/or GSH reductase activities decreased with loss of kidney function [192021]. GSH and its dependent antioxidant enzyme activity, and the GSH/GSSG redox ratio have thus been considered as being more informative markers of oxidative stress and antioxidant capacity in CKD patients [222324].
Although increased levels of homocysteine and IS, and decreased GSH-dependent antioxidant capacity have been shown to be associated with kidney function loss, it remains unclear whether they interact with each other to mediate the damage to kidney function. Therefore, we aimed to investigate whether homocysteine, IS, GSH, and its dependent antioxidant enzyme activities are dependently or independently associated with kidney function at different stages of CKD patients.
SUBJECTS AND METHODS
Study design and sample size calculation
This was a cross-sectional study. A significant relationship between IS and estimated glomerular filtration rate (eGFR) levels (r = −0.7, P < 0.001) was observed in a previous study [6]. We then calculated the sample size based on the detection of a significant correlation coefficient of 0.35 between IS and eGFR levels with a power of 90%, and a 2-sided test with an α of 0.05. A total of 82 patients was required to match the calculation criteria. The final recruitment number reached a total of 132 CKD patients, which was greater than our original calculation.
Subjects
Patients were recruited from the outpatient clinic of the Division of Nephrology at Taichung Veterans General Hospital, Taiwan. Inclusion criteria required that the patients’ age be within the 20 to 80 year range, and the patients diagnosed with stage 1–5 CKD. Each patient’s CKD staging was confirmed by an experienced nephrologist. The 5 CKD stages were classified based upon the eGFR levels (stage 1: ≥ 90 mL/min/1.73 m2; stage 2: 60–89 mL/min/1.73 m2; stage 3a: 45–59 mL/min/1.73 m2; stage 3b: 30–44 mL/min/1.73 m2; stage 4: 15–29 mL/min/1.73 m2; stage 5: < 15 mL/min/1.73 m2) [25]. Patients were excluded if they were either pregnant or lactating, had received kidney transplantation, or had a history of liver disease, cancer, or alcoholism. This study was approved by the Institutional Review Board (IRB) of Taichung Veterans General Hospital (IRB TCVGH No. SF15019A and No. CF17272A). Each patient signed an informed consent from prior to taking part in the study.
Data collection and biochemical measurements
Data regarding each subject’s age, sex, smoking and drinking habits were recorded. Each subject’s height and weight were measured and their body mass index (BMI, kg/m2) calculated. Systolic and diastolic blood pressures were measured after a resting period of at least 5 min.
Fasting blood samples were drawn on an appointed day. Blood specimens were collected in vacutainer tubes (Becton Dickinson, Rutherford, NJ, USA) either containing an anticoagulant or not, as is required when estimating a patient’s hematological and biochemical status. Serum albumin, glucose, creatinine, phosphorus, alanine, and aspartate aminotransferase (ALT and AST), along with blood urea nitrogen were all measured using an automated biochemical analyzer. Plasma homocysteine and cysteine concentrations, along with plasma IS levels were quantified by through high performance liquid chromatography using fluorescence detection, following the modified methods of Araki and Sako [26] and Cheng et al. [27], respectively. Plasma malondialdehyde (MDA) and oxidized low-density lipoprotein (ox-LDL) levels were assessed as indicators of oxidative stress. Plasma MDA concentration was measured along with thiobarbituric acid reactive substances at an excitation wavelength of 515 nm and an emission wavelength of 555 nm using a fluorescence spectrophotometer [28]. The plasma ox-LDL level was measured using a commercial kit (Mercodia AB, Sylveniusgatan 8A, SE-754 50, Uppsala, Sweden). Trolox equivalent antioxidant capacity (TEAC) was analyzed according to the previous method [29]. Plasma GSH and GSSG concentrations, along with GSH-Px activities were determined using the respective commercial kits (Cayman Chemical Company, Ann Arbor, MI, USA).
Statistical analysis
All data analyses were performed using the SAS statistical software package (version 9.4; Statistical Analysis System Institute Inc., Cary, NC, USA). A Shapiro-Wilk test was performed to test normal distribution. Demographic characteristics and biochemical data were compared for significance amongst groups using a one-way analysis of variance or the Kruskal-Wallis 1-way analysis of variance on ranks. The χ2 or Fisher’s exact tests were implemented for the analyses of categorical variables. Partial Spearman’s correlation analysis was used to assess the association of homocysteine, cysteine, and IS concentrations with levels of oxidative stress indicators and GSH-dependent antioxidant activity after adjusting for potential confounders. Multiple linear regression analyses with eGFR levels as the dependent variable, were used to examine the association of kidney function with homocysteine, cysteine, IS, oxidative stress indicators, and GSH-dependent antioxidant activity after adjusting for potential confounders. The value of P < 0.05 was considered as being statistically significant.
RESULTS
Demographic characteristics and hematological measurements
A total of 132 CKD patients, with 21 at stage 1, 31 at stage 2, 31 at stage 3a, 20 at stage 3b, 16 at stage 4, and 13 at stage 5 were recruited for this study. As the number of patients were too few in both stages 4 and 5, and the CKD patients within these stages were determined as having similar characteristics, we then combined these 2 stages into one group. The mean and median age of all CKD patients was 57.6 years and 59 years, respectively, with a range of 20–78 years. There were no significant differences in the values of age, sex, height, weight, BMI, systolic and diastolic blood pressures, ALT, AST, albumin, or glucose among the groups (Table 1).
Table 1
Demographic characteristics and hematological measurements in patients at different stages of chronic kidney disease
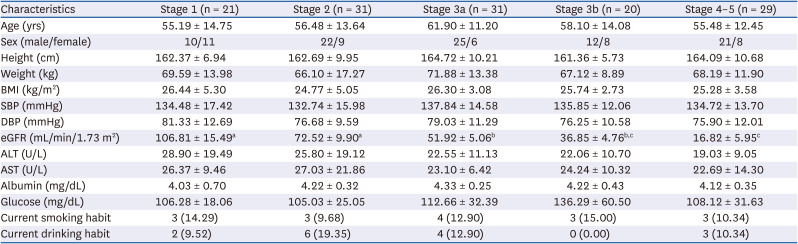
Values are means ± SD or number (%).
BMI, body mass index; SBP, systolic blood pressure; DBP, diastolic blood pressure; eGFR, estimated glomerular filtration rate; ALT, alanine aminotransferase; AST, aspartate aminotransferase.
a,b,cValues in a row with different superscript letters are significantly different, P ≤ 0.05.
Uremic toxins, oxidative stress and antioxidant capacities
In order to illustrate the levels of homocysteine and IS, and GSH-dependent antioxidant capacity in different stages of CKD, the levels of uremic toxins and indicators of oxidative stress and GSH-dependent antioxidant activities during different stages of CKD patients were measured, with results list in Table 2. Patients at a more advanced CKD stage had stepwise increments of plasma uremic toxin levels, while GSH-Px activity tended to decrease stepwise across CKD stages. Stage 4-5 CKD patients apparently had the highest serum BUN and plasma IS concentrations among the 5 groups. On the other hand, the levels of MDA, ox-LDL, TEAC, GSH, GSSG, and GSH/GSSG ratio were similar among groups.
Table 2
Plasma uremic toxins, indicators of oxidative stress and antioxidant capacities in patients at different stages of chronic kidney disease
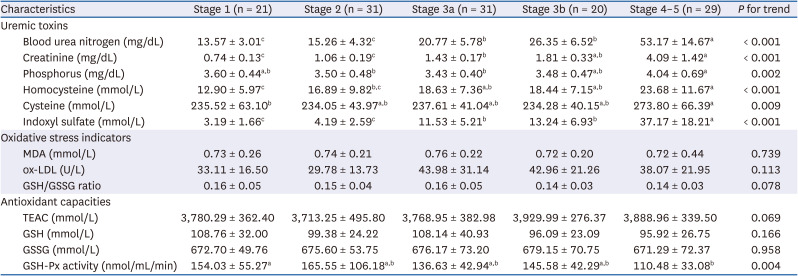
Values are means ± SD.
MDA, malondialdehyde; ox-LDL, oxidized low density lipoprotein cholesterol; GSH, glutathione; GSSG, oxidized glutathione; TEAC, trolox equivalent antioxidant capacity; GSH-Px, glutathione peroxidase.
a,b,cValues in a row with different superscript letters are significantly different, P ≤ 0.05.
Correlation of uremic toxins with oxidative stress and GSH-dependent antioxidant capacities
We then performed partial Spearman’s correlation coefficient analyses to assess the association of homocysteine, cysteine, and IS levels with oxidative stress indicators and GSH-dependent antioxidant activity after adjusting for age, gender, BMI, albumin, smoking and drinking habits in each CKD stage and all CKD patients (Table 3). Plasma homocysteine, cysteine and IS concentrations were all observed to be associated with each other after adjusting for potential confounders in all CKD patients. These 2 uremic toxins, as well as cysteine, negatively correlated to GSH-Px activity levels in all CKD patients. Among homocysteine, cysteine and IS, only plasma homocysteine concentration was negatively associated with GSH-Px activity in CKD stages 2, 3a and 4–5.
Table 3
Partial Spearman’s correlation coefficients (rs ) of homocysteine, cysteine, and IS with indicators of oxidative stress and glutathione-dependent antioxidant capacities in patients at different stages of chronic kidney disease1)
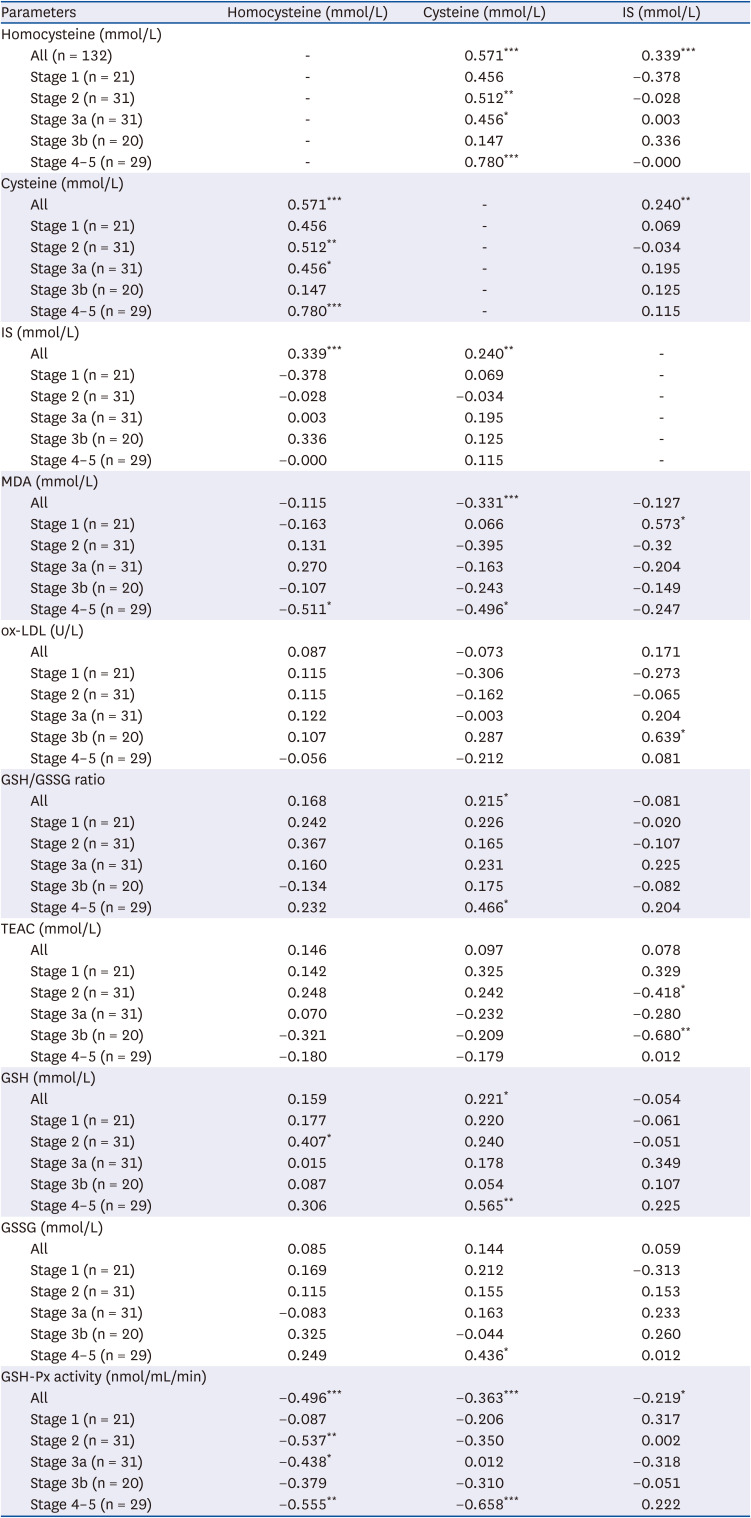
IS, indoxyl sulfate; MDA, malondialdehyde; ox-LDL, oxidized low density lipoprotein cholesterol; GSH, glutathione; GSSG, oxidized glutathione; TEAC, trolox equivalent antioxidant capacity; GSH-Px, glutathione peroxidase.
1)Values are rs
, correlation coefficient. Adjusting for age, gender, body mass index, albumin, smoking and drinking habits.
*P < 0.05, **P < 0.01, ***P < 0.001.
The effects of uremic toxins, oxidative stress and GSH-dependent antioxidant capacity on renal function
In order to understand whether uremic toxins, oxidative stress or GSH-dependent antioxidant capacity had any influence on kidney function, multiple linear regression models, with the eGFR level as the dependent variable after adjusting for age, gender, BMI, albumin, smoking and drinking habits were performed, with the results shows in Table 4. We observed that the plasma levels of MDA, ox-LDL, TEAC, GSH, GSSG, and GSH/GSSG ratio had no association with kidney function in all CKD patients. However, plasma homocysteine, cysteine, and IS levels had a significantly negative association with kidney function; whereas GSH-Px activity had a significant association with eGFR levels. To investigate whether homocysteine, cysteine, IS, and GSH-Px activity are dependent or independent with one another when associated with kidney function, the levels of homocysteine or cysteine, IS and GSH-Px activities were then further simultaneously adjusted in multiple linear regression models (Table 4). Plasma IS levels were negatively associated with eGFR levels after adjusting for potential confounders, homocysteine, cysteine and GSH-Px activity. In addition, IS levels interacted with GSH-Px activity to be associated with kidney function. On the other hand, the association of plasma homocysteine, cysteine, and GSH-Px activity levels with kidney function had disappeared after being additionally adjusted for plasma IS levels.
Table 4
Multiple linear regression of various parameters with estimated glomerular filtration rate as the dependent variable after adjusting for potential confounders1)
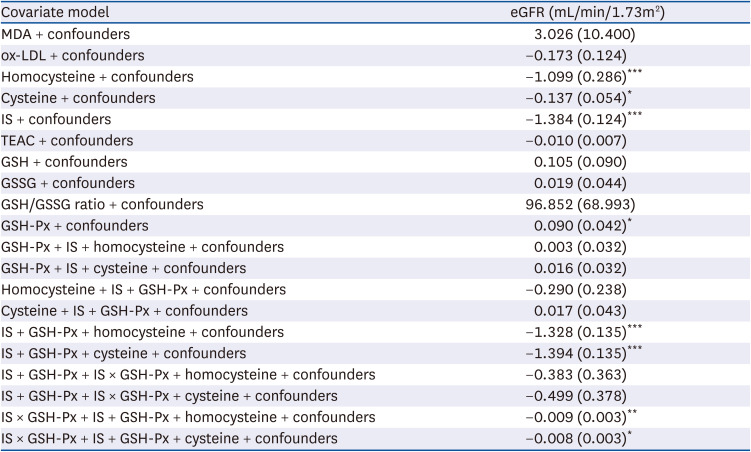
MDA, malondialdehyde; ox-LDL, oxidized low density lipoprotein cholesterol; IS, indoxyl sulfate; TEAC, trolox equivalent antioxidant capacity; GSH, glutathione; GSSG, oxidized glutathione; GSH-Px, glutathione peroxidase; eGFR, estimated glomerular filtration rate.
1)n = 132. Values are β, regression coefficient (SE). Adjusted for confounders (i.e., age, gender, body mass index, albumin, smoking and drinking habits).
*P < 0.05, **P < 0.01, ***P < 0.001.
DISCUSSION
Increased oxidative stress is well recognized as being an important metabolic accompaniment in CKD patients. Previous studies have indicated that CKD patients had a higher oxidative stress status than healthy subjects [81314151620]; however, the oxidative stress status (i.e., MDA, ox-LDL and GSH/GSSG ratio) of our CKD patients not only remained showing no fluctuation among patients at the different CKD stages, but there was also no association with kidney function in the present study. It is worth noting that antioxidant capacity (i.e., TEAC, GSH and GSSG) also remained steady amongst patients at different CKD stages. Cysteine is a major, yet limiting substrate for the synthesis of GSH within cells. Although we did not measure other substrates of GSH synthesis (i.e., glycine and glutamate), plasma cysteine concentration was not reduced following kidney function loss. In our CKD patients, sufficient cysteine concentration may have helped maintain GSH synthesis during different CKD stages. As long as CKD patients, including those at an advanced disease stage, still possess a capable antioxidant capacity to cope with increased oxidative stress, GSH and its dependent antioxidant capacity may not be a significant factor affecting oxidative stress status during kidney function loss.
Under an increased oxidative stress condition, GSH is oxidized to GSSG, and along with GSH-Px, reduces hydroperoxides. Plasma GSH-Px is synthesized primarily in proximal kidney tubular cells [17], an early consequence of active nephron mass reduction, which in turn may lead to the reduction of plasma or erythrocyte GSH-Px activity in CKD patients [19203031]. Therefore, it was not surprising to us when we observed that plasma GSH-Px activity experienced a significant reduction following different stages of kidney dysfunction in our CKD patients. Plasma GSH-Px activity seemed to deplete when catalyzing the reduction of hydrogen peroxide and other organic hydroperoxides to water at the advanced stages of the disease. In spite of GSH being a substrate of GSH-Px, GSH-Px is a selenium-containing enzyme, so its selenium status has thus been recognized as being another key factor affecting plasma GSH-Px activity in CKD patients [32], although not all studies have agreed with this conclusion [2033]. Since selenium concentration was not analyzed in our study, the relationship between plasma GSH-Px activity and selenium cannot be discussed further here. GSH-Px is the first line of cellular defense in the human body, and even though the first line of the antioxidant defense system may have been exhausted, secondary antioxidant enzymes in the antioxidant defense system, such as GSH-St, may be expected as being capable of coping with oxidative stress in CKD patients. Unfortunately, we did not measure GSH-St activity, otherwise the overall picture of GSH-dependent antioxidant capacity would be better understood during the different stages of CKD in patients.
Even though many factors have been mentioned in association with increased oxidative stress during kidney function loss, the accumulation of uremic toxins in the circulation is an important contributing factor for increased oxidative stress in CKD patients [9101112]. However, an elevation in uremic toxins (i.e., homocysteine and IS) had no relationship with oxidative stress indicators, but did have a direct contribution to kidney dysfunction in our CKD patients. It seemed that uremic toxins could directly ruin kidney function without regulating other mechanisms which affect it. Similarly to our previous study [8], a high homocysteine concentration was independent of oxidative stress when associated with the risk of CKD. Although the pathogenesis of hyperhomocysteinemia in CKD patients is not fully understood, a progressive increase in homocysteine levels has been associated with decreased eGFR in patients with CKD [3435]. In spite of the significant role which homocysteine plays in the risk of CKD, IS (a gut-derived uremic toxin) not only had a significant association with kidney function in our CKD patients and those from other studies [63637], it also played a more dominant role than homocysteine when associated with kidney function.
IS is tightly bound to albumin, and is difficult to efficiently remove during dialysis progression [3]. Increased IS concentration has been shown to cause nephrovascular toxicity, as well as damage to vascular smooth muscle cells, while also enhancing inflammatory gene expression and promoting, renal fibroblast activation, degeneration of kidney tubular epithelial cells and kidney interstitial cells [4113839]. In addition, IS involves itself in the progression of vascular and hemostatic dysfunction to cause cardiovascular toxins and atherogenesis [40], and thus creates a significant link between CKD and the presence of cardiovascular disease [414243]. Since IS not only exerts profibrotic, prooxidative and proinflammatory activities, while also stimulating CKD progression [404445], it could interact with GSH-Px to mediate the damage of kidney function. Therefore, plasma IS concentrations and GSH-Px activity should be regularly monitored for patients at any stage of CKD in order to reduce or prevent kidney dysfunction. In line with the study performed by Yu et al. [46], IS was not correlated with GSH, GSSG or GSH/GSSG ratio in our CKD patients. Dou et al. [47] indicated that high IS concentrations (497.4 and 994.8 μmol/L) would decrease total GSH concentrations by 37% and 67% in human umbilical vein endothelial cells, respectively; while lower IS concentrations (99.5 and 199 μmol/L) had no effect on total GSH levels. The IS levels of CKD patients were between 6.4 ~ 72.4 μmol/L in the study of Yu et al. [46], and between 1.5–93.7 μmol/L in the present study; these IS levels were significantly less than the concentrations which were treated in endothelial cells by Dou et al. [47]. This may explain why our team and Yu et al. [46] did not observe any association between plasma IS concentration and an oxidative stress indicator (GSH/GSSG ratio) in CKD patients. Uremic toxin adsorbents (i.e., oral carbonaceous adsorbent AST-120) [446], along with an increase in dietary fiber intake [4849] have been shown to effectively reduce IS concentrations. Therefore, we might postulate that effective treatment towards lowering IS would not exhaust GSH utilization, and could maintain adequate GSH dependent antioxidant capacity during any CKD stage.
The strength of this study was due to the recruitment of patients coming from all stages of CKD. Therefore, the levels of uremic toxins, along with indicators of oxidative stress and antioxidant capacity could be compared amongst all CKD stages. However, there were some limitations in the study. First, all patients were recruited from a single center. In addition, the causes of CKD were diverse and included diabetes mellitus, hypertension, family history, glomerulonephritis, polycystic kidney disease, lupus, obstruction, malformation or repeated urinary infection, all of which could cause CKD development and progression. Therefore, the association between uremic toxins and antioxidant capacity could vary based on the cause of CKD. Additionally, the cross-sectional study design was lacking both a longer observation period and more repeated measurements at defined intervals, thus it could not determine the cause-and-effect of uremic toxins, oxidative stress and antioxidant capacity on kidney function in CKD patients. Therefore, we were unable to clarify whether the interaction of uremic toxins and antioxidant capacity could affect CKD development or progression. The other limitation within this study was that PCS, another important uremic toxin, was not measured. However, IS is highly correlated with PCS levels in Asian CKD patients and displays a higher level than those found in the Caucasian population [6]. We believe that the IS level could reflect uremic status even though we did not measure PCS levels in our CKD patients.
In conclusion, our results reveal that plasma IS concentration was independent of oxidative stress indicators, homocysteine and GSH, but has synergistic effects with GSH-Px which are associated with kidney function. We believe that higher IS concentrations need to be monitored and controlled during the different stages of CKD in patients.
 XML Download