

 PDF
PDF Citation
 Print
Print


INTRODUCTION
Sufficient macro and micronutrient consumption are essential for the healthy growth of children. High dietary diversity is a strong determinant for reducing the prevalence of stunting among children under two years of age in low- and middle-income countries [1]. The World Health Organization (WHO) recommends introducing complementary foods at 6 months of age due to decreased nutrients received from breastmilk [2], and by 12 months of age most infants can consume and ingest solid/family foods [3]. However, the delayed introduction of solid foods may not benefit the optimal development of children.
Consumption of diverse foods is assessed using an indicator of minimum dietary diversity (MDD: Consumption of ≥ 5 of 8 food groups in the previous 24 h) among children 6–23 months of age [4]. The regional prevalence of MDD in South Asia and Southeast Asia is 20% and 40%, respectively. The estimate of MDD in South Asia is even lower than Eastern and Southern (24%) and West and Central Africa (25%) [5]. The low proportion of MDD in South Asia accounts for the high prevalence of stunted children (31.7%) in the region. In contrast, a relatively low proportion of stunted children (24.7%) in Southeastern Asia [6] reflects better access to staple and diverse food options.
Some studies have evaluated childhood diet using MDD, the composite measures of dietary diversity, to reveal its socio-economic disparity. The proportion of MDD at population level showed a positive association with Gross Domestic Product (GDP) per capita [7], higher wealth and urban residence [7], food supply diversity [8], and maternal literacy [8]. The socio-economic gap in the proportion of MDD was apparent mostly in East Asia & the Pacific [7]. However, very little has been investigated for the disparity in the consumption of individual food items that are re-grouped to make composite variables. Access and availability of each food item vary by context, as food choices are a complex outcome of individual, socio-economic, cultural, and environmental factors [9]. Exploring food consumption at a basic level would provide useful and contextualized information about child feeding, and consequently, it helps to prepare policy recommendations related to the nutrition of infants and young children.
From Demographic and Health Surveys (DHS) questionnaire, this study leveraged ten questions related to 1) grains, 2) legumes, 3) vitamin A-rich fruits, 4) dark green leafy vegetables (DGLV), 5) vitamin A-rich vegetables, 6) other fruits and vegetables (OFV), 7) fish, 8) meat, 9) dairy, and 10) eggs. This study aims to descriptively examine how the consumption of these 10 food items among children 6–23 months of age varies across socio-economic strata by region (South Asian countries vs. Southeast Asian countries). To reveal the socio-economic gap in the consumption of each food item, we introduced a concept of “equity gap,” which is the arithmetic difference in the percent consumption between the wealthiest quintile and the lowest wealth quintile and between urban and rural areas [10]. Along with ten food items, the equity gaps for MDD were explored to present a comprehensive dietary diversity in eight countries. To enrich the interpretation of the socio-economic and regional equity gap, we described a pattern of food consumption from 6 to 23 months of age.
SUBJECTS AND METHODS
Data source
Among the recent round of DHS in South Asia and Southeast Asia, a total of nine countries were available. Out of these countries, India was excluded from the analysis due to intra-country diversity. Thus, the final data sources used for this study were Afghanistan DHS 2015 [11], Bangladesh DHS 2014 [12], Nepal DHS 2016 [13], and Pakistan DHS 2017–2018 [14] in South Asia; and Cambodia DHS 2014 [15], Myanmar DHS 2015–2016 [16], Indonesia DHS 2017 [17], and Timor-Leste DHS 2016 [18] in Southeast Asia.
The detailed sampling frame of each DHS is described in each country’s report. In the South Asian countries, the number of observations for children 6–23 months of age with information of food consumption was 8,410 in Afghanistan, 2,371 in Bangladesh, 1,478 in Nepal, and 3,490 in Pakistan. In Southeast Asia, the number of observations included in the data analysis was 2,182 in Cambodia, 5,113 in Indonesia, 1,379 in Myanmar, and 2,115 in Timor-Leste.
Food items
In the women’s questionnaire from the DHS survey, mothers were asked to answer which food items their 6-23-month-old child had consumed in the past 24 hours. The original food items from DHS were first grouped into following ten items: 1) grains (i.e., bread, noodles, other made from grains, potatoes, cassava, other tubes, and fortified baby foods), 2) legumes (i.e., beans, peas, lentils, nuts), 3) DGLV, 4) vitamin A-rich fruits (i.e., mangoes, papayas), 5) vitamin A-rich vegetables (i.e., pumpkin, carrots, squash, or orange inside), 6) OFV, 7) fish (i.e., fish or shellfish), 8) meat (i.e., beef, pork, lamb, chicken, organ meat), 9) dairy (i.e., cheese, yogurt, tinned, powered or fresh milk, and baby formula), and 10) eggs. In the DHS, food consumption in the past 24 hours for each food group was reported as yes or no without assessing the amount of food consumed. As appropriate, we further classified these ten food items into three larger categories: 1) grains and legumes; 2) fruits and vegetables: DGLV, vitamin A-rich fruits, vitamin A-rich vegetables, and OFV; and 3) animal source foods: fish, meat, dairy, and eggs. MDD was defined as 5 out of 8 food groups, including breastmilk [4]: 1) grains, 2) legumes, 3) vitamin A-rich fruits and vegetables, 4) OFV, 5) flesh foods (i.e., fish, meat, and organ meat), 6) dairy, 7) eggs, and 8) breastmilk.
Statistical analysis
The ten food items and MDD was tabulated by wealth quintiles (poorest vs. wealthiest) and geographical areas (rural vs. urban), accounting for sampling weights and survey design in the eight countries. For each food item and MDD, an equity gap denoted by percentage points (pp) was calculated as an arithmetic difference in the proportion of consumption 1) between the highest wealth quintile and lowest wealth quintiles and 2) between rural areas and urban areas. In each country, the socio-economic difference was tested by survey-design adjusted chi-squared test. An equiplot approach has been used to represent absolute inequality in intervention coverages or public health indicators globally or within individual countries [71019]. In this study, the equiplot was produced to show the disparity in each of the ten food groups visually by wealth quintiles and by geographic area. Lowess smoothing plots were drawn for the trend of consumption of ten food items from the ages of 6 to 23 months. We conducted a descriptive comparison regarding the trend of ten food items’ consumption between South Asia and Southeast Asia, presented through equiplots and lowess curves.
Ethical approval
All eight DHS data are publicly accessible and were available upon our request to the DHS Program, ICF International. The survey protocol and questionnaires of the 2015 Afghanistan DHS were approved by the ICF Institutional Review Board and the Ministry of Public Health of Afghanistan [20]. The 2014 Bangladesh DHS was approved by the Bangladesh National Institute of Population Research and Training (NIPORT) [21]. The 2017-18 Pakistan DHS protocol was approved by The National Bioethics Committee of the Pakistan Health Research Council [22]. The 2016 Nepal DHS protocol was approved by the Nepal Health Research Council (NHRC) [23]. The 2014 Cambodia DHS was approved by the National Ethics Committee for Health Research [24]. The 2017 Indonesia DHS has passed the ethical review from the National Institute for Research and Development of the Indonesian Ministry of Health [25]. The 2015-16 Myanmar DHS protocol was approved by the Ethics Review Committee on Medical Research Including Human Subjects [26]. The survey protocol of the 2016 Timor-Leste DHS was approved by the ICF Institutional Review Board [27].
RESULTS
In general, the wealthiest group and urban residents had a higher consumption of most of the 10 food items and MDD compared to the poorest group and rural residents across eight countries (Fig. 1). The majority of food items showed narrower equity gaps between rural and urban areas as compared to between the wealthiest and lowest quintiles. Also, larger equity gaps in some food consumption were found in Southeast countries than South Asian countries (Figs. 1 and 2). Hereafter, we described the socio-economic equity gap and differences in the equity gaps between South Asia and Southeast Asia by each food item (Table 1 and Supplementary Table 1).
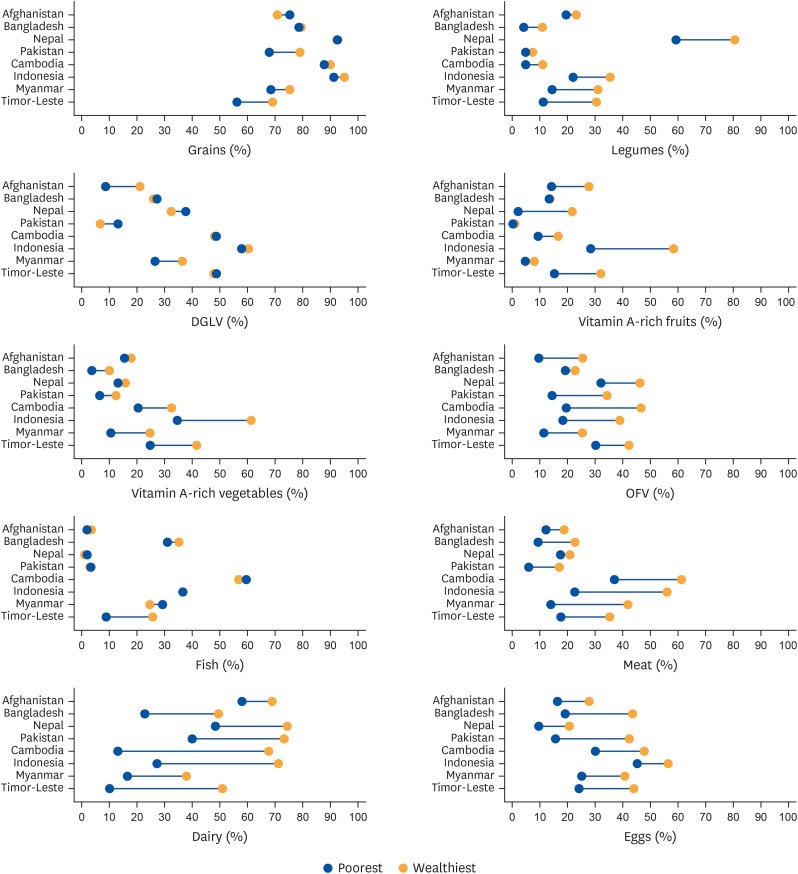
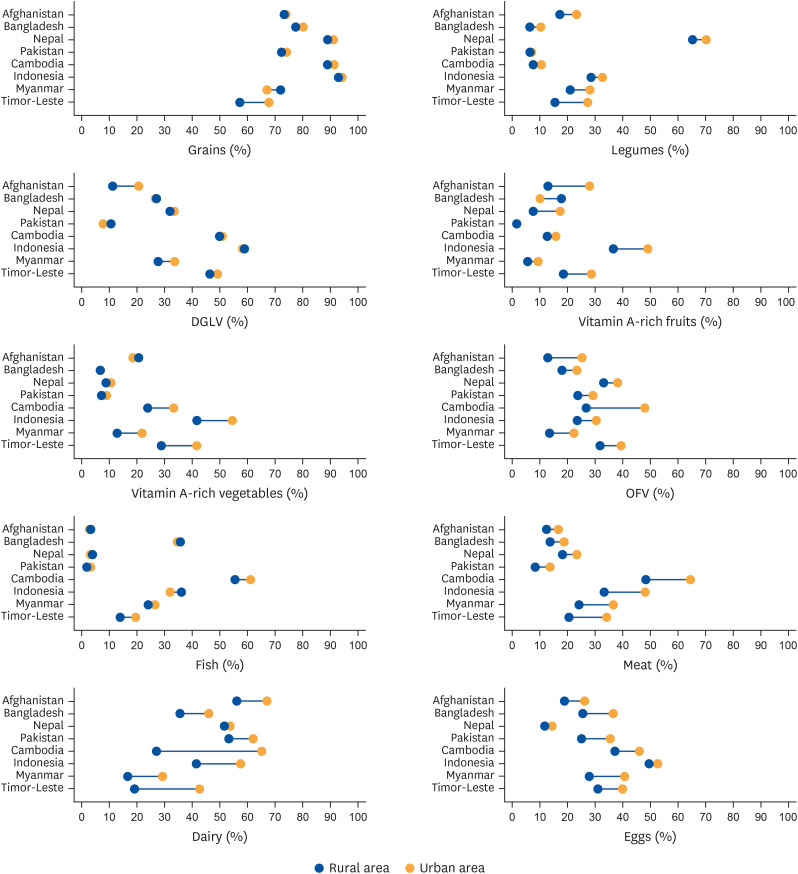
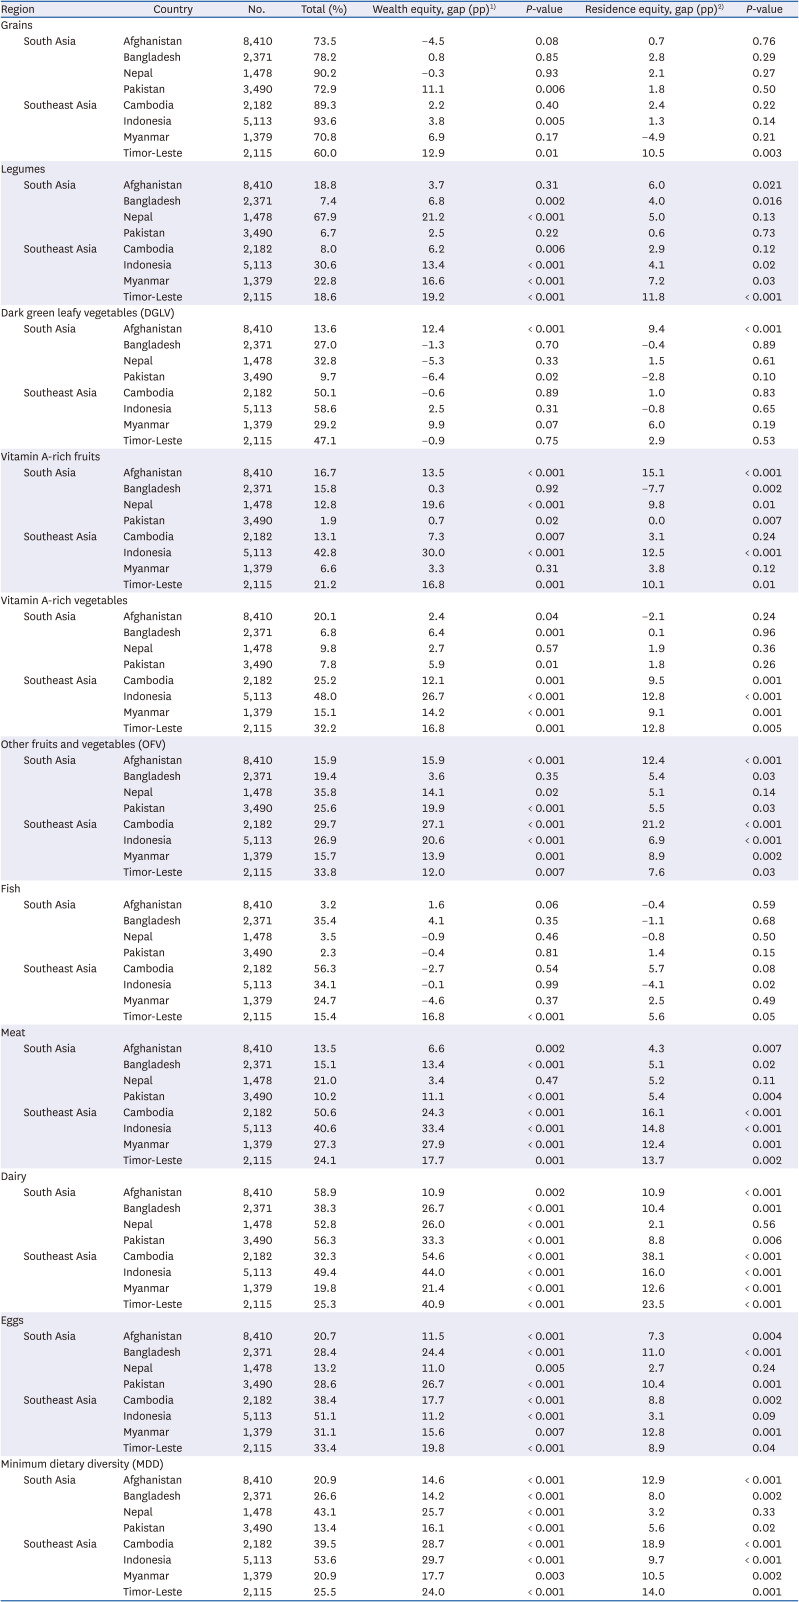
Fig. 1
Equiplots of food group consumption by wealth quintiles (poorest vs. wealthiest) in 4 South Asian countries (Afghanistan, Bangladesh, Pakistan, and Nepal) and 4 Southeast Asian countries (Cambodia, Indonesia, Myanmar, and Timor-Leste).
DGLV, dark green leafy vegetables; OFV, other fruits and vegetables.
![]()
Fig. 2
Equiplots of food group consumption by geographical area (rural vs. urban) in 4 South Asian countries (Afghanistan, Bangladesh, Pakistan, and Nepal) and 4 Southeast Asia countries (Cambodia, Indonesia, Myanmar, and Timor-Leste).
DGLV, dark green leafy vegetables; OFV, other fruits and vegetables.
![]()
Table 1
Food group consumption by wealth quintiles and geographical area in four South Asian countries (Afghanistan, Bangladesh, Pakistan, and Nepal) and four Southeast Asian countries (Cambodia, Indonesia, Myanmar, and Timor-Leste)
1)Difference in the proportion of each food item between the wealthiest group and the poorest group.
2)Difference in the proportion of each food item between urban and rural area.
![]()
Grains
The proportion of grain consumption among young children was 73.5–90.2% in South Asia and 70.8–93.6% in South Asia (Table 1). The grain consumption was largely equitable in both regions: South Asia (−4.5 pp to 11.1 pp between wealth quintiles; 0.7 pp to 2.8 pp; between rural and urban areas) and Southeast Asia (2.2 pp to 12.9 pp; −4.9 pp to 10.5 pp). A large equity gap by wealth status was found in Pakistan (11.1 pp; P = 0.006), Indonesia (3.8 pp; P = 0.005), and Timor-Leste (12.9 pp; P =0.011).
Legumes
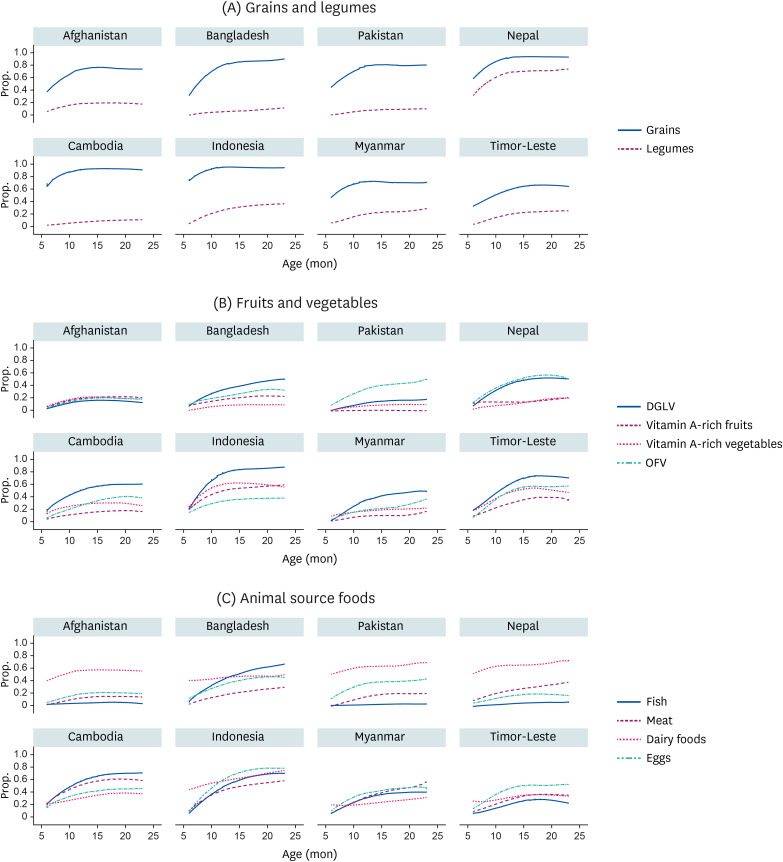
The introduction of legumes occurred at a later age in most countries, except Nepal (Fig. 3). The largest wealth equity gap of legume consumption was found in Nepal (21.2 pp; P < 0.001). The equity gap by wealth was narrower in the other three South Asian countries (2.5 pp to 6.8 pp) than in South Asian countries (6.2 pp to 19.2 pp) (Table 1). The equity gap between rural and urban areas was likely to be similar in all countries (0.6 pp to 7.2 pp) except for Timor-Leste (11.8 pp).
DGLV
The consumption of DGLV seemed to be higher among young children in Southeast Asia (range: 29.2% to 58.6%) than in South Asia (range: 9.7% to 32.8%) (Table 1). The DGLV consumption was equal in the wealthiest and poorest groups in Southeast Asia (−0.9 pp to 9.9 pp). In South Asia, Afghanistan (12.4 pp; P <0.001) and Pakistan (−6.4 pp; P = 0.02) showed a significant inequity in DGLV consumption (Table 1; All P > 0.05). A rural/urban gap in the consumption of DGLV was not significant (all P > 0.05) in all study countries except for Afghanistan (9.4 pp; P < 0.001).
Vitamin A-rich fruits
Overall, the consumption of vitamin A-rich fruits was low, but it was lower in South Asia (range: 1.9% to 16.7%) than in Southeast Asia (range: 6.6% to 42.8%) (Table 1). Vitamin A-rich fruit consumption remained low without a visible increase with age in the four South Asian countries (Fig. 3). The equity gap by wealth for vitamin A-rich fruit consumption was narrower in South Asia (0.3 pp to 19.6 pp) than Southeast Asia (3.3 pp to 30.0 pp).
Vitamin A-rich vegetables
The consumption of vitamin A-rich vegetables was largely lower in South Asia (6.8% to 20.1%) than in Southeast Asia (15.1% to 48.0%) (Table 1). Likewise, the equity gap by wealth status in the consumption of vitamin A-rich vegetables was narrower in South Asia (2.4 pp to 6.4 pp; all P < 0.05) than in Southeast Asia (12.1 pp to 26.7 pp; all P < 0.05). The rural/urban equity gaps were not significant in South Asia (0.1 pp to 1.9 pp; all P >0.05) while the gaps were all significant in Southeast Asia (9.1 pp to 12.8 pp; all P < 0.01).
OFV
The consumption of OFV were likely to be similar in South Asia (15.9% to 35.8%) and Southeast Asia (15.7% to 33.8%) (Table 1). The equity gap of OFV by wealth status in Bangladesh was notably lower (3.6 pp; P = 0.35) than the equity gap in other countries (12.0 pp to 27.1 pp; all P < 0.05). There was no apparent difference in equity gap between South Asia and Southeast Asia. The equity gap was particularly high in Cambodia for wealth quintile (27.1 pp; P < 0.001) and residence (21.2 pp; P < 0.001).
Fish
Fish consumption was limited in South Asia, being eaten by less than 4% of the study populations in Afghanistan, Pakistan, and Nepal, with Bangladesh being a notable exception (36.9%) (Table 1). The consumption in Southeast Asia is substantial (25.7% to 56.9%). The consumption was equitable for wealth status in all four South Asian countries with < 5.00 pp (all P > 0.05) and three Southeast Asian countries (−0.1 pp to −4.6 pp; all P > 0.05) except Timor-Leste (16.8 pp; P < 0.001) . Also, the consumption did not differ between rural and urban areas in both regions. Indonesia showed a slightly higher fish consumption in rural area than urban areas (−4.1 pp; P < 0.001).
Meat
Meat consumption continued to increase with child age in Southeast Asian countries and Bangladesh (Fig. 3). Meat was consumed less in South Asian countries (12.1% to 21.5%) than in Southeast Asia (22.5% to 51.7%) (Table 1). Meat consumption was higher for wealthiest and urban residence in all countries; there were narrower wealth equity gaps (3.3 pp to 11.4 pp; all P < 0.05 except for Nepal) in South Asia than in Southeast Asia (14.7 pp to 32.5 pp; all P < 0.05).
Dairy
The consumption of dairy foods was slightly higher in South Asia (38.3–56.3%) than in Southeast Asia (19.8–49.4%), while a wider equity gap was observed in Southeast Asia (21.4 pp to 54.6 pp; all P < 0.01) than in South Asia (10.9 pp to 33.3 pp; all P < 0.001) (Table 1). In general, the introduction of dairy foods started notably earlier in South Asia than in Southeast Asia. Afghanistan showed the highest dairy consumption proportion (58.9%) and, at the same time, a relatively narrow wealth equity gap (10.9 pp; P = 0.002).
Eggs
Eggs were more consumed with increased child age and more often in Southeast Asia (range: 33.4% to 51.1%) than in South Asia (13.2% to 28.6%) (Table 1). The equity gap by wealth was narrower in Southeast Asia (11.2 pp to 19.8 pp; all P < 0.05) than South Asia (11.0 pp to 26.7 pp; all P < 0.05). The equity gap in egg consumption was smallest in Nepal (11.5 pp; P < 0.001) and the largest in Pakistan (26.7 pp; P < 0.001).
MDD
Children in South Asia (13.4% in Pakistan to 43.1% in Nepal) were less likely to meet MDD than children in Southeast Asia (20.0% in Myanmar to 53.6% in Indonesia) (Table 1). The equity gap by wealth was narrower in Southeast Asia (14.2 pp to 25.7 pp; all P < 0.001) than South Asia (17.0 pp to 29.8 pp; all P < 0.01) (Fig. 4).
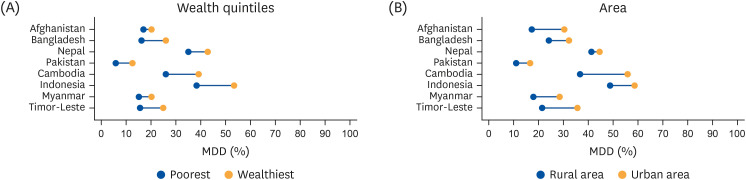
Fig. 4
Equiplots of MDD by (A) wealth quintiles (poorest vs. wealthiest) and (B) geographical area (rural vs. urban) in 4 South Asian countries (Afghanistan, Bangladesh, Pakistan, and Nepal) and 4 Southeast Asia countries (Cambodia, Indonesia, Myanmar, and Timor-Leste).
MDD, minimum dietary diversity.
![]()
DISCUSSION
We examined the socio-economic differences in the consumption of ten food items and MDD available in the DHS questionnaire comparing four South Asian countries and four Southeast Asian countries. Most foods’ consumption gradually increased until 12 months of age, after which the uptrend slowed until 23 months of age. In the eight selected countries, some fruits and vegetables continued to show increased consumption until 23 months of age without a breakpoint. The equity gaps in the consumption of grains, DGLV, and fish were relatively narrow in all eight countries, while vitamin A-rich fruits, vitamin A-rich vegetables, OFV, meat, dairy, and eggs showed a wider gap in each country. The Southeast Asian countries showed broader equity gaps for various food items, such as legumes, meat, fish, and DGLV, than the South Asian countries.
Most food items’ consumption was higher in the wealthiest quintiles and the urban areas across all countries, with a larger equity gap when assessed by wealth status compared to the geographic area. Household income is a well-known key driver of dietary choices [28]. Given the distribution of Gini co-efficient, which presents the income inequality, and the Multidimensional Poverty Index, better economic status is found in the four Southeast Asian countries (Supplementary Table 2). Broad equity gaps for food items may be explained by a wide gap in socio-economic status in Southeast Asia. Lack of social support, poor governmental infrastructure, corruption, and lack of access to education may not only contribute greatly to stark wealth gaps between the rich and the poor in these countries, but also influence the ability to access certain foods [29].
In our study, the Southeast Asian countries showed a wider gap in the consumption of vitamin A-rich fruits and vegetables than South Asia. In Southeast Asia, emerging modern food systems, rapid population growth, urbanization, and rising incomes have significantly changed food systems over the last few decades [30]. On the contrary, agriculture in South Asia struggles with low productivity of staples, lack of supply, high prices, low returns to farmers, and area diversification [31]. South Asia is the home of 423 million people living on less than one dollar a day, and 279 million, two-thirds, of the undernourished individuals in Asia, which is comparatively higher than in Southeast Asia (61 million) [3132]. The narrow equity gap in Vitamin A-rich vegetables in South Asia might be explained by lack of government surveillance, lack of food laws, or lack of monitoring of Vitamin A levels in children more broadly. Countries such as Bangladesh that have instituted supplementation and surveillance programs across communities have observed a decrease in Vitamin A deficiency [33].
It has been consistently found that the prevalence of fruit and vegetable consumption was positively associated with socio-economic level [34]. In our study, an equitable consumption of DGLV was seen, but vitamin A-rich fruits and vegetables were socio-economically, disproportionately distributed. This suggests that the dynamics of food selection are being impacted through various dimensions in the selection of fruits and vegetables. Costs of these vitamin A-rich fruits and vegetables are unaffordable for large proportions of the population in the Asia Pacific region [35]. Our study findings were consistent with the existing literature, which implies inequalities in accessing foods and achieving healthy diets (e.g., fruits and vegetables) and child diets do not meet the recommended nutrition levels.
Economic differences can explain the large equity gap in meat consumption in Southeast Asia. A low proportion and a smaller equity gap in meat consumption shown in South Asia could be due to mixed outputs of taboo foods and religious practices from Muslim-dominant countries (Afghanistan [99.7%], Bangladesh [89.6%], Pakistan [96.4%] or Hindu (Nepal [81.3%]) (Supplementary Table 2). The SCRiPT (Socio-Cultural Research in Protein Transition) study in Malaysia (n = 1,604) showed that consumption of animal protein was associated with education and ethnicity, while ethnicity and religion determined the consumption of plant proteins [36]. Indonesia showed the widest gap in meat consumption, likely explained by the limited availability of meat in the low-income group. A study in Indonesia reported that 27% of children ate a diverse diet of animal source food (eggs, processed meats, and milk) [37].
WHO has observed that urbanization has indirectly increased livestock consumption due to increased support for trade and improved infrastructure. Perhaps some countries undergoing increased urbanization, such as these in Southeast Asia, have not yet been able to reach the same food consumption patterns compared to other countries that had been already urbanized [38].
A study reported household dairy production was associated with a 0.52 standard deviation increase of height-for-age Z-scores and a 21.7 point reduction of breastfeeding rate among East African children [39]. Our study noted higher dairy consumption in South Asia than in Southeast Asian countries and urban areas in almost all countries. The occurrence of early introduction and consumption of dairy products by children was high in Afghanistan, suggesting that it is the only source with high nutrient quality given other nutrient-rich food items are introduced at a later age or still remain low until 23 months of age. In contrast, dairy consumption was limited in most other countries. In Pakistan, the livestock sector contributes 11.1% to the country’s GDP and 58.9% to agricultural value-added [4041]. Although more than 80% of milk production occurs in rural areas and is available among rural families as an accessible food item, severe undernutrition occurs in rural areas [40]. The lower consumption and large equity gap for dairy could be explained by its relatively high price; Fresh milk calories are 16 times more expensive than cereal calories in Southeast Asia and 5.4 times more expensive than grains in South Asia [42].
In the present study, Cambodian children consumed fish more often than all the other seven countries. A study in Malawi showed that fish consumption predicted a higher height-for-age Z-score among young children, 1–3 years old [43]. High fish consumption in Bangladesh and the Southeast Asian countries is due to easy access to the many rivers and possible cheap costs [4445]. The other three countries in South Asia are landlocked (Supplementary Table 2) with limited availability and access to seafood [46]. A unique pattern in fish consumption was found in Filipino school-aged children. Children in poor environments tended to consume more fish, while children in middle-income and rich households consumed more milk and protein-containing foods [47]. Likewise, in our study, there was equitable fish consumption between the poorest and wealthiest families, which is an encouraging sign for improving child dietary diversity in Cambodia, Indonesia, and Myanmar, given most of the other protein-rich sources were consumed more frequently in the wealthiest groups.
Strengths and limitations
Most studies regarding dietary quality among young children have used the MDD or composite measures, however, only a few studies examined the socio-economic association with the individual food groups or items [48]. The present study took an additional step forward, exploring four types of fruits and vegetable groups and separating flesh food into meat and fish groups. There are a few limitations. First, equity gaps generated in this study did not take a procedure of adjusting covariates such as maternal education level and child’s sex, age, or health status. Our analytic approach was to present consistent results since the equiplots have no function for adjusting the covariates when generating the plots [10]. Second, we did not provide the underlying reasons for the gap by wealth quintile or by residence. Such reasons would include the difference in household income, efficiency and diversity of food systems, market access, food culture and taboos, and geographical area. Third, this study included only eight countries into the analysis. Other countries in South Asia and Southeast Asia were not included due to no available DHS data. Thus, this limited analysis weakens the regional representativeness of our study.
Recommendation for policy and practices
We delineated how ten food items were consumed unequally among socio-economically different groups. The evidence from this study provides useful and practical information about which food groups have a high potential for increased consumption and which food items are most challenging to promote through policy and maternal and child nutrition programs in the Asia Pacific context.
Although the MDD indicator does not distinguish vitamin A-rich vegetables from interchangeable foods, approaches that can increase the utilization of alternate food sources are recommended for vitamin A-rich fruits and vegetables. Mothers and health providers need to be informed of how they can interchangeably consume DGLV, vitamin A-rich fruits, and vitamin A-rich vegetables. We need to consider various communication channels to promote behavior change among caregivers. Approaches at the policy level are requested to increase the affordability of vitamin A-rich fruits and vegetables among children in poorer populations through social protection and safety net programs.
Dairy foods showed diverse consumption but also revealed the largest equity gaps of the 10 food items in eight countries. Nutrition-sensitive programs involving agriculture approaches should take advantage of livestock to increase dairy products in South Asia [39]. In contrast, fish can be highly recommended as a protein-rich food source in South Asia and Bangladesh. Policymakers in the region can add a guideline to introduce fish at an early age. Fish was not introduced at an early age of 6 months, which is also consistent with other studies by Thorn-Lyman [49]. Promoting low-cost food consumption, such as fish, can be an effective strategy to improve dietary quality and reduce inequity in the Southeast region.
For eggs, which showed a large equity gap, without an alternate food source, a macro approach to support poor households is needed. Eggs contain protein and many micronutrients necessary for child development and growth [50]. The government could consider a food voucher program for the poorest quintile to purchase eggs or an asset transfer program to provide poultry. Nutrition education, social marketing, or counseling have been associated with increasing the quantity of eggs in young children's diets [51]. In some Asian cultures, challenges such as cultural taboo of animal products or unaffordability of eggs remain unaddressed [51].
This study descriptively examined the trends in food consumption by wealth and geographical area. It is expected that future studies will further explain underlying reasons for the gap by wealth quintile or by residence, categorized by the differences in household income, efficiency and diversity of food systems, market access, and food culture and taboos.
 XML Download