

 PDF
PDF Citation
 Print
Print


INTRODUCTION
According to the data released by the Korea Disease Control and Prevention Agency, 34.6% of Korean adolescents skipped breakfast in 2016 [1]. An American study reported that 31.5% of adolescents had breakfast skippers [23]. Skipping breakfast is an unresolved problem not only in Korea but also in other countries.
Skipping breakfast leads to overeating of snacks or the next meal, and the absorption of excess glucose increases the likelihood of cardiovascular disease and obesity due to increase in fat synthesis in the liver [4]. Smith et al. [5] reported that when breakfast was skipped frequently, there was an increase in snack consumption, meal eating speed, waist circumference, body weight, postprandial blood glucose levels, blood pressure, and cholesterol levels, and risk of metabolic syndrome. Júnior et al. [6] reported an inverse correlation between the frequency of breakfast intake and blood glucose, triglyceride, and low-density lipoprotein (LDL) cholesterol levels in sedentary obese adolescents. More than 50 cross-sectional studies have reported consistent positive correlations between breakfast omission and increased risk of obesity in Europe and the United States, and a meta-analysis of 19 cross-sectional studies in Asian populations showed an increased risk of overweight and obesity among breakfast skippers versus breakfast consumers [7].
Diabetes is a serious health problem, and the associated complications lead to the development of chronic diseases in adulthood; therefore, it is important to prevent diabetes in adolescence. Metabolomics has been used in the last decades to understand the relationship between pathophysiological mechanisms and diseases [89], and several studies have been conducted to contribute to the prevention and treatment of diabetes through studies on the relationship between diabetes and metabolites [101112]. In particular, aromatic amino acids (phenylalanine, tyrosine, and tryptophan) have been reported to be associated with the risk of future diabetes [1113]. Metabolomics in the study of diabetes is an important way to identify and prevent factors affecting diabetes.
Although the positive effects of the Korean diet have been reported in several previous studies [141516], the preference for the traditional Korean diet pattern that is based on rice has declined among adolescents while the preference for dietary patterns based on noodles, bread, and meat has significantly increased [17]. Several studies have reported that the increase in preference for Western diets and the decrease in Korean diet preferences are associated with the prevalence of lifestyle diseases such as obesity and diabetes [18192021].
Therefore, this study aimed to investigate whether rice-based breakfast compared to wheat-based breakfast, which has a high-preference for adolescents, has positive effects on the glycemic index in Korean adolescents who skip breakfast, as well as whether it is effective in preventing diabetes.
SUBJECTS AND METHODS
Subjects and study design
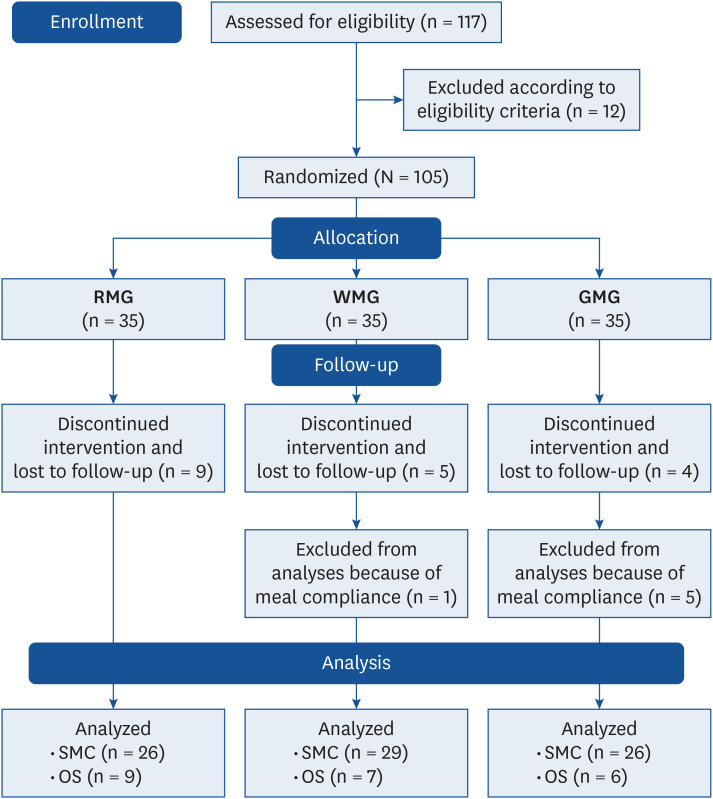
This study used an open-label, randomized, parallel-group comparative design (Fig. 1). The subjects were assigned to the rice-meal group (RMG; n = 35), wheat-meal group (WMG; n = 35), or general-meal group (GMG; n = 35) in the same ratio through a random assignment method, using a randomly assigned table on a computer. All subjects assigned to each diet group visited the clinical research unit (Clinical Trial Center for Functional Foods of Jeonbuk National University Hospital, Jeonju, Korea). This study was conducted under the review of and with approval (JBNU_IRB 2018-11-010-004) from the Institutional Review Board of Jeonbuk National University. This study was conducted in accordance with the Declaration of Helsinki. This clinical trial was registered at the Clinical Research Information Service of the Republic of Korea (https://cris.nih.go.kr/cris/en/: board approval number: KCT0004089), and the study was carried out for 12 weeks from April to July 2019. A screening test was conducted among 117 healthy boys and girls (12–18 years) who volunteered to participate in the study and provided written informed consent. Among them, 105 met the inclusion criteria. The criteria for inclusion and exclusion of participants in this study are described below.
Exclusion criteria
The exclusion criteria for this study were 1) drunken more than 1 bottle of soju or had smoked a pack of cigarettes within one month from the baseline, 2) taken health functional foods or medicines for adolescent health factors more than 5 times a week within one month from the baseline, etc.
Subjects in RMG (n = 35) and WMG (n = 35) ate rice-based meal and wheat-based meal, respectively, during weekdays (except holidays) for a 12-week period at a designated place in their school; subjects in GMG (n = 35) maintained their usual eating habits, and they were not provided any special diet for the same 12-week period. Eighty-one subjects were finally included for analysis, except for those who had dropped out owing difficulty in eating the test diet and difficulty in writing the dietary record and those who did not comply with meal intake at the end of the study.
Dietary intervention
The intervention diets met 1/3 of the daily-recommended intake requirements in consideration of age and sex, based on the 2015 Korean Dietary Reference Intake (Korean Nutrition Society, Seoul, Korea). To reflect the characteristics of rice-based and wheat-based meals, the rice-based meal was composed of Korean food and the wheat-based meal was composed of Western-style food. The rice-based menu consisted of rice, Korean-style soup, one main dish, two side dishes, kimchi, fruit, and dairy products. The wheat-based meal consisted of bread with a main dish, soup, two side dishes, fruit, and dairy products (Supplementary Tables 1 and 2). The total calories in both meals were the same. Meals were delivered in the form of a meal box and prepared as a 4-week cycle menu. We calculated meal compliance by dividing the number of meals eaten by the total number of meals served.
Subject compliance
To minimize the effects of lifestyle changes on the test results, we recommended that the subjects eat only the test diet provided in the morning during the study and that they maintain the same food intake habit (except breakfast) and physical activity level as those maintained before the study. We evaluated dietary compliance and physical activity during the study period. Meal compliance was calculated from the total number of meals served and the total number of meals consumed and set to 80% or more. The subjects recorded their daily dietary intakes in detail on a dietary record and were monitored for drug use, self-reported symptoms or side effects, changes in physical activity, lifestyle habits, and suitability of their diet.
Anthropometric measures and biochemical analysis
Anthropometric parameters (weight, height, and body mass index [BMI]) were measured using Inbody 720 (BioSPACE Co., Seoul, Korea) at each visit. We measured waist circumference and hip circumference using a tape measure and were expressed in centimeters, rounded to three times to the first decimal place. The waist-to-hip circumference ratio was calculated by dividing the waist circumference by the hip circumference.
After a 12 h fast, the blood samples were collected from the cubital vein in ethylenediaminetetraacetic acid-coated tubes. Blood samples were centrifuged at 3,000 rpm for 20 min (Hanil Science Industrial Co. Ltd., Seoul, Korea) and stored frozen at -80°C until the analysis. A Hitachi 7600-110 analyzer (Hitachi High-Technologies, Tokyo, Japan) was used to analyze blood glucose and homeostasis model assessment of insulin resistance (HOMA-IR) was performed [24].
Global metabolomics analysis using ultra-performance liquid chromatography (UPLC)-MS/MS
Plasma 100 µL was added to cold methanol (200 µL) to precipitate the protein from the plasma. After shaking for 30 min at 4°C, the samples were centrifuged (9,000 ×g for 10 min at 4°C); the supernatant was collected and dissolved in 20% aqueous methanol. Extracts were analyzed using the ACQUITY UPLC system (Waters, Milford, MA, USA) coupled to an UPLC quadrupole time-of-flight mass spectrometry (UPLC-Q-TOF) system (Waters Corp., Manchester, UK). For sample separation in UPLC, an ACQUITY UPLC BEH C18 (2.1 × 100 mm, 1.7 µm) column with a flow rate of 0.3 mL/min and a column temperature of 30°C was used. The mobile phase was composed of (A) 0.1% formic acid aqueous solution and (B) 0.1% formic acid in acetonitrile, at an injection volume of 5 µL. The UPLC conditions were as follows: initial condition of 98% A, 0–13 min with 98–5% A, and 13–14 min with 5% A and returning to 98% A for a 2 min re-equilibration step. We used the Waters SYNAPT G2-Si mass spectrometer in the electrospray ionization (ESI) mode. The ESI source was used in positive and negative modes, with a scan range of m/z 50–1,000. The capillary voltage was 3 kV, cone voltage was 30 V, and collision energy ramp was 15–45 V. The gas flow for desolvation and cone were 800 and 50 L/h, respectively. The source temperature and desolvation gas temperature were 110°C and 350°C, respectively. The raw data were processed by alignment, normalization, and peak picking using Progenesis QI software (Nonlinear Dynamic, Newcastle, UK).
Investigation of dietary intake and physical activity
Dietary intake was analyzed by a registered dietitian using CAN-pro 5.0 (Korean Nutrition Society). A 3-day dietary record that included two weekdays and one weekend day at the baseline and endpoint was used to confirm nutrient intake. The Global Physical Activity Questionnaire was used to measure physical activity at baseline and at the endpoint [25].
Sample size and statistical analysis
A sample size was calculated using the mean and SD of body fat loss measured in a previous study's intervention and control groups [26]. This was assumed to be required for a clinically relevant difference among the three groups at an alpha set at 5% and a power of 80%. This resulted in a required number of 28 subjects in each group considering the 20% dropout rate, 105 subjects were enrolled in this study [27]. This study analyzed the blood glucose index of the subjects with suitable dietary compliance in the previous study that proved the effects on health-related factors of the rice-based breakfast in ITT subjects [28].
Data are expressed as mean and standard deviation. Shapiro–Wilk test was performed to confirm a normality. Baseline differences in general information, anthropometric, blood glucose measures between the three groups were analyzed using 1-way analysis of variance (ANOVA) or Kruskal-Wallis test.
Primary analysis was conducted in subjects with suitable meal compliance (SMC) [28], and secondary analysis was performed in the overweight and obese groups in the SMC group (RMG = 9, WMG = 7, GMG = 6). Continuous data was analyzed to evaluate Two-way repeated–measure ANOVA (time-group interaction) and a Greenhouse-Geisser correction was for sphericity. Multiple linear regression analysis was performed to analyze the relationship between breakfast intake, blood glucose-related index and metabolites. Nutrient intake was analyzed by analysis of covariance by adjusting for age, sex, and school type with the Bonferroni post hoc test. The assumption of normality and equal variance were confirmed on the residuals and multicollinearity was analyzed by calculating the tolerance and variance inflation factor. Intragroup analysis was performed using paired t-test or Wilcoxon signed-rank test, and categorical variables were analyzed using the χ2 test. Statistical significance was set at P < 0.05. SPSS version 18.0 (SPSS, Inc., Chicago, IL, USA) was used for the statistical analysis.
RESULTS
Baseline characteristics of subjects
The baseline characteristics in the 3 groups are shown in Table 1. The distribution of age, sex, and school of subjects in RMG, WMG, and GMG were not significant. There was no significant difference in the baseline values among the three groups. Additionally, other anthropometric measurements and physical activity among the three groups were not significantly different.
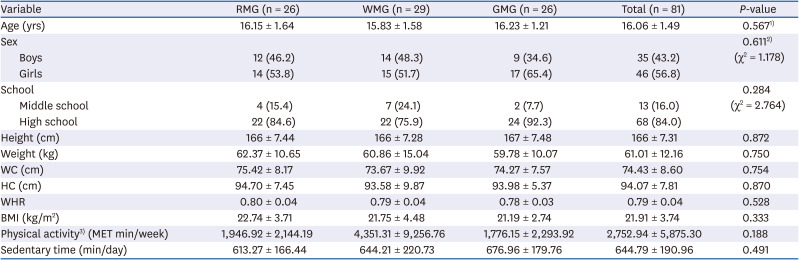
Table 1
Baseline general characteristics of the subjects
Data are presented as mean ± SD or number (%).
RMG, rice meal group; WMG, wheat meal group; GMG, general meal group; WC, waist circumference; HC, hip circumference; BMI, body mass index; MET, metabolic equivalent task.
1)Different between the three groups at α = 0.05 by analysis of variance for normally distributed continuous variables.
2)Different between three groups at α = 0.05 by χ2 test in categorical variables.
3)There is not significant among three group at end-point.
![]()
Anthropometric measurements
The results of anthropometric measurements of the subjects are presented in Table 2. The mean body weight in the RMG was not significantly different after the intervention compared to baseline, but the mean body weight in the WMG and GMG significantly increased after the intervention (P < 0.05 and P < 0.05, respectively). Moreover, BMI and body fat mass among the three groups differed significantly by time × group interaction (P < 0.05 and P < 0.05, respectively). Lean body mass significantly increased in the RMG and WMG participants at the endpoint compared to baseline (P < 0.01 and P < 0.01, respectively).
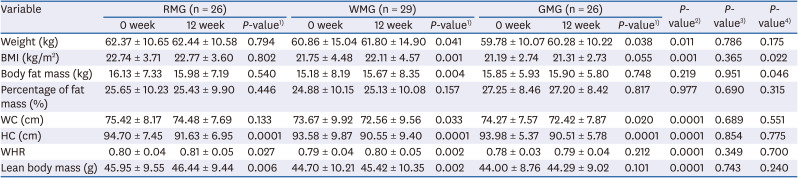
Table 2
Anthropometric measurements of the subjects
Data shown mean ± SD.
RMG, rice meal group; WMG, wheat meal group; GMG, general meal group; BMI, body mass index; WC, waist circumference; HC, hip circumference; WHR, waist to hip ratio.
1)Analyzed by paired t-test between 0 week and 12 week.
2-4)Time effect, group effect, time × group interaction of 2-way RM analysis of variance by bonferroni' post hoc.
![]()
Blood glucose index and blood glucose-related metabolites
The blood glucose indices are shown in Table 3. Hemoglobin A1c levels were significantly decreased after the intervention in the three groups compared to baseline (P < 0.01, P < 0.01, and P < 0.01, respectively). However, the levels of fasting insulin and HOMA-IR were significantly decreased at the endpoint compared to baseline in the RMG (P < 0.05, P < 0.05, respectively). The results of the metabolites related to blood glucose levels in the subjects are shown in Table 4. The mean level of LPC 16:1 in the WMG was not significantly affected, whereas that in the RMG showed a significant increase (P < 0.05). Table 5 and Fig. 2 show the blood glucose index results of the overweight and obese subjects. For overweight and obese subjects, the WMG had significantly increased blood glucose levels compared to the GMG subjects (P < 0.01). As shown in Fig. 3, the levels of aromatic amino acids (phenylalanine, tryptophan, and tyrosine) were significantly higher at the endpoint compared to baseline in the GMG group (P < 0.01, P < 0.0001, and P < 0.0001, respectively). Moreover, the levels of tryptophan and tyrosine were significantly higher at the endpoint compared to baseline in the WMG group (P < 0.01 and P < 0.05, respectively). Furthermore, for overweight and obese subjects, the levels of phenylalanine were significantly higher in the WMG group (P < 0.05), and the levels of tyrosine were significantly higher in the GMG group (P < 0.05).
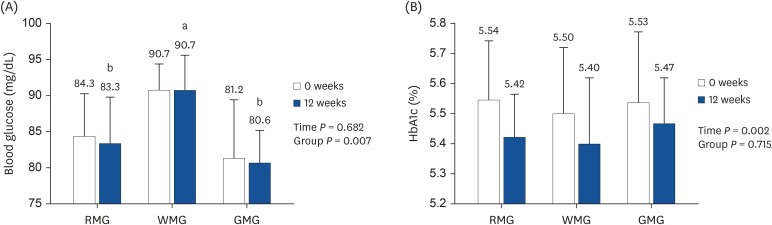
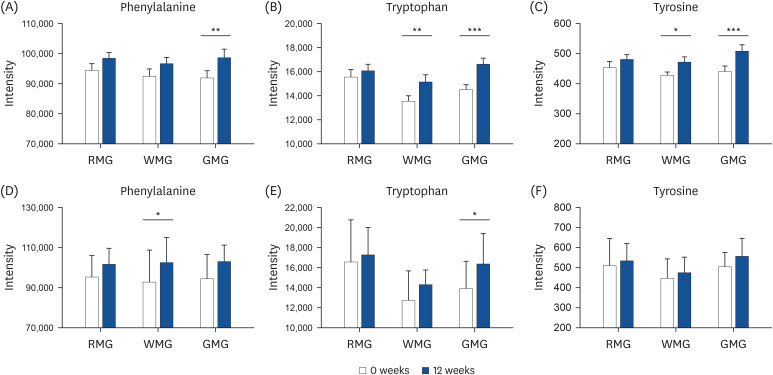
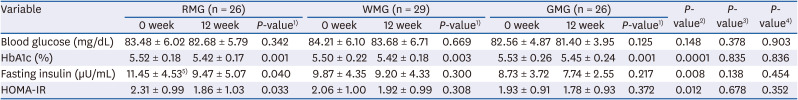
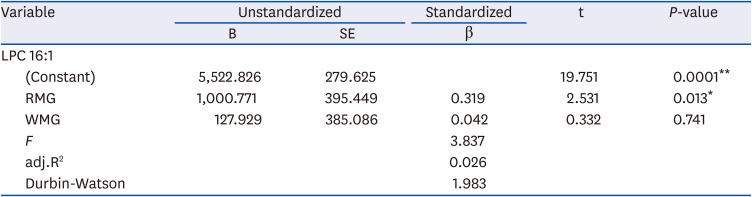
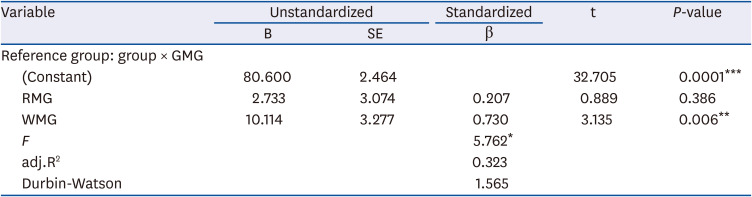
Fig. 2
Blood glucose index of overweight and obese subjects. (A) The blood glucose (mg/dL) was analyzed by 2-way RM ANOVA; (B) HbA1c was analyzed by 2-way RM ANOVA. RMG group (n = 9), WMG group (n = 7), GMG group (n = 6).
RMG, rice meal group; WMG, wheat meal group; GMG, general meal group; ANOVA, analysis of variance; HbA1c, hemoglobin A1c.
Different letters indicate bonferroni's post hoc after time effect, group effect, time × group and interaction of 2-way RM ANOVA analysis. There is no significant different in time × group interaction.
![]()
Fig. 3
Analysis of metabolites of aromatic amino acids related to blood glucose index in the subjects. (A-C) The results in the SMC group, RMG group (n = 26), WMG group (n = 29), GMG group (n = 26). (D-F) The results of overweight and obese subjects, RMG group (n = 9), WMG group (n = 7), GMG group (n = 6).
RMG, rice meal group; WMG, wheat meal group; GMG, general meal group; SMC, subjects with suitable meal compliance.
*P < 0.05, **P < 0.01, ***P < 0.001; statistically significant by paired t-test analysis.
![]()
Table 3
Blood glucose index of the subjects
Data shown mean ± SD.
RMG, rice meal group; WMG, wheat meal group; GMG, general meal group; HbA1c, hemoglobin A1c; HOMA-IR, homeostasis model assessment of insulin resistance.
1)Analyzed by paired t-test between 0 week and 12 week.
2-4)Time, group, time × group interaction effect of 2-way RM analysis of variance.
5)
P < 0.05 analyzed by independent t-test between RMG group and GMG group.
![]()
Table 4
The effect of breakfast intake on metabolites compared to breakfast skipping in the subjects1)
B, unstandardized coefficient; LPC, lysophosphatidylcholine; RMG, rice meal group; WMG; wheat meal group; GMG, general meal group.
1) Reference group: group × GMG, RMG group (n = 26), WMG group (n = 29), GMG group (n = 26).
*P < 0.05, **P < 0.0001; statistically significant by multiple linear regression analysis.
![]()
Table 5
The effect of breakfast intake on blood glucose compared to breakfast skipping in overweight and obese subjects1)
B, unstandardized coefficient; RMG, rice meal group; WMG; wheat meal group; GMG, general meal group;.
1)RMG group (n = 9), WMG group (n = 7), GMG group (n = 6).
*P < 0.05, **P < 0.01, ***P < 0.001; statistically significant by multiple linear regression analysis.
![]()
DISCUSSION
The purpose of this study was to determine whether rice-based breakfast intake had an effect on glycemic control and, in particular, on reducing the prevalence of diabetes in breakfast skipping adolescents. Presently, Korean youths prefer wheat-based meals, such as noodles, bread, and hamburgers, rather than Korean-style meals [20]. Therefore, we used two types of rice-based diets and wheat-based diets as clinical trial diets and confirmed their effect on blood glucose-related factors in adolescents who skipped breakfast.
In this study, only the WMG group had a significant increase in energy intake at the end of the study when compared to baseline, while the RMG and GMG groups had no significant differences. According to several previous studies, skipping breakfast suggests that eating a snack or overeating the next meal leads to a high possibility of being overweight and obese [45]. Timlin et al. [29] conducted a study among 2,216 adolescents and investigated the frequency of breakfast intake and weight change over 5 years; the frequency of breakfast intake showed an inverse correlation with weight change. In this study, body weight, body fat mass, and BMI increased in wheat-based breakfast intake group increased significantly, but there were no significant in the rice-based breakfast intake group. Esmaillzadeh et al. [30] reported in a study related to dietary pattern and metabolic syndrome that BMI and obesity rates were significantly higher as Western diet intake increased. Unfortunately, only the WMG group showed a significant increase in energy intake thereafter compared to before, as a consequence of assessing the nutritional intake of the subjects in this study. This is considered to be due to the high preference for wheat-based meals among adolescents as mentioned above, and the possibility of underestimating and overestimating of the subjects' dietary intake survey in this study [3132].
Diabetes mellitus does not occur specifically in adults, but it is accounts for a large proportion of many lifestyle diseases, including in adolescents. The levels of blood glucose, insulin, and HOMA-IR are known to be predictive factors for pre-diabetes or type 2 diabetes in adolescents and adults [333435]. In this study, the RMG group had a positive effect on improving fasting insulin and HOMA-IR levels in adolescents who habitually skipped breakfast. Moreover, the mean blood glucose level in overweight and obese adolescents increased in the WMG group compared to the skipping breakfast group. Several previous studies have shown an effect of eating breakfast on improving blood glucose levels in overweight and obese adolescents [636]. In particular, previous studies have found a link between white rice consumption and the development of type 2 diabetes [2137], and Kimchi extract was found to have anti-obesity and antidiabetic properties [21383940]. Moreover, Choi et al. [21] found that the Korean diet lowers blood glucose levels by increasing glucose utilization and improving insulin sensitivity. This was because the Korean diet restored insulin secretion in pancreatic beta cells after islet hypertrophy caused by a high-fat diet [21]. Furthermore, Western-style diets, such as cereals, are primarily highly processed foods that are low in dietary fiber and high in starch [41]. Esmaillzadeh et al. [30] found that the low glycemic index of the rice-based Korean diet, combined with the slow digestion and absorption of viscose fiber found in vegetable side dishes that are eaten together, was observed to lower insulin demand. Taken together, rice-based breakfast intake in adolescence is a factor that can prevent diabetes, which can occur during this developmental period.
Another study of more than 9,000 Finnish men, an increase in blood glucose levels was associated with an increase in the levels of six amino acids (alanine, leucine, isoleucine, valine, tyrosine, and phenylalanine) and a decrease in histamine and glutamine levels [1042]. Moreover, Butte et al. [43] reported that the levels of polar and non-polar amino acids (glutamine, lysine, phenylalanine, and tyrosine) increased in obese children. Many previous studies revealed that aromatic amino acids such as phenylalanine and tyrosine were also associated with insulin resistance [13444546]. Phenylalanine, tryptophan, and tyrosine levels increased in the GMG group at the endpoint compared to baseline, and tryptophan and tyrosine levels increased in the WMG group after the intervention in this study. This shows that breakfast intake in adolescents is important to prevent diabetes, and a wheat-based breakfast might be a diet that could increase the prevalence of diabetes in this developmental period.
LPCs are derived from phosphatidylcholines during LDL oxidation [47], and LPCs have been reported to be involved in cell proliferation, tumor cell invasion, and inflammation, etc. [48]. Several studies have shown that plasma LPC levels decrease in individuals with impaired glucose tolerance [49] and in a steatohepatitis mouse model [50]. Yea et al. [48] found that LPC activates glucose uptake and effectively lowers blood glucose levels in mouse models of type 1 and type 2 diabetes. In this study, LPC16:1 was significantly higher in the RMG group than in the GMG group. This suggests that adolescents may be effective in controlling blood glucose and preventing diabetes by increasing LPCs, which can stimulate blood glucose uptake by eating rice-based meals for breakfast.
This study had several limitations. First, macro-nutrient intakes were not significantly different among the three groups (Supplementary Table 3), and this was found to be the effect of underestimation and overestimation due to the self-recording of diets by the subjects during the study. Second, among the study subjects who participated in this study, the number of dropouts in the WMG group was slightly lower than that in the RMG group. This proves that Korean adolescents prefer Western food to Korean food. However, this study is of great significance in that it aimed to improve the blood glucose indices through rice-based breakfast intake in Korean adolescents who skip breakfast. In addition, it showed the possibility that a wheat-based breakfast could increase the prevalence of diabetes in Korean adolescents who skip breakfast. In particular, overweight and obese subjects were selected, and their correlation with obesity-related diabetes predictor metabolites was confirmed. Finally, it is meaningful to provide scientific data on the importance of breakfast intake in adolescents, and a study on the development of balanced rice-based meals for adolescents who do not have sufficient time to eat breakfast is necessary.
In conclusion, breakfast intake of a rice-based Korean diet was found to be a meal pattern that can improve glycemic indices in adolescents who skip breakfast in this study. Consequently, there is a pressing need to create and promote a menu that is convenient to consume by boosting the breakfast intake rate of Korean adolescents who have a hectic life and to compose the diet pattern with Korean foods.
 XML Download