Journal List > Cancer Res Treat > v.54(3) > 1516078563

Kim, Hong, Lee, Kwon, Jeong, and Park: Genomic Sequencing for Bladder Urothelial Carcinoma and Its Clinical Implications for Immunotherapy

Abstract

Purpose

This study aimed to explore the genomic and transcriptomic landscape of bladder cancer (BC) and its implication for treatment with an immune checkpoint inhibitor (ICI).

Materials and Methods

We analyzed whole-exome and -transcriptome sequences of tumor samples from 64 BC patients who underwent surgical resection with either transurethral resection or radical cystectomy. For exploratory purposes, programmed death-ligand 1 (PD-L1) expression was evaluated in a subset of patients (n=57) including those treated with ICI (n=8).

Results

We identified frequent molecular dysregulations in chromatin regulatory genes (KDM6A, ARID1A, MLL2, and STAG2) and recurrent copy number alterations. Thirty-five samples (54.7%) were PD-L1–positive (PD-L1 combined positive score ≥ 1) with a significantly higher exonic tumor mutational burden (TMB) compared to PD-L1–negative BC samples (p=0.010). We observed that various immune-responsive pathways, including the PD-L1 signaling pathway, were enriched significantly in PD-L1–positive BCs. Interestingly, genes in the CTLA4 pathway were enriched significantly in PD-L1–positive BC as well. Among eight patients who received ICI, progressive disease was confirmed in one patient, whose tumor had low exonic TMB, negative PD-L1 status, and a relatively colder microenvironment.

Conclusion

Gaining new insights into the molecular landscape of BC will improve treatment strategies. Our analysis suggests a rationale for studying dual checkpoint inhibition against BC.

Introduction

Urothelial bladder cancer (BC) represents a highly heterogeneous disease with regard to natural history, ranging from non–muscle invasive BC (NMIBC), which represents 75% of primary diagnoses and is characterized by frequent recurrence but a low risk of mortality, to muscle invasive BC (MIBC), which requires platinum-based chemotherapy followed by radical surgery, to metastatic disease [1]. While platinum-based combination chemotherapy still is the mainstay of treatment, advances in the understanding of the underlying biology have fundamentally changed how to treat BC, and therapeutic options have been expanded to include immune checkpoint inhibitors (ICIs) and molecularly-targeted agents [2].
BC involves frequent mutations [3]. The high tumor mutational burden (TMB) renders it susceptible to ICIs against programmed cell death-1 (PD-1) and its ligand, PD-L1 [4,5]. As a result, ICIs targeting PD-1 or PD-L1 have received approval from the Food and Drug Administration (FDA) for first- and second-line treatment of metastatic BC. Since not all patients respond to ICIs, efforts have been made to identify robust biomarkers for predicting response to ICIs [5], including PD-L1 expression, TMB, molecular subtypes, and gene expression profiling panels. Although development of clinically useful biomarkers remains elusive, recent advances in genomics have added new layers of understanding to the molecular features of BC and their clinical significance [6,7]. Herein, we report clinical sequencing data from 64 BC patients to explore the genomic landscape of BC and its tumor microenvironment (TME). Focusing on a subset of patients who received ICIs, we tried to delineate the biomarkers predicting the therapeutic efficacy of ICIs. This study sought to expand our knowledge about the genomic landscape of BC and to lead us to proper management of this debilitating disease.

Materials and Methods

This study included 64 consecutive BC patients who underwent surgery at Samsung Medical Center (SMC, Seoul, Korea) between October 2019 and December 2020. To be eligible to participate in this study, patients were required to meet the following criteria: (1) histologically confirmed diagnosis of urothelial carcinoma of the bladder, (2) age at least 20 years, (3) understanding of the experimental nature of the study and willing to provide fresh-frozen tissues, and (4) naïve to ICIs directed to PD-1/PD-L1.
We collected tumor tissues and matched blood samples from BC patients who underwent surgical resection with either transurethral resection or radical cystectomy. All tissues were obtained prior to initiation of chemotherapy. Each H&E-stained tissue sample was reviewed by a dedicated genitourinary pathologist (G.Y.K.) to confirm that the tumor specimen was histologically consistent with urothelial carcinoma and to determine the T stage according to the American Joint Committee on Cancer (AJCC) staging system. Tumor DNA and RNA were extracted according to our institution’s standardized methods. At the same time, PD-L1 expression was evaluated as described in our previous study [8]. PD-L1 protein expression was determined using a combined positive score (CPS): the number of PD-L1–stained cells (tumor cells, lymphocytes, and macrophages) divided by the total number of viable tumor cells, multiplied by 100. We defined PD-L1–positive BC as a tumor with a CPS greater than or equal to 1 (CPS ≥ 1). Whole-exome and -transcriptome sequencing and the in-house bioinformatics pipeline are described in the Supplementary Methods.
Patients’ baseline characteristics, treatment courses, and disease status were collected and followed prospectively. If a patient experienced disease recurrence or progression, the date and type were recorded. For exploratory purposes, TMB and PD-L1 expression were evaluated in patients treated with ICIs. All statistical tests were carried out using R ver. 3.6.0 (http://www.r-project.org).

Results

The characteristics of the BC patients included in this study (n=64) are listed in Table 1. The median age was 68 years (range, 40 to 85 years), and men constituted 81% of patients. Tumor samples were obtained from radical cystectomy and transurethral resection in 26 and 38 patients, respectively. Neoadjuvant chemotherapy was administered to 21 patients, whose tumor samples for sequencing were obtained prior to neoadjuvant chemotherapy. As a result, 64% of patients had NMIBC at the time of surgery (i.e., ≤ T1). PD-L1 was positive (i.e., CPS ≥ 1) in 55% of patients. As of the present analysis, 11 patients (17%) had experienced recurrence, and eight patients (13%) had received ICIs in a palliative setting, either in combination with platinum-based chemotherapy (nivolumab, n=2; pembrolizumab, n=1; durvalumab, n=1) or monotherapy (atezolizumab, n=4).

1. Exonic mutational landscape of bladder cancer

Tumor and matched blood samples from 63 patients were analyzed, as one set of tumor sequencing data failed to pass QC. We analyzed whole-exome sequences (WES) of those samples in a unified pipeline (mean sequencing coverages of ~200× for tumor and matched blood samples) and found high-confidence somatic mutations, including 39,612 base substitutions and 679 indels (Fig. 1A). Samples displayed a variable number of somatic mutations, with a mean of 628 (range, 0 to 4,093), slightly fewer than that found in BC studied by The Cancer Genome Atlas (TCGA) (S1A Fig.). MIBC and NMIBC subsets had comparable exonic TMB (p=0.426) (S1B Fig.). In contrast to a recent report that showed no correlation between PD-L1 expression and TMB within most cancer types [9], PD-L1–positive BC (PD-L1 CPS ≥ 1) had significantly higher exonic TMB compared to PD-L1–negative BC (p=0.010) (Fig. 1B).
We identified frequent molecular dysregulations in BC, including recurrent mutations and copy number alteration (CNA), some of which could be potential therapeutic targets (Fig. 1A). We observed partially shared and partially distinct genetic alterations between MIBC and NMIBC, which might underlie different phenotypes in these molecular subtypes. KMD6A was the most frequently mutated gene in both MIBC (n=10, 43.5%) and NMIBC (n=13, 31.7%) cohorts. More than half (13/23, 56.5%) of the KMD6A mutations resulted in protein truncation (S2A Fig.). As noted previously [10], NMIBCs are enriched highly with FGFR3 mutations (9% in MIBC vs. 32% in NMIBC, p=0.044) (S2B Fig.), whereas MIBC were characterized by higher level of TP53 mutations (30% in MIBC vs. 12% in NMIBC) (S2C Fig.). Notably, frameshift insertions in ELF3, a negative regulator of epithelial-mesenchymal transition in BC [11], were observed exclusively among MIBC patients (n=4, 17.3%). ERCC2 is interesting because its mutation has been found in multiple bladder cancer cohorts (S2D Fig.), which have not been associated with other cancer types. ERCC2 is involved in the nucleotide excision repair pathway, and BCs with mutant ERCC2 tend to have higher exonic TMB than those with wild-type ERCC2 (p=0.052) (S3 Fig.).

2. Treatment efficacy of ICIs

Among a total of 64 patients in our BC cohort, eight received ICIs. Partial response (PR) and complete response (CR) were confirmed in 5 and 2 patients, respectively (Fig. 1C). The two cases (SMC17, SMC62) achieved CR after treatment with ICI plus chemotherapy combination. Progressive disease (PD) was observed in one case (SMC14) whose tumor had low exonic TMB and negative PD-L1 status.

3. Putative drivers and enriched oncogenic pathways in bladder cancer

To assess whether any mutations were under positive selection in bladder cancer, we applied the MutSigCV algorithm [3], which identifies genes that are mutated more often than one would expect by chance (Fig. 2A). Chromatin regulatory genes (KDM6A, ARID1A, MLL2, and STAG2) were mutated recurrently in our cohort, as reported previously [6,12], suggesting the potential for therapeutic targeting of chromatin abnormalities. Applying an additional algorithm [13] provides three more putative driver mutations: ERCC2, FGFR3, and PIK3CA. To infer the clonality of these driver mutations, we estimated their variant-allele frequency (VAF) distributions (Fig. 2B). Mutations involving STAG2 and KDM6A had a VAF peak close to 100%, indicating that these mutations were associated with loss-of-heterozygosity. On the other hand, TP53, FGFR3, ARID1A, ERCC2, and PIK3CA genes had mutations with a VAF peak near 50%. Therefore, these mutations appeared to be clonal and to have occurred early during cancer evolution. Mutations in TP53 and FGFR3 nearly were mutually exclusive (p < 0.05) (Fig. 1A, S4A Fig.), indicating that these two mutations define separate pathways at the beginning of BC carcinogenesis. To evaluate enrichment of known oncogenic signaling pathways in BC, we assessed the fraction of affected genes in the pathways derived from TCGA cohorts (Fig. 2C) and found that about 77.8% of BC patients had an impaired RTK-RAS pathway (S5 Fig.); NOTCH (54.0%), PI3K (41.3%), and WNT (34.9%) signaling pathways also were aberrant [14].

4. Recurrent CNAs in bladder cancer

We analyzed recurrent somatic CNAs in BC samples using WES data (Fig. 1A). GISTIC identified 13 amplified and 20 deleted recurrent focal somatic CNAs in MIBC samples (Fig. 2D upper, S6 Table), while eight amplifications and 35 deletions were identified in NMIBC tissue (Fig. 2D lower, S7 Table). These focal regions involved previously reported, as well as some novel, genes altered in BC (S8S11 Table). Notably, a focal amplification at 3p25.2 that contained several genes, including the VHL gene, was found only in MIBC (S8 Table).

5. Mutational processes in bladder cancer

To characterize the mutational processes that generate point mutations in BC, we analyzed mutational signatures for the 63 WESs from BC tissue based on the COSMIC catalog [15]. Most single-nucleotide substitutions were C:G>T:A transition (85.9%; interquartile range [IQR], 43.8% to 54.2%) or C:G>G:C transversion (25.9%; IQR, 14.7% to 34.7%) (S12 Fig.). The mutational spectrums suggest that previously defined mutational signatures of endogenous processes, such as SBS1 (5-methylcytosine deamination), SBS5 (unknown etiology), SBS2, and SBS13 (activity in APOBEC family of cytidine deaminases), were responsible for the somatic single-nucleotide variants (SNVs) of BC (Fig. 2E) (see also COSMIC database [https://cancer.sanger.ac.uk/cosmic/signatures] for the latest mutational signatures). As noted in the landmark studies of TCGA [6,7], the APOBEC signatures (SBS2, SBS13) accounted for 51.5% of all SBSs (Fig. 2E). Expectedly, SBS13 exhibited a significant correlation with the mRNA expression of APOBEC3A/3B (Fig. 2F), and SBS5 showed a positive correlation with smoking history (p < 0.001) (Fig. 2G).

6. Profiling immunogenic pathway activation in bladder cancer using whole-transcriptome sequences

We integrated tumor RNA sequencing (RNA-seq) data from 64 BC patients to characterize the immune microenvironment of BC (Fig. 3A). We performed Gene Set Variation Analysis to screen the most significantly activated or suppressed signaling pathways in PD-L1–positive BC compared to PD-L1-negative BC. Overall, 449 differentially activated pathways were identified: 402 activated gene sets and 47 suppressed gene sets (false discovery rate q-value < 0.05) (Fig. 3A and B). As expected, Gene Set Enrichment Analysis identified the PD-1 signaling pathway as significantly enriched in PD-L1–positive BCs (S13 Fig., upper). Additionally, genes in the CTLA4 pathway were enriched significantly in PD-L1–positive BC (S13 Fig., lower). Intriguingly, these two canonical pathways of the immune checkpoint showed a strong positive correlation with each other in terms of enrichment score (p < 0.001) (Fig. 3C). This result implies the potential therapeutic efficacy of dual checkpoint inhibition targeting these pathways in BC [16,17].
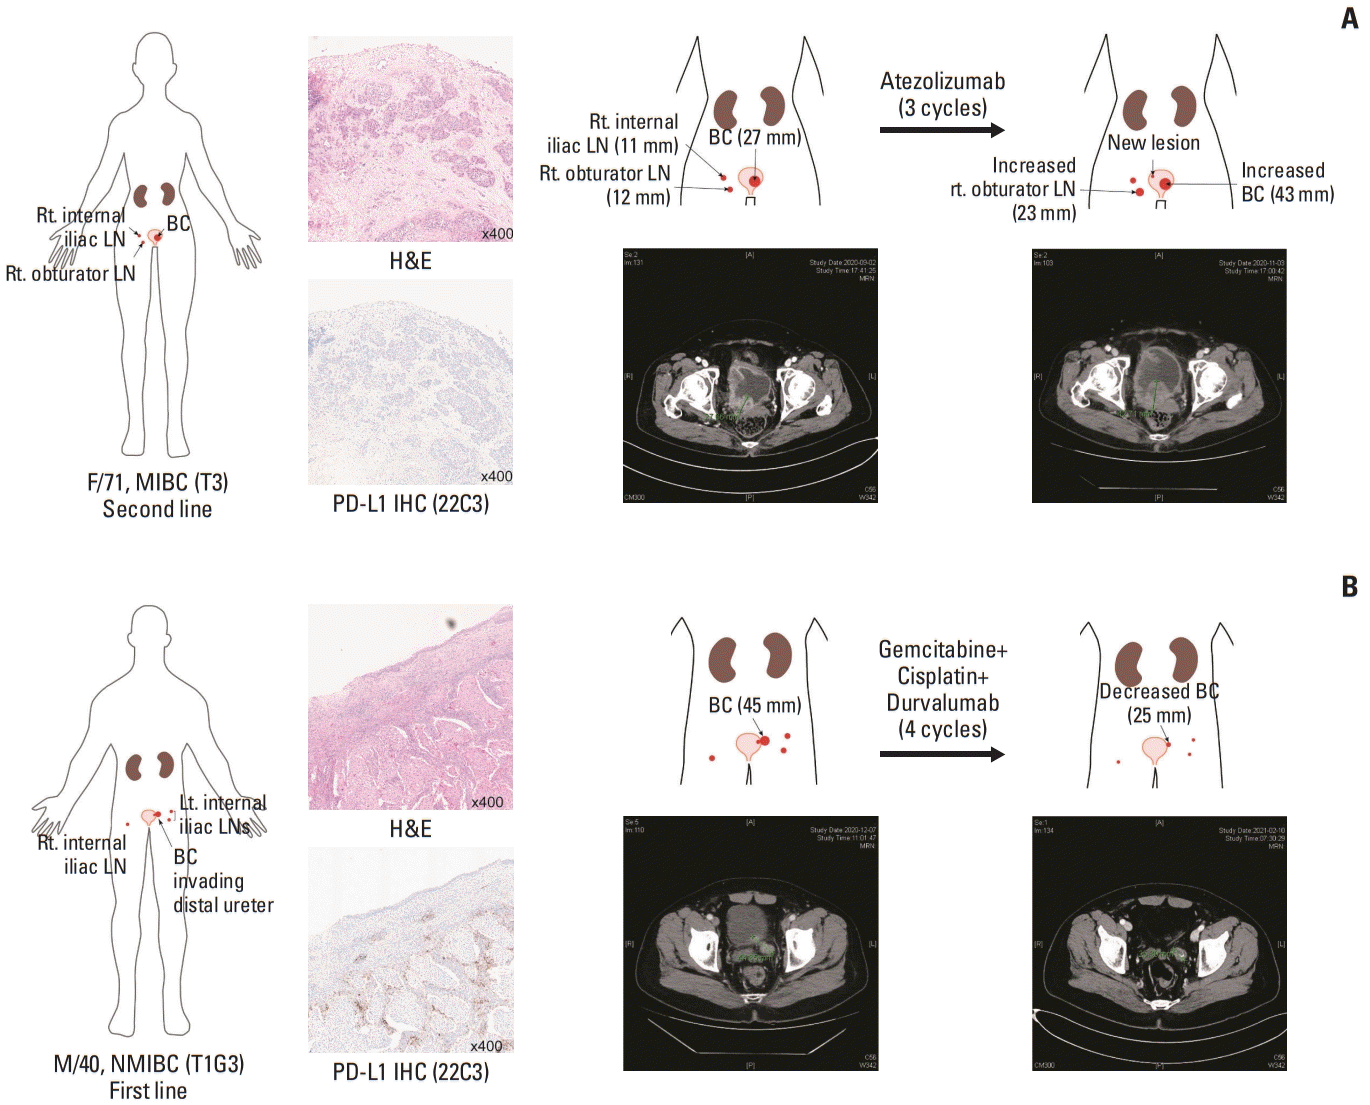
We noted that various pathways involved in the immune response were enriched in PD-L1–positive BCs (Fig. 3A). Averaged enrichment scores of those pathways were significantly higher in PD-L1–positive BC than in PD-L1–negative BC (p < 0.001) (Fig. 3D), which indicates more highly inflamed TME in PD-L1–positive BC than in PD-L1-negative BC. Combining averaged scores with TMB and PD-L1 positivity for each sample in our cohort, we noticed that a patient (SMC14) who experienced PD after ICI treatment had PD-L1–negative BC with relatively lower TMB and colder TME compared to cases that showed PR (Fig. 3E). The patient was a 71-year-old female with PD-L1–negative MIBC (Fig. 4A). Initially, she received neoadjuvant cytotoxic chemotherapy (gemcitabine and cisplatin). However, PD was confirmed after two cycles of treatment. Although she received three cycles of palliative pembrolizumab, metastatic disease at the right obturator lymph node and growth in a primary bladder mass were observed. Also, a new lesion was identified in the left side of the trigone, confirming PD. On the other hand, a 40-year-old male who was initially diagnosed with T1G3 NMIBC presented multiple regional metastatic lymph nodes (Fig. 4B). The primary bladder mass at the left lateral bladder wall and ureteral orifice had positive PD-L1 expression (PD-L1 CPS 1) (Fig. 4B, middle). After four cycles of treatment, all of the lesions dramatically decreased in size to roughly half that of the primary mass.

Discussion

Herein, we report the clinical sequencing data of 64 BC patients to explore the genomic landscape of BC and its implications for immunotherapy. We showed that MIBC had a genomic feature distinct from NMIBC in terms of SNV and copy-number variation. Our analysis showed that more than half of BC cases were PD-L1–positive (CPS ≥ 1). Compared to PD-L1–negative BC, PD-L1–positive BC had a relatively higher exonic TMB and highly inflamed TME, which led to a better response to immunotherapy. Considering a strong correlation between PD1 and cytotoxic T-lymphocyte antigen 4 (CTLA-4) signaling pathways, dual immune checkpoint blockade could be a promising therapeutic approach in BC treatment.
In the era of immunotherapy, understanding carcinogenesis and genomic features will be crucial to forging therapeutic advances and improving treatment outcomes in BC. Recent advances in genomic technologies have added new layers of understanding into the molecular and histopathologic features of BC and examined their significance in clinical utility [7,18,19]. In accordance with our analysis, APOBEC-signature mutagenesis was largely responsible for the overall mutational load of BC [7]. Additionally, transcriptomic analysis revealed several subgroups of BC with different biological processes and clinical outcomes. These implies the peculiar genetic feature of BC, and the importance of comprehensive assessment of genomics, transcriptomics to better understand the biology of BC.
Although there have been efforts to develop PD-L1 expression as a predictive biomarker to select patients for ICIs, controversial results have been obtained, in part because consensus criteria for evaluating PD-L1 as a predictive biomarker have not been settled [5]. An inherent difficulty in assessing PD-L1 status is that subjective scoring of immunohistochemistry sections provides information about only a single factor in the TME and does not consider other features that might more accurately segregate “hot” from “cold” tumors [20,21]. In that regard, whole-transcriptome sequencing might have the ability to delineate more comprehensively an inflamed TME by profiling RNA from multiple cell types within a specimen, which might be more fully representative of the TME. The present analysis indicates that immune expression profiling by whole-transcriptome sequences has the potential to accurately assess the inflammatory status of a tumor by quantifying chemokines, cytokines, and cell surface proteins that can better approximate a “hot” tumor than can PD-L1 expression alone.
Based on the complexity of the immune response to cancer and the mechanism of tumor evasion, it is likely that therapeutic modulation of multiple immune-mediated pathways will be needed to induce maximal tumor regression in a patient with advanced BC. Accordingly, immunotherapy synergy has been an active area of research, with the most rational combination involving blockage of CTLA-4 and PD-1/PD-L1 pathways. CTLA-4 regulates T cells in the lymph nodes early during the immune response and acts primarily on naïve T cells, whereas PD-1 acts on antigen-experienced T cells at the tumor site. Although monotherapy against these immune checkpoints ultimately results in treatment failure for more than half of patients, combination therapy concurrently targeting PD-1/PD-L1 and CTLA-4 immune checkpoints has led to remarkable anti-tumor effects against multiple cancer types, including BC [16,17]. Our analysis suggested that double immune checkpoint blockade against PD-1/PD-L1 and CTLA-4 pathways could enhance the efficacy compared to single-agent PD-1/PD-L1 pathway blockade for unselected patients. In line with our finding, a recently published clinical trial (NCT02516241) reported that tremelimumab (a CTLA-4 inhibitor) have increased activity when combined with durvalumab (a PD-L1 inhibitor) versus durvalumab alone [16]. Further studies are warranted to identify the potential role of double immune checkpoint blockade for urothelial carcinoma.
The present study has limitations. Since only a small number of patients received ICIs, the relevance of biomarkers for predicting response to ICI could not be evaluated thoroughly. In addition, our definitions for PD-L1 positivity and immune scoring were arbitrary. Therefore, one should be cautious when generalizing the results of our analysis. Nevertheless, our study was sufficient to illustrate a peculiar genomic landscape of BC and give insight into the implication of RNA-seq on treatment of BC with immunotherapy.
In conclusion, gaining new insights into the molecular landscape of BC will be critical for therapeutic advances and improved treatment outcomes in BC. Our analysis provides implications for clinical sequencing on the treatment of BC with immunotherapy. We suggest a rationale for studying dual checkpoint inhibition in BC, which warrants further investigation. Hopefully, ongoing studies will expand the current knowledge about the genomic landscape of BC and improve treatment strategies for BC.

Notes

Ethical Statement

The study protocol was approved by the SMC Institutional Review Board (IRB No. 2015-10-062) and was conducted in accordance with the ethical principles of the Declaration of Helsinki. Written informed consent was obtained from all participating patients before surgery.

Author Contributions

Conceived and designed the analysis: Kim R, Hong JY, Lee J, Jeong BC, Park SH.

Collected the data: Kim R, Hong JY, Lee J, Kwon GY, Jeong BC, Park SH.

Contributed data or analysis tools: Kim R, Hong JY, Kwon GY, Jeong BC, Park SH.

Performed the analysis: Kim R, Hong JY, Kwon GY, Jeong BC, Park SH.

Wrote the paper: Kim R, Hong JY, Jeong BC, Park SH.

Conflicts of Interest

Conflict of interest relevant to this article was not reported.

Acknowledgments

The study was supported by Samsung Medical Center (Seoul, Korea) Research Fund (OTA1602441, OTA1702441), a grant of the Korean Health Technology R&D Project through the Korea Health Industry Development Institute (KHIDI), and the Ministry of Health and Welfare, Republic of Korea (grant no.: HR20C0025).

References

1. Witjes JA, Bruins HM, Cathomas R, Comperat EM, Cowan NC, Gakis G, et al. European Association of Urology guidelines on muscle-invasive and metastatic bladder cancer: summary of the 2020 guidelines. Eur Urol. 2021; 79:82–104.
2. Patel VG, Oh WK, Galsky MD. Treatment of muscle-invasive and advanced bladder cancer in 2020. CA Cancer J Clin. 2020; 70:404–23.
crossref
3. Lawrence MS, Stojanov P, Polak P, Kryukov GV, Cibulskis K, Sivachenko A, et al. Mutational heterogeneity in cancer and the search for new cancer-associated genes. Nature. 2013; 499:214–8.
crossref
4. Alexandrov LB, Nik-Zainal S, Wedge DC, Aparicio SA, Behjati S, Biankin AV, et al. Signatures of mutational processes in human cancer. Nature. 2013; 500:415–21.
5. Aggen DH, Drake CG. Biomarkers for immunotherapy in bladder cancer: a moving target. J Immunother Cancer. 2017; 5:94.
crossref
6. Cancer Genome Atlas Research Network. Comprehensive molecular characterization of urothelial bladder carcinoma. Nature. 2014; 507:315–22.
7. Robertson AG, Kim J, Al-Ahmadie H, Bellmunt J, Guo G, Cherniack AD, et al. Comprehensive molecular characterization of muscle-invasive bladder cancer. Cell. 2017; 171:540–56.
8. Kim ST, Cristescu R, Bass AJ, Kim KM, Odegaard JI, Kim K, et al. Comprehensive molecular characterization of clinical responses to PD-1 inhibition in metastatic gastric cancer. Nat Med. 2018; 24:1449–58.
crossref
9. Yarchoan M, Albacker LA, Hopkins AC, Montesion M, Murugesan K, Vithayathil TT, et al. PD-L1 expression and tumor mutational burden are independent biomarkers in most cancers. JCI Insight. 2019; 4:e126908.
crossref
10. Lenis AT, Lec PM, Chamie K, Mshs MD. Bladder cancer: a review. JAMA. 2020; 324:1980–91.
11. Gondkar K, Patel K, Krishnappa S, Patil A, Nair B, Sundaram GM, et al. E74 like ETS transcription factor 3 (ELF3) is a negative regulator of epithelial-mesenchymal transition in bladder carcinoma. Cancer Biomark. 2019; 25:223–32.
crossref
12. Gui Y, Guo G, Huang Y, Hu X, Tang A, Gao S, et al. Frequent mutations of chromatin remodeling genes in transitional cell carcinoma of the bladder. Nat Genet. 2011; 43:875–8.
crossref
13. Tamborero D, Gonzalez-Perez A, Lopez-Bigas N. OncodriveCLUST: exploiting the positional clustering of somatic mutations to identify cancer genes. Bioinformatics. 2013; 29:2238–44.
crossref
14. Sanchez-Vega F, Mina M, Armenia J, Chatila WK, Luna A, La KC, et al. Oncogenic signaling pathways in the Cancer Genome Atlas. Cell. 2018; 173:321–37.
15. Alexandrov LB, Kim J, Haradhvala NJ, Huang MN, Tian Ng AW, Wu Y, et al. The repertoire of mutational signatures in human cancer. Nature. 2020; 578:94–101.
crossref
16. Powles T, van der Heijden MS, Castellano D, Galsky MD, Loriot Y, Petrylak DP, et al. Durvalumab alone and durvalumab plus tremelimumab versus chemotherapy in previously untreated patients with unresectable, locally advanced or metastatic urothelial carcinoma (DANUBE): a randomised, open-label, multicentre, phase 3 trial. Lancet Oncol. 2020; 21:1574–88.
17. van Dijk N, Gil-Jimenez A, Silina K, Hendricksen K, Smit LA, de Feijter JM, et al. Preoperative ipilimumab plus nivolumab in locoregionally advanced urothelial cancer: the NABUCCO trial. Nat Med. 2020; 26:1839–44.
crossref
18. Hedegaard J, Lamy P, Nordentoft I, Algaba F, Hoyer S, Ulhoi BP, et al. Comprehensive transcriptional analysis of early-stage urothelial carcinoma. Cancer Cell. 2016; 30:27–42.
crossref
19. Hurst CD, Alder O, Platt FM, Droop A, Stead LF, Burns JE, et al. Genomic subtypes of non-invasive bladder cancer with distinct metabolic profile and female gender bias in KDM6A mutation frequency. Cancer Cell. 2017; 32:701–15.
crossref
20. Gajewski TF. The next hurdle in cancer immunotherapy: overcoming the non-T-cell-inflamed tumor microenvironment. Semin Oncol. 2015; 42:663–71.
crossref
21. Sweis RF, Spranger S, Bao R, Paner GP, Stadler WM, Steinberg G, et al. Molecular drivers of the non-T-cell-inflamed tumor microenvironment in urothelial bladder cancer. Cancer Immunol Res. 2016; 4:563–8.
crossref

Fig. 1
The landscape of somatic mutations in bladder cancer and therapeutic efficacy of immunotherapy in a subset of patients. (A) Exonic somatic mutational landscape for 63 primary tumors. Top to bottom: synonymous and non-synonymous somatic tumor mutational burden (TMB) in the exome, programmed death-ligand 1 (PD-L1) combined positive score, response to an immune checkpoint inhibitor, sex, smoking history, somatic single-nucleotide variations and indels for 30 most frequently mutated genes, normalized activity of seven mutational signatures, and copy number alterations for significantly amplified (red) or deleted (blue) cytobands with q-value < 0.001 determined by the Genomic Identification of Significant Targets in Cancer (GISTC) algorithm. (B) The differences of exonic TMB between PD-L1–positive and PD-L1–negative muscle-invasive bladder cancer (MIBC) and non-muscle-invasive bladder cancer (NMIBC). The statistical significance of the differences was estimated by the Wilcoxon signed-rank test. (C) The treatment outcome of eight patients who received immunotherapy. (Upper) A bar plot illustrating patient exonic TMB and PD-L1–positivity (+, PD-L1–positive BC; −, PD-L1–negative BC). (Lower) Waterfall plot of responses to immunotherapy in a subset of eight patients. The Samsung Medical Center (SMC) represents each patient’s identification number. The Y-axis represents the percentage of maximum tumor reduction assessed according to Response Evaluation Criteria in Solid Tumor 1.1 criteria. The upper and lower dotted lines represent 20% tumor expansion and 30% tumor reduction, respectively, which define progressive disease (PD) and partial response (PR). Two patients marked with an asterisk (*) had complete response (CR) after treatment with immune checkpoint inhibitor plus chemotherapy combination. CPS, combined positive score; F, female; M, male; N, non-smoker; SBS, single-base substitution; SD, stable disease; SNV, single-nucleotide variant; Y, smoker.
crt-2021-854f1.gif
Fig. 2
Driver mutations, copy number alterations, and mutational signature of bladder cancer. (A) Putative driver mutations in bladder cancer (BC), identified using MutSigCV (upper) and oncodriveCLUST (lower) algorithms. The oncodriveCLUST algorithm is based on enrichment at few specific loci of most variants in cancer-causing genes. This method takes advantage of such a position to identify cancer genes. A scatter plot in the lower panel illustrates the size of the points proportional to the number of clusters found in the gene. The X-axis shows the number of mutations (or fraction of mutations) observed in these clusters. FDR, false discovery rate. (B) The variant-allele frequency (VAF) distribution of the putative driver genes in our cohort. Dots represent a VAF of each driver mutation identified in a sample. The median, first, and third quartiles of the VAF distribution are indicated by a red-colored box. (C) Enrichment of known oncogenic signaling pathways in The Cancer Genome Atlas cohorts. Fractions of the affected pathways are demonstrated on the left, while the fraction of affected samples is shown on the right. (D) A genomic plot with segments highlighting significant amplification (red, above the horizontal line) and deletion (blue, below the horizontal line) regions. The G-score was assigned using the Genomic Identification of Significant Targets in Cancer (GISTIC) algorithm considering the amplitude of the aberration and the frequency of its occurrence across samples. False discovery rate q-values were calculated for the aberrant regions, and regions with a q-value less than 0.10 were considered statistically significant. MIBC, muscle invasive bladder cancer; NMIBC, non–muscle invasive bladder cancer. (E) The signatures of exonic somatic single-base substitutions (SBSs) delineated by COSMIC signatures. (F) The correlation between the proportion of SBS2, SBS3, and the mRNA expression of APOBEC genes. The correlation was estimated by the Pearson correlation coefficient. Statistically significant correlations are annotated by an asterisk (*). (G) The enrichment of each SBS in smokers. We compared the absolute number of SBS attributed to each signature between smokers and non-smokers. The statistical significance was estimated using Student’s t test.
crt-2021-854f2.gif
Fig. 3
mRNA expression of programmed death-ligand 1 (PD-L1)–positive and PD-L1–negative bladder cancer (BC). (A) Heatmap of Gene Set Variation Analysis (GSVA) scores across BC samples. Top to bottom: an unsupervised clustering of samples, combined positive immunohistochemistry scoring of PD-L1, the best response to immunotherapy, a heatmap demonstrating enrichment score-estimated GSVA. Pathways involved in the immune response are annotated on the right. (B) A volcano plot showing differentially activated pathways between PD-L1–positive and PD-L1–negative BCs. (C) The correlations between enrichment score of programmed death-1 (PD-1) (y-axis) signaling and cytotoxic T-lymphocyte antigen 4 (CTLA-4) (x-axis) signaling pathways. (D) Average enrichment score of immune-related pathways in PD-L1–negative and PD-L1–positive BC. (E) A scatter plot simultaneously demonstrating the tumor mutational burden (TMB, x-axis), averaged immune score (x-axis), and PD-L1 positivity (size). Each dot represents a case, with the size of the dot representing PD-L1 positivity. The x-axis and y-axis correspond to the TMB and averaged immune score, respectively. Two patients who experienced complete response (CR) are indicated by an asterisk (*). CPS, combined positive score; PD, progressive disease; PR, partial response; SD, stable disease.
crt-2021-854f3.gif
Fig. 4
Two representative cases of progressive disease and partial response during treatment with immune checkpoint inhibitors. (A) A 71-year-old female (SMC14) had muscle-invasive bladder cancer (MIBC) at the left lateral wall of the bladder. The tumor specimen showed negative programmed death-ligand 1 (PD-L1) staining (middle) and had low tumor mutational burden (Fig. 1C). Initially, the tumor did not respond to two cycles of gemcitabine plus cisplatin. She received three additional cycles of palliative atezolizumab (right). However, the primary mass and metastatic lymph nodes increased in size, and a new lesion was identified at the left side of the trigone. (B) A 40-year-old male (SMC19) with T1G3 bladder cancer (BC) had a primary mass at the left lateral bladder wall and several lymph node (LN) metastases. The primary bladder mass was PD-L1–positive (middle) and responded dramatically to four cycles of durvalumab in combination with gemcitabine and cisplatin. IHC, immunohistochemistry; Lt., left; NMIBC, non–muscle invasive bladder cancer; Rt., right.
crt-2021-854f4.gif
Table 1
Patient characteristics
Characteristic Value (n=64)
Age (yr) 68 (40–85)
Sex
 Male 52 (81)
 Female 12 (19)
Smoking history
 Smoker (ex- or current) 42 (66)
 Non-smoker 13 (20)
 Unknown 9 (14)
Differentiation
 Poorly differentiated 36 (56)
 Moderately differentiated 21 (33)
 Well differentiated 4 (6)
 Not available 3 (5)
T category
 Ta 6 (9)
 Tis 2 (3)
 T1 33 (52)
 T2 15 (23)
 T3 6 (9)
 T4 2 (3)
PD-L1 positivity
 Positive 35 (55)
 Negative 22 (34)
 Unknowna) 7 (11)

Values are presented as median (range) or number (%).

a) The tumor tissues from these patients were too small to perform PD-L1 immunohistochemistry.

TOOLS
Similar articles