Journal List > Nutr Res Pract > v.16(Suppl 1) > 1162213

Bu, Choi, Choi, Jung, Jang, Yang, Kim, and Park: Perspectives on the systematic review for the 2020 Dietary Reference Intakes for Koreans for calcium

Abstract

An accurate assessment of the recommended calcium (Ca) intake may contribute to reducing the risk of fractures and chronic diseases, ultimately improving quality of life. This review was performed to summarize key findings of Ca studies, investigate the effect of Ca intake on health outcomes, and determine the adequacy of evidence to revise the 2015 Dietary Reference Intakes for Koreans (KDRIs) for Ca in 2020. Databases were searched for intervention studies that assessed health outcomes by providing Ca in diets or as supplements. The framework of the systematic review comprised conducting literature searches, data extraction, quality assessment of the literature, and summarizing key findings relevant to set the Estimated Average Requirement (EAR) and Tolerable Upper Intake Level (UL) for Ca for the 2020 KDRI. The final search was performed in June 2019. A total of 13,309 studies were identified through databases and manual search. Sixtyfive studies were included in the final quality assessment and were summarized according to health indicators. As bone health was used as an indicator of the EAR for Ca, literature reports on bone health were further categorized by the life-cycle stage of the participants. This systematic review did not find new evidence that could be applied to the general Korean adult population, including postmenopausal women, for defining a new EAR for Ca in the 2020 KDRIs. Evidence in most of the reviewed literature was considered weak; however, some evidence was found that could improve the criteria on how the EAR for Ca was determined in children and adolescents. A review of the literature for the 2020 KDRIs for Ca did not find strong evidence in order to change the recommended values of the 2015 KDRIs. More clinical interventions are required among Koreans to strengthen the body of evidence to warrant the revision of the KDRIs.

INTRODUCTION

Calcium (Ca) makes up almost 40% of the total mineral mass in the human body. Over 99% of total body Ca is stored in the skeleton and teeth as hydroxyapatite, where it provides structural support [1]. The remaining 1% is freely available in the serum, extracellular fluid, and soft tissues [1]. Serum Ca is tightly regulated, and the body uses bone tissue as a reservoir to maintain constant concentrations of Ca in the serum, muscle, and intercellular fluids [1]. Adequate Ca intake is beneficial to bone health and possibly in the prevention of other chronic diseases, such as obesity, cancer, and cardiovascular disease [2].
The 2015 Dietary Reference Intakes for Koreans (KDRIs) for Ca was based on the effect of adequate intake on bone health owing to the limited number of studies on other health outcomes. In 2015, Ca equilibrium, bone mineral density (BMD), and fracture risk were used as major health indicators in the literature review to establish the Estimated Average Requirement (EAR) for Ca. The EAR and Recommended Nutrient Intake (RNI) for Ca were calculated using the average body size and mean Ca absorption rate of Koreans by the life-cycle stage. However, the reference body weight in some age groups was underestimated. In addition, until the revision of the 2015 KDRIs, the basis for recommendations, such as Ca accumulation during growth and Ca absorption, were mostly based on studies conducted among non-Asians. Therefore, in 2020, we focused on investigating various health outcomes associated with Ca intake and improving the 2020 KDRIs for Ca to better reflect Korean or at least Asian characteristics.
The main questions of the literature review regarding the revision of KDRIs for Ca in 2020 are as follows.
  • 1) Does adequate evidence exist to revise the recommendations for Ca in the 2020 KDRIs?

  • 2) Is there sufficient evidence for the necessary Ca intake through food or supplements related to disease prevention other than bone health indicators?

SEARCH METHODS FOR THE IDENTIFICATION OF STUDIES

Data source and literature search

Electronic databases were systematically searched according to Preferred Reporting Items for the Systematic Reviews and Meta-Analyses (PRISMA) guidelines [3]. Further search of the MEDLINE, EMBASE, and Web of Science, from January 2008 until June 2019 were performed. To search for literature reporting the data from Korean participants, additional searches of the Korean Studies Information Service System (KISS), National Digital Science Library (NDSL), DBpia, and Research Information Sharing Service (RISS) were performed. The search terms, which were based on the EAR and Tolerable Upper Intake Level (UL) for Ca, consisted of the Ca type and its synonyms (“calcium,” “calcium carbonate,” “dietary calcium,” “dairy product,” “calcium citrate,” “calcium phosphates,” “calcium malate”); health outcomes for setting the EAR (“cardiovascular disease,” “hypertension,” “pregnancy related non-skeletal disorders,” “bone health,” “growth,” “cancer,” “obesity,” “type 2 diabetes,” “metabolic syndrome,” “frailty,” “sarcopenia,” “mortality”); and health outcomes for setting the UL (“kidney stones,” “heterotopic and ossification,” “bone health,” “calcinosis,” “hypercalcemia,” “calculus”). The search terms related to the abovementioned outcomes were listed in Supplementary Tables 1 and 2. MESH terms and subject headings were used in coordination with each database’s rules. The same English search terms and additional Korean language terms, related to Ca balance and bone health, were applied to the Korean search engines: KISS; NDSL; DBpia; and RISS. Additionally, relevant Korean journals, including the Journal of Bone Metabolism, Journal of Korean Society of Food Science and Nutrition, and non-DB indexed issues of the Journal of Nutrition and Health, were hand-searched.

Study selection

The inclusion criteria were as follows: (1) studies performed only in healthy participants or participants with hypertension and diabetes mellitus, consisting of less than 20% of the study population (except for studies in adults aged 65 yrs and older); (2) interventions of dairy products, Ca supplements, or Ca and vitamin D supplements; (3) the study design was an intervention, prospective cohort, or nested case-control; and (4) cross-sectional studies and case-control studies in Asians were included due to the limited number of intervention studies in Asians. The following exclusion criteria were applied: (1) animal or cell studies; (2) conventional review paper; (3) meta-analyses; (4) studies in participants where over 20% had a disease; (5) interventions with nutrients other than Ca and vitamin D; (6) interventions where the Ca supplemented group served as control; (7) cross-sectional or case-control studies in non-Asians; (8) non-English or Korean language; and (9) unpublished data (e.g. scientific meeting abstract). Afterwards, duplicate and non-relevant studies were excluded. Abstract screening was performed with Rayyan by 3–4 research staff under the supervision of CYP and KK between 2014–2019, and independently by MJC and SYB between 2008–2013. Full-text evaluation was performed by 3–4 research staff under the supervision of CYP and KK between 2014–2019 and by MJC and SYB between 2008–2013 and disagreements were primarily resolved through discussions among the authors. We could not perform any quantitative data analysis because our search identified only a few studies by distinguished life-cycle stages and was thus inadequate to perform a meta-analysis.

Quality assessment and result summary

Quality assessment tools were applied in the systematic review for exploring scientific basis of the revision of KDRI for Ca depending on the study design, study population, risk of bias, and result consistency. The Strengthening and Reporting of Observational studies in Epidemiology (STROBE) statement [4] was used to assess the quality of cross-sectional studies. For cohort studies including nested case-control and case-control studies, the Newcastle-Ottawa scale [5] was applied. For assessment of intervention studies, the Jadad scale [6] was used. In conjunction with quality assessment, study findings were summarized in a specific table to identify feasible evidence for the revision of the 2020 KDRI for Ca.

RESULTS

Results of the systematic review for establishing the EAR for Ca

From literature published between January 2014 and June 2019, the initial database search identified 13,246 articles. After duplicates were removed, we screened 9,878 articles. The included articles were randomized controlled trials (RCTs), intervention studies, or cross-sectional studies (in Asians only) that provided information on the dose of Ca, dietary Ca intake, and Ca status of the study participants. Fifty-nine publications fulfilled the inclusion criteria for performing the quality assessment. In an additional literature search of the Korean databases and literature published between 2008 and 2013, a total of 63 articles were identified of which 6 articles were subjected to sequential review. A total of 65 studies were included in the review. The study selection process is illustrated in Fig. 1.
Fig. 1

Flow chart of study selection in the systematic review for the 2020 KDRIs for calcium.

KDRI, Dietary Reference Intakes for Korean; KISS, Information Service System; NDSL, National Digital Science Library; RISS, Research Information Sharing Service.
1)The format of the flow chart was adapted from the Preferred Reporting Items for the Systematic Reviews and Meta-Analyses (PRISMA) 2020 statement.
2)Since search terms applied for the 2015 KDRIs (publications years 2008–2013) differ from that for the 2020 KDRIs (publications searched for years 2014–2019), an additional database search was performed for studies published between years 2008 and 2013 to apply the same search terms as 2014–2019 publications for bone health.
nrp-16-S89-g001

Characteristics and main findings of the included studies according to bone health indicators

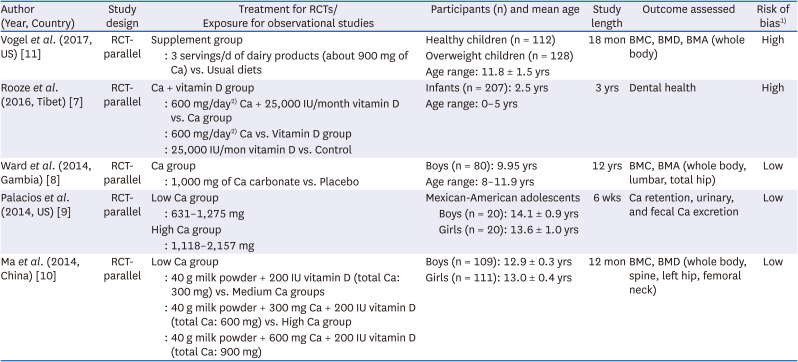
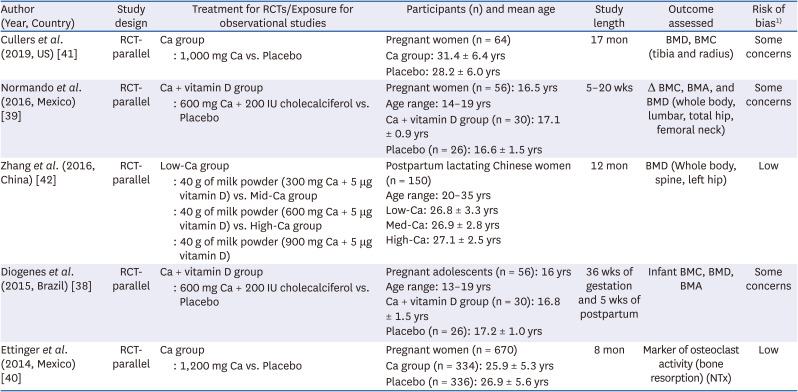
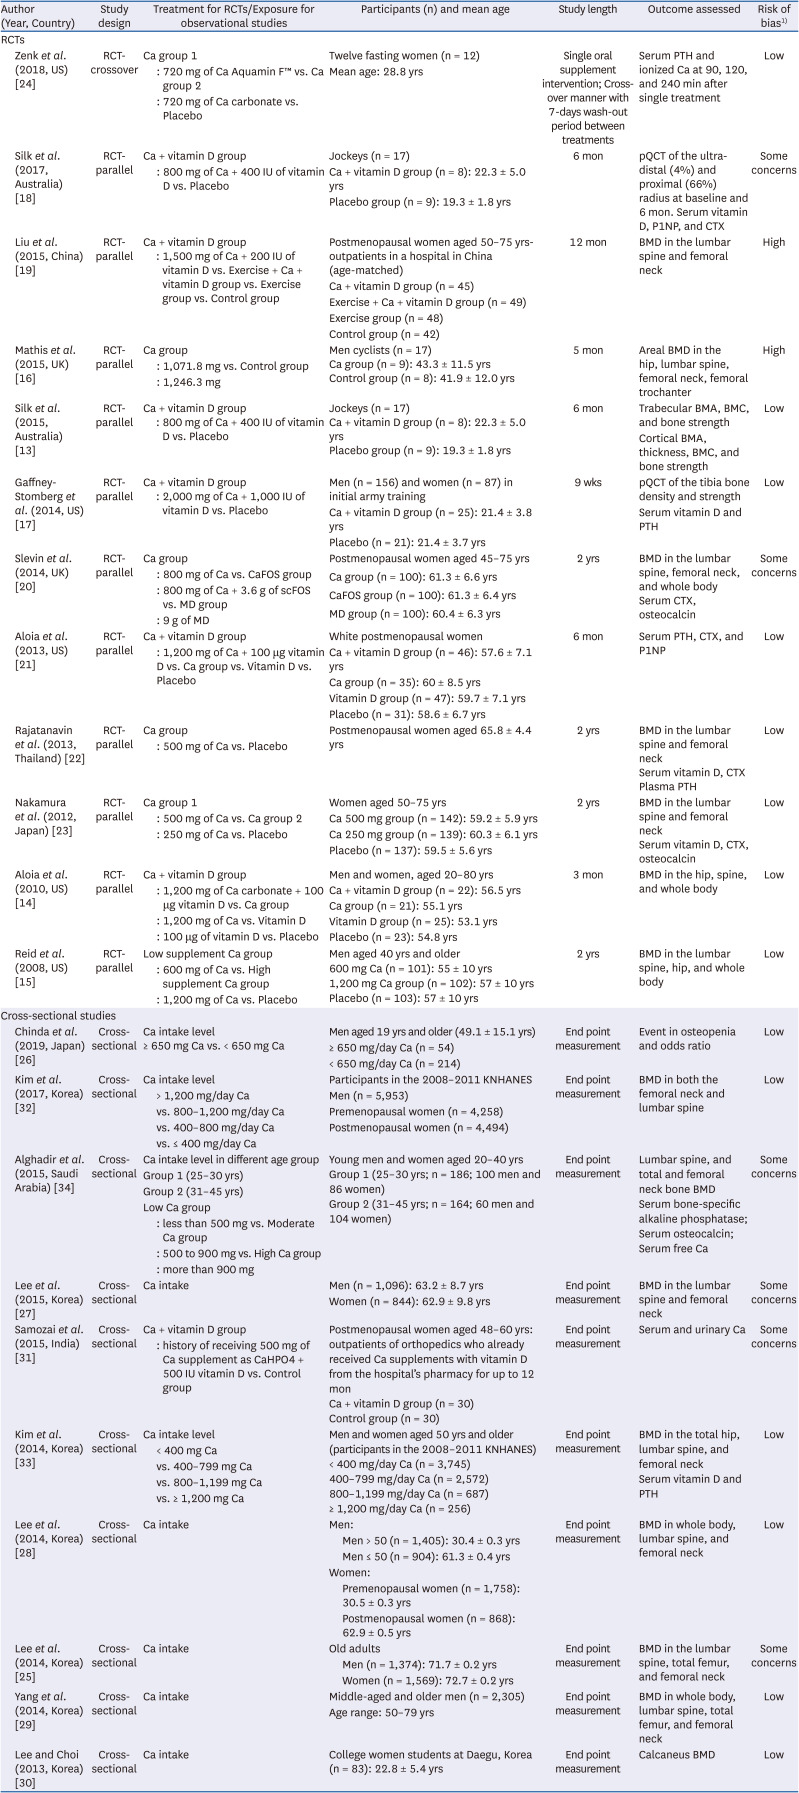
Results of individual studies from the literature assessment have been outlined in Tables 1-3 according to the health indicators for setting the EAR and UL for Ca. For the bone health measurement indicators used in setting the EAR, the results of the literature were further categorized by the life-cycle stage of the participants: infants 0 to 12 mon of age; children and adolescents 1 through 18 yrs of age; and adults including postmenopausal women.
Table 1

Characteristics of the included studies examining the effect of Ca intake (EAR level) on bone health of infants, children, and adolescents aged 0 to 18 yrs (RCTs)

nrp-16-S89-i001
Author (Year, Country) Study design Treatment for RCTs/Exposure for observational studies Participants (n) and mean age Study length Outcome assessed Risk of bias1)
Vogel et al. (2017, US) [11] RCT-parallel Supplement group Healthy children (n = 112) 18 mon BMC, BMD, BMA (whole body) High
: 3 servings/d of dairy products (about 900 mg of Ca) vs. Usual diets Overweight children (n = 128)
Age range: 11.8 ± 1.5 yrs
Rooze et al. (2016, Tibet) [7] RCT-parallel Ca + vitamin D group Infants (n = 207): 2.5 yrs 3 yrs Dental health High
: 600 mg/day2) Ca + 25,000 IU/month vitamin D vs. Ca group Age range: 0–5 yrs
: 600 mg/day2) Ca vs. Vitamin D group
: 25,000 IU/mon vitamin D vs. Control
Ward et al. (2014, Gambia) [8] RCT-parallel Ca group Boys (n = 80): 9.95 yrs 12 yrs BMC, BMA (whole body, lumbar, total hip) Low
: 1,000 mg of Ca carbonate vs. Placebo Age range: 8–11.9 yrs
Palacios et al. (2014, US) [9] RCT-parallel Low Ca group Mexican-American adolescents 6 wks Ca retention, urinary, and fecal Ca excretion Low
: 631–1,275 mg Boys (n = 20): 14.1 ± 0.9 yrs
High Ca group Girls (n = 20): 13.6 ± 1.0 yrs
: 1,118–2,157 mg
Ma et al. (2014, China) [10] RCT-parallel Low Ca group Boys (n = 109): 12.9 ± 0.3 yrs 12 mon BMC, BMD (whole body, spine, left hip, femoral neck) Low
: 40 g milk powder + 200 IU vitamin D (total Ca: 300 mg) vs. Medium Ca groups Girls (n = 111): 13.0 ± 0.4 yrs
: 40 g milk powder + 300 mg Ca + 200 IU vitamin D (total Ca: 600 mg) vs. High Ca group
: 40 g milk powder + 600 mg Ca + 200 IU vitamin D (total Ca: 900 mg)
Ca, calcium; EAR, estimated average requirement; RCT, randomized controlled trial; BMC, bone mineral content; BMA, bone mineral area; BMD, bone mineral density.
1)The quality of each study is assessed on the basis of the study design, and risk of bias assessment is used for RCTs [6].
2)Ca of 15 mmol and vitamin D of 625 μg were given to the study participants. The mmol unit of Ca and μg of vitamin D are converted to mg and IU in the table, respectively.
Table 2

Characteristics of the included studies examining the effect of Ca intake (EAR level) on bone health of adults aged 19 yrs and older

nrp-16-S89-i002
Author (Year, Country) Study design Treatment for RCTs/Exposure for observational studies Participants (n) and mean age Study length Outcome assessed Risk of bias1)
RCTs
Zenk et al. (2018, US) [24] RCT-crossover Ca group 1 Twelve fasting women (n = 12) Single oral supplement intervention; Cross-over manner with 7-days wash-out period between treatments Serum PTH and ionized Ca at 90, 120, and 240 min after single treatment Low
: 720 mg of Ca Aquamin F™ vs. Ca group 2 Mean age: 28.8 yrs
: 720 mg of Ca carbonate vs. Placebo
Silk et al. (2017, Australia) [18] RCT-parallel Ca + vitamin D group Jockeys (n = 17) 6 mon pQCT of the ultra-distal (4%) and proximal (66%) radius at baseline and 6 mon. Serum vitamin D, P1NP, and CTX Some concerns
: 800 mg of Ca + 400 IU of vitamin D vs. Placebo Ca + vitamin D group (n = 8): 22.3 ± 5.0 yrs
Placebo group (n = 9): 19.3 ± 1.8 yrs
Liu et al. (2015, China) [19] RCT-parallel Ca + vitamin D group Postmenopausal women aged 50–75 yrs-outpatients in a hospital in China (age-matched) 12 mon BMD in the lumbar spine and femoral neck High
: 1,500 mg of Ca + 200 IU of vitamin D vs. Exercise + Ca + vitamin D group vs. Exercise group vs. Control group Ca + vitamin D group (n = 45)
Exercise + Ca + vitamin D group (n = 49)
Exercise group (n = 48)
Control group (n = 42)
Mathis et al. (2015, UK) [16] RCT-parallel Ca group Men cyclists (n = 17) 5 mon Areal BMD in the hip, lumbar spine, femoral neck, femoral trochanter High
: 1,071.8 mg vs. Control group Ca group (n = 9): 43.3 ± 11.5 yrs
: 1,246.3 mg Control group (n = 8): 41.9 ± 12.0 yrs
Silk et al. (2015, Australia) [13] RCT-parallel Ca + vitamin D group Jockeys (n = 17) 6 mon Trabecular BMA, BMC, and bone strength Low
: 800 mg of Ca + 400 IU of vitamin D vs. Placebo Ca + vitamin D group (n = 8): 22.3 ± 5.0 yrs Cortical BMA, thickness, BMC, and bone strength
Placebo group (n = 9): 19.3 ± 1.8 yrs
Gaffney-Stomberg et al. (2014, US) [17] RCT-parallel Ca + vitamin D group Men (n = 156) and women (n = 87) in initial army training 9 wks pQCT of the tibia bone density and strength Low
: 2,000 mg of Ca + 1,000 IU of vitamin D vs. Placebo Ca + vitamin D group (n = 25): 21.4 ± 3.8 yrs Serum vitamin D and PTH
Placebo (n = 21): 21.4 ± 3.7 yrs
Slevin et al. (2014, UK) [20] RCT-parallel Ca group Postmenopausal women aged 45–75 yrs 2 yrs BMD in the lumbar spine, femoral neck, and whole body Some concerns
: 800 mg of Ca vs. CaFOS group Ca group (n = 100): 61.3 ± 6.6 yrs Serum CTX, osteocalcin
: 800 mg of Ca + 3.6 g of scFOS vs. MD group CaFOS group (n = 100): 61.3 ± 6.4 yrs
: 9 g of MD MD group (n = 100): 60.4 ± 6.3 yrs
Aloia et al. (2013, US) [21] RCT-parallel Ca + vitamin D group White postmenopausal women 6 mon Serum PTH, CTX, and P1NP Low
: 1,200 mg of Ca + 100 μg vitamin D vs. Ca group vs. Vitamin D vs. Placebo Ca + vitamin D group (n = 46): 57.6 ± 7.1 yrs
Ca group (n = 35): 60 ± 8.5 yrs
Vitamin D group (n = 47): 59.7 ± 7.1 yrs
Placebo (n = 31): 58.6 ± 6.7 yrs
Rajatanavin et al. (2013, Thailand) [22] RCT-parallel Ca group Postmenopausal women aged 65.8 ± 4.4 yrs 2 yrs BMD in the lumbar spine and femoral neck Low
: 500 mg of Ca vs. Placebo Serum vitamin D, CTX
Plasma PTH
Nakamura et al. (2012, Japan) [23] RCT-parallel Ca group 1 Women aged 50–75 yrs 2 yrs BMD in the lumbar spine and femoral neck Low
: 500 mg of Ca vs. Ca group 2 Ca 500 mg group (n = 142): 59.2 ± 5.9 yrs Serum vitamin D, CTX, osteocalcin
: 250 mg of Ca vs. Placebo Ca 250 mg group (n = 139): 60.3 ± 6.1 yrs
Placebo (n = 137): 59.5 ± 5.6 yrs
Aloia et al. (2010, US) [14] RCT-parallel Ca + vitamin D group Men and women, aged 20–80 yrs 3 mon BMD in the hip, spine, and whole body Low
: 1,200 mg of Ca carbonate + 100 μg vitamin D vs. Ca group Ca + vitamin D group (n = 22): 56.5 yrs
: 1,200 mg of Ca vs. Vitamin D Ca group (n = 21): 55.1 yrs
: 100 μg of vitamin D vs. Placebo Vitamin D group (n = 25): 53.1 yrs
Placebo (n = 23): 54.8 yrs
Reid et al. (2008, US) [15] RCT-parallel Low supplement Ca group Men aged 40 yrs and older 2 yrs BMD in the lumbar spine, hip, and whole body Low
: 600 mg of Ca vs. High supplement Ca group 600 mg Ca (n = 101): 55 ± 10 yrs
: 1,200 mg of Ca vs. Placebo 1,200 mg Ca group (n = 102): 57 ± 10 yrs
Placebo (n = 103): 57 ± 10 yrs
Cross-sectional studies
Chinda et al. (2019, Japan) [26] Cross-sectional Ca intake level Men aged 19 yrs and older (49.1 ± 15.1 yrs) End point measurement Event in osteopenia and odds ratio Low
≥ 650 mg Ca vs. < 650 mg Ca ≥ 650 mg/day Ca (n = 54)
< 650 mg/day Ca (n = 214)
Kim et al. (2017, Korea) [32] Cross-sectional Ca intake level Participants in the 2008–2011 KNHANES End point measurement BMD in both the femoral neck and lumbar spine Low
> 1,200 mg/day Ca Men (n = 5,953)
vs. 800–1,200 mg/day Ca Premenopausal women (n = 4,258)
vs. 400–800 mg/day Ca Postmenopausal women (n = 4,494)
vs. ≤ 400 mg/day Ca
Alghadir et al. (2015, Saudi Arabia) [34] Cross-sectional Ca intake level in different age group Young men and women aged 20–40 yrs End point measurement Lumbar spine, and total and femoral neck bone BMD Some concerns
Group 1 (25–30 yrs) Group 1 (25–30 yrs; n = 186; 100 men and 86 women) Serum bone-specific alkaline phosphatase; Serum osteocalcin; Serum free Ca
Group 2 (31–45 yrs) Group 2 (31–45 yrs; n = 164; 60 men and 104 women)
Low Ca group
: less than 500 mg vs. Moderate Ca group
: 500 to 900 mg vs. High Ca group
: more than 900 mg
Lee et al. (2015, Korea) [27] Cross-sectional Ca intake Men (n = 1,096): 63.2 ± 8.7 yrs End point measurement BMD in the lumbar spine and femoral neck Some concerns
Women (n = 844): 62.9 ± 9.8 yrs
Samozai et al. (2015, India) [31] Cross-sectional Ca + vitamin D group Postmenopausal women aged 48–60 yrs: outpatients of orthopedics who already received Ca supplements with vitamin D from the hospital’s pharmacy for up to 12 mon End point measurement Serum and urinary Ca Some concerns
: history of receiving 500 mg of Ca supplement as CaHPO4 + 500 IU vitamin D vs. Control group Ca + vitamin D group (n = 30)
Control group (n = 30)
Kim et al. (2014, Korea) [33] Cross-sectional Ca intake level Men and women aged 50 yrs and older (participants in the 2008–2011 KNHANES) End point measurement BMD in the total hip, lumbar spine, and femoral neck Low
< 400 mg Ca < 400 mg/day Ca (n = 3,745) Serum vitamin D and PTH
vs. 400–799 mg Ca 400–799 mg/day Ca (n = 2,572)
vs. 800–1,199 mg Ca 800–1,199 mg/day Ca (n = 687)
vs. ≥ 1,200 mg Ca ≥ 1,200 mg/day Ca (n = 256)
Lee et al. (2014, Korea) [28] Cross-sectional Ca intake Men: End point measurement BMD in whole body, lumbar spine, and femoral neck Low
Men > 50 (n = 1,405): 30.4 ± 0.3 yrs
Men ≤ 50 (n = 904): 61.3 ± 0.4 yrs
Women:
Premenopausal women (n = 1,758): 30.5 ± 0.3 yrs
Postmenopausal women (n = 868): 62.9 ± 0.5 yrs
Lee et al. (2014, Korea) [25] Cross-sectional Ca intake Old adults End point measurement BMD in the lumbar spine, total femur, and femoral neck Some concerns
Men (n = 1,374): 71.7 ± 0.2 yrs
Women (n = 1,569): 72.7 ± 0.2 yrs
Yang et al. (2014, Korea) [29] Cross-sectional Ca intake Middle-aged and older men (n = 2,305) End point measurement BMD in whole body, lumbar spine, total femur, and femoral neck Low
Age range: 50–79 yrs
Lee and Choi (2013, Korea) [30] Cross-sectional Ca intake College women students at Daegu, Korea (n = 83): 22.8 ± 5.4 yrs End point measurement Calcaneus BMD Low
Ca, calcium; EAR, Estimated Average Requirement; Aquamin F™, botanical Ca derived from the marine algal Lithothamnion sp.; BMA, bone mineral area; BMC, bone mineral content; BMD, bone mineral density; P1NP, procollagen type 1 N propeptide; CTX, C-terminal cross-linked telopeptide of type 1 collagen; KNHANES, Korea National Health and Nutrition Examination Survey; PTH, parathyroid hormone; pQCT, peripheral Quantitative Computed Tomography; scFOS, short-chain fructo-oligosaccharide; RCT, randomized controlled trial; CaFOS, 800 mg of calcium with 3 g of short-chain fructo-oligosaccharide; MD, maltodextrin.
1)The quality of each study is assessed on the basis of the study design, and risk of bias assessment is used for RCTs [6] or cross-sectional studies [4].
Table 3

Characteristics of the included studies examining the effect of Ca intake (EAR level) on bone health of pregnant or lactating women (RCTs)

nrp-16-S89-i003
Author (Year, Country) Study design Treatment for RCTs/Exposure for observational studies Participants (n) and mean age Study length Outcome assessed Risk of bias1)
Cullers et al. (2019, US) [41] RCT-parallel Ca group Pregnant women (n = 64) 17 mon BMD, BMC (tibia and radius) Some concerns
: 1,000 mg Ca vs. Placebo Ca group: 31.4 ± 6.4 yrs
Placebo: 28.2 ± 6.0 yrs
Normando et al. (2016, Mexico) [39] RCT-parallel Ca + vitamin D group Pregnant women (n = 56): 16.5 yrs 5–20 wks Δ BMC, BMA, and BMD (whole body, lumbar, total hip, femoral neck) Some concerns
: 600 mg Ca + 200 IU cholecalciferol vs. Placebo Age range: 14–19 yrs
Ca + vitamin D group (n = 30): 17.1 ± 0.9 yrs
Placebo (n = 26): 16.6 ± 1.5 yrs
Zhang et al. (2016, China) [42] RCT-parallel Low-Ca group Postpartum lactating Chinese women (n = 150) 12 mon BMD (Whole body, spine, left hip) Low
: 40 g of milk powder (300 mg Ca + 5 μg vitamin D) vs. Mid-Ca group Age range: 20–35 yrs
: 40 g of milk powder (600 mg Ca + 5 μg vitamin D) vs. High-Ca group Low-Ca: 26.8 ± 3.3 yrs
: 40 g of milk powder (900 mg Ca + 5 μg vitamin D) Med-Ca: 26.9 ± 2.8 yrs
High-Ca: 27.1 ± 2.5 yrs
Diogenes et al. (2015, Brazil) [38] RCT-parallel Ca + vitamin D group Pregnant adolescents (n = 56): 16 yrs 36 wks of gestation and 5 wks of postpartum Infant BMC, BMD, BMA Some concerns
: 600 mg Ca + 200 IU cholecalciferol vs. Placebo Age range: 13–19 yrs
Ca + vitamin D group (n = 30): 16.8 ± 1.5 yrs
Placebo (n = 26): 17.2 ± 1.0 yrs
Ettinger et al. (2014, Mexico) [40] RCT-parallel Ca group Pregnant women (n = 670) 8 mon Marker of osteoclast activity (bone resorption) (NTx) Low
: 1,200 mg Ca vs. Placebo Ca group (n = 334): 25.9 ± 5.3 yrs
Placebo (n = 336): 26.9 ± 5.6 yrs
Ca, calcium; EAR, Estimated Average Requirement; RCT, randomized controlled trial; BMC, bone mineral content; BMA, bone mineral area; BMD, bone mineral density; NTx, cross-linked N-telopeptides.
1)The quality of each study is assessed on the basis of the study design, and risk of bias assessment is used for RCTs [6].

Results of studies in infants aged 0 to 12 mon

In the study of infants, only one RCT study, which measured the tooth loss incidence and growth bone index was reviewed [7]. The study followed up on Tibetan children aged 0–5 yrs for 3 yrs, who received either Ca (15 mmol/day, equivalent to 600 mg/day), with or without vitamin D (625 μg/mon), or no supplement and found no significant improvement in growth and bone metabolism (Table 1). The evidence on the effect of Ca supplementation on bone health indicators in infants was limited.

Results of studies in children and adolescents aged 1 to 18 yrs

Four RCTs studies were reviewed for children and adolescents to examine the relationship between Ca intake and growth, and bone health indicators (Table 1). Gambian boys received 1 yr of Ca carbonate supplementation (1,000 mg/day), which advanced their growth spurt but had no lasting effect on bone mineral or bone size [8]. Ca retention in Mexican-American adolescents increased with Ca intake (P < 0.0001) ranging from 600 to 2,200 mg/day but did not differ by sex (P = 0.66) [9]. When Chinese adolescents aged 12–14 yrs were given 300, 600, and 900 mg of Ca supplements for 1 yr (total Ca intake including meals, 700 mg, 900 mg, and 1,300 mg), the femoral neck bone mineral content (BMC) increased regardless of sex. However, there was no significant difference between the 900 mg and 1,300 mg total Ca intake groups [10]. In the Unites States (US), white and black adolescents aged 8–16 yrs were classified based on body weight into healthy weight group (50–70 percentile), overweight group (85 percentile or more), and allocated to a supplement group (900 mg Ca/day per day through 3 servings of dairy products) or control group. Bone indicators were observed every 6 mon for 18 mon, and the bone content of the tibia increased by 4% in the supplement group; however, there was no significant difference regarding other bone indices [11].
The current recommended Ca intake in Korea is 1,000 mg and 900 mg for boys, and 900 mg and 800 mg for girls aged 12–14 yrs and 15–18 yrs, respectively [12]. The results of reviewed studies suggested that Ca supplementation in children and adolescents would be helpful in accumulating bone mass, but the amounts of Ca intake reported in these studies to increase bone accumulation were not different from the Ca requirement stated in the 2015 KDRIs calculated based on the physical growth standard. Therefore, there was no evidence to warrant reduction or increment of the currently applied Ca intake in children and adolescents.

Results of studies on men aged 19 yrs and older, and young women

Of the literature evaluated regarding bone health indicators including BMD, BMC, bone mineral area (BMA), and serum metabolites in adults, eleven studies were 2-armed RCTs [1314151617181920212223], and one was a cross-over study [24]; 5 of the studies were from the US, 2 from the United Kingdom (UK) [1620], 2 from Australia [1318], one from China [19], one from Japan [23], and one from Thailand [25]. Ten studies were cross-sectional [25262728293031323334], of which 7 were from Korea [25272829303233], one from Japan [26], one from Saudi Arabia [34], and one from India [31] (Table 2).
A total of 7 RCT studies reported findings for adult men and young women. In a study conducted with healthy young Australian jockeys in their twenties, Ca supplementation of 800 mg and 400 IU vitamin D for 6 mon significantly increased BMC (6.6%), BMA (5.9%), and BMD (1.3%) in the proximal cortical bone of the tibia; however, these changes were not significantly different from the placebo-control group [1213]. The group supplemented with the same amount of Ca and vitamin D had shown higher vitamin D levels (18.1%, P = 0.014, partial η2 = 0.38) and lower C-terminal cross-linked telopeptide of type I collagen (CTX) (−24.8%, P = 0.011), but there was no difference in either trabecular or cortical bone properties between groups [18]. In a study with male and female military personnel (mean age, 21.4 yrs) Ca supplementation with 2,000 mg and 1,000 IU vitamin D increased serum Ca levels, BMD, BMC, and thickness of the cortical bone by 14% in both groups [17]. Ca consumption of 1,600 mg and 1,000 IU of vitamin D prior to cycling for 5 mon did not ameliorate the negative effects of competitive cycling on the hip BMD in male road cyclists [16]. Overall, the findings regarding the change in bone health indicators in response to Ca supplementation are inconsistent. In addition, participants in the aforementioned studies, such as athletes and soldiers, are under repetitive physical loading [131718]; therefore, the results may not apply to general adults whose physical activity strength is weak or moderate. In 2 additional reviewed RCTs reported during 2008–2013, healthy men in the US (mean age, 57 yrs) who consumed 600 mg or 1,200 mg of Ca have shown an increased level of serum alkaline phosphatase, a bone formation indicator, and a decreased level of CTX, a bone resorption marker, in a dose-dependent manner compared to those in the placebo group. However, BMD was found to increase by 1.0–1.5% only in a group of participants who consumed 1,200 mg of Ca [15]. Ca supplementation with 1,200 mg for 3 mon decreased the serum bone resorption marker in healthy adult men and women in the US population (age range, 20–80 yrs old) [14]. An RCT conducted with healthy women (mean age, 28.8 yrs) reported increased parathyroid hormone (PTH) level after commercially manufactured Ca supplementation. However, this study only performed a single time point of Ca supplementation in participants with obesity (body mass index [BMI] > 25.5), and their sodium intake was limited to < 100 mEq [24] indicating that this evidence would be ineligible for extrapolation regarding the level of Ca consumption from the daily diet.
A total of 9 cross-sectional studies were reviewed to explore evidence in setting the EAR for Ca in adult men and young women. Of the study results reported, Japanese men who consumed Ca < 650 mg/day have shown a 2.92-fold higher risk of osteopenia than men who took Ca ≥ 650 mg/day (95% confidence interval, 1.09–7.81) [26]. A study on Korean men (aged < 50 yrs) reported a positive association between Ca intake and BMD in the femoral neck and lumbar spine [25272829], while no significant association was observed in men aged ≥ 50 yrs [28]. A study conducted in Daegu, a metropolitan city in Korea, reported that Ca intake in young Korean female college students (mean age, 22.8 yrs old; mean BMI, 21.8) was only 77% of the RNI [30]. This study also reported that the mean Ca intake was 568.9 mg in students of the normal BMD group and 446.2 mg in students of the osteopenia group without significant difference in energy consumption between the groups [30], indicating a positive relationship between Ca intake and Ca accretion in young women. The levels of Ca used in these studies are mostly in the range of the EAR for Ca in the 2015 KDRI [12].

Results of studies on postmenopausal women aged 50–75 yrs

In finding evidence in postmenopausal women, 5 RCTs and 4 cross-sectional studies were reviewed. Postmenopausal women aged 50–75 yrs who participated in the program of exercise (“the modified eighth section of the Eight-Section Brocade”) with 500 mg of daily Ca intake for 12 mon have shown increased lumbar spine BMD compared to women in a group only receiving Ca supplement without physical activity [19]. However, the study did not assess the amount of Ca obtained from the participants’ daily diet; hence, the exact amount of total Ca intake could not be inferred. Additionally, the effect of Ca on bone indicators could not be distinguished from the effect of physical activity. In women aged 45–75 yrs who were residing in the Ulster area in the UK, Ca intake of 900 mg/day for 1 yr did not induce any change in bone parameters in the lumbar spine and femoral neck during the 1-yr follow-up period [20]. Ca supplementation with 1,200 mg/day for 3 mon decreased the serum CTX, bone resorption marker, and PTH level in response to instant Ca load in healthy postmenopausal white American women [21]. However, the level of Ca effective in bone metabolism indicators reported in Asian countries are uncertain because the study participants’ basal Ca intake is different per study or not reported. A study conducted in Thailand reported that approximately 800 mg/day of Ca intake including the dietary Ca for 2 yrs increased the lumbar BMD by 2.7% compared to baseline measurement in healthy Thai postmenopausal women whose average daily Ca intake is 376 mg [22]. In a study conducted with Japanese postmenopausal women aged 50–75 yrs, Ca supplements of 500 mg/day slowed bone loss in the lumbar spine and femoral neck during a 2-yr follow-up period in perimenopause and postmenopausal women with a habitually low Ca intake (< 500 mg/day) [23]. Indian postmenopausal women, outpatients of orthopedics, who had a history of receiving tablets containing 500 mg Ca and 500 IU vitamin D for at least a month up to 12 mon have shown an increased urinary Ca excretion without the change in the serum Ca level, indicating enhanced Ca retention [31]. In the Korea National Health and Nutrition Examination Survey (KNHANES) conducted on the Korean population, Ca intake was positively correlated with the whole-body BMD in premenopausal women, while no significant association was detected in postmenopausal women aged ≥ 50 yrs [252728]. Another study, which analyzed the data from the 2008–2011 KNHANES, reported the association between Ca intake and the risk of metabolic syndrome and BMD [32]. In this study, participants were categorized by their daily Ca intake amount: < 400 mg; 400–800 mg; 800–1,200 mg; and ≥ 1,200 mg. Increased lumbar and femoral BMD and decreased odds ratio for the risk of osteoporosis were reported in groups with a Ca intake of 400–800 mg. Position statements of the 2015 Korean Society for Bone and Mineral Metabolism (KSBMM) recommended a daily Ca intake of 800–1,000 mg/day for preventing and treating osteoporosis in Korean postmenopausal women and men aged ≥ 50 yrs [35]. In the 2015 KDRIs, an extra 100 mg/day of Ca was added to the calculated RNIs for postmenopausal women as a reasonable margin of safety for lessening bone loss due to the typically low Ca intake of Korean women and need for public health protection at this life stage [12]. Postmenopausal women have a particularly higher risk of fracture, which may be exacerbated with inadequate Ca intake. Observational studies in Koreans indicate that adults with dietary Ca intakes over 668 mg/day have lower PTH and higher BMD at the femoral neck and spine [36], whereas others show that dietary intake of 800 mg/day and above is associated with better bone health despite adequate D status [33]. However, Ca intake through supplements was not accounted for in these studies. Nevertheless, these intakes are similar to the requirements calculated from a balance study in Japanese older adults [37].
In the literature reviewed in assessing the EAR for Ca in adults, findings from the RCTs were inconsistent due to different study conditions. Study participants under atypical physical activity were included, such as cyclists, soldiers, and jockeys, and the use of a broad range of Ca doses. Furthermore, inferring the proper Ca level, which may be advantageous to bone health outcomes on the data from Asian countries appears unreliable in Korean adults because the basal Ca intake of study participants varies per studies, and the Ca absorption data specific in the Korean population is almost scarce. Hence, the results achieved before June 2019 are not applicable to the general Korean adult population, including postmenopausal women in the 2020 KDRI.

Results of studies in pregnant or lactating women

In terms of the evidence in pregnant or lactating women, a total of 5 RCT studies were reviewed (Table 3). In Brazilian adolescent mothers who received Ca (600 mg/day) plus cholecalciferol (200 IU/day) supplementation or placebo from 26 wks of gestation to parturition, the BMC, BMD, and bone area BA changes in infants born were not different between supplementation and placebo group. However, infant body weight and its increment were higher in the supplemented group [38]. Another study of pregnant adolescents in Brazil aged 13–19 yrs reported that changes in bone mass by Ca supplementation were dependent on the genotype of the vitamin D receptor (VDR) [39]. In a study of short-term interventions in adult pregnant women, participants in their first trimester of pregnancy who received either 1,200 mg/day Ca or placebo were followed through 1-mon postpartum. Ca excretion in the Ca supplement group decreased by 15.8% on average, as compared to the placebo group, but there was no significant effect of Ca on bone formation. However, in participants who consumed 50% or more of the prescribed Ca, the bone speed of sound of the arm bone, which is an index of increase in bone thickness, increased by 59.0 m/s (P = 0.009) at 1 mon after childbirth [40]. In White and Black American pregnant women aged 19–50 yrs who received 1,000 mg of Ca and 2,000 IU of vitamin D for 36 mon, the supplement group had significantly greater increases in radial total BMD (P = 0.02) and tibial cortical BMD (P = 0.03) at 12 mon postpartum than the placebo group [41]. In Chinese postpartum lactating women, change in BMD from baseline to 12 mon among the 3 groups of 300 mg Ca (40 g milk powder), 600 mg Ca (40 g milk powder and 300 mg Ca supplement), and 900 mg Ca (40 g milk powder and 600 mg Ca supplement) was not significantly different [42].
Overall, the evidence on the effect of Ca supplementation on bone health indicators in pregnant or lactating women was limited or inconsistent. The results showed that the positive changes in bone health indicators after Ca supplementation during pregnancy and lactation were not significant.

Characteristics and main findings of studies according to health outcomes other than bone

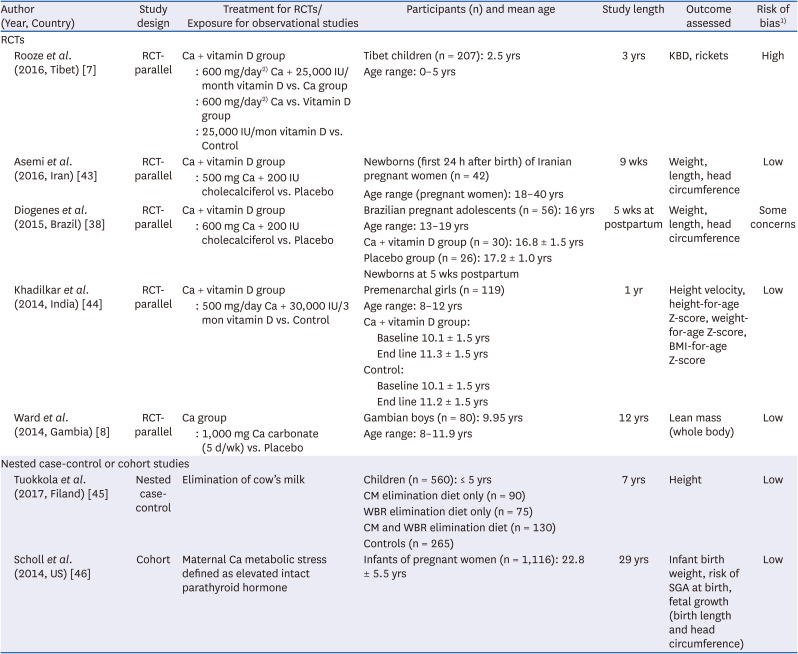
The main findings of the studies extracted through the search of keywords related to health outcomes other than bone health in setting the EAR for Ca were summarized in Tables 4-7. Other health outcomes included growth (5 RCTs, 2 cohort, and one nested case-control), cardiovascular disease (7 RCTs and 2 cross-sectional), hypertension (3 RCTs and 3 cohort), obesity, diabetes, and metabolic syndrome (4 RCTs, 6 cohort, and one cross-sectional) cancer (one RCTs and one cohort), frailty & sarcopenia (2 RCTs). Overall, reviews of cancer, frailty and sarcopenia among non-bone health outcomes were excluded because of a small number of studies reviewed in this study.
Table 4

Characteristics of the included studies examining the effect of Ca intake (EAR level) on growth

nrp-16-S89-i004
Author (Year, Country) Study design Treatment for RCTs/Exposure for observational studies Participants (n) and mean age Study length Outcome assessed Risk of bias1)
RCTs
Rooze et al. (2016, Tibet) [7] RCT-parallel Ca + vitamin D group Tibet children (n = 207): 2.5 yrs 3 yrs KBD, rickets High
: 600 mg/day2) Ca + 25,000 IU/month vitamin D vs. Ca group Age range: 0–5 yrs
: 600 mg/day2) Ca vs. Vitamin D group
: 25,000 IU/mon vitamin D vs. Control
Asemi et al. (2016, Iran) [43] RCT-parallel Ca + vitamin D group Newborns (first 24 h after birth) of Iranian pregnant women (n = 42) 9 wks Weight, length, head circumference Low
: 500 mg Ca + 200 IU cholecalciferol vs. Placebo Age range (pregnant women): 18–40 yrs
Diogenes et al. (2015, Brazil) [38] RCT-parallel Ca + vitamin D group Brazilian pregnant adolescents (n = 56): 16 yrs 5 wks at postpartum Weight, length, head circumference Some concerns
: 600 mg Ca + 200 IU cholecalciferol vs. Placebo Age range: 13–19 yrs
Ca + vitamin D group (n = 30): 16.8 ± 1.5 yrs
Placebo group (n = 26): 17.2 ± 1.0 yrs
Newborns at 5 wks postpartum
Khadilkar et al. (2014, India) [44] RCT-parallel Ca + vitamin D group Premenarchal girls (n = 119) 1 yr Height velocity, height-for-age Z-score, weight-for-age Z-score, BMI-for-age Z-score Low
: 500 mg/day Ca + 30,000 IU/3 mon vitamin D vs. Control Age range: 8–12 yrs
Ca + vitamin D group:
Baseline 10.1 ± 1.5 yrs
End line 11.3 ± 1.5 yrs
Control:
Baseline 10.1 ± 1.5 yrs
End line 11.2 ± 1.5 yrs
Ward et al. (2014, Gambia) [8] RCT-parallel Ca group Gambian boys (n = 80): 9.95 yrs 12 yrs Lean mass (whole body) Low
: 1,000 mg Ca carbonate (5 d/wk) vs. Placebo Age range: 8–11.9 yrs
Nested case-control or cohort studies
Tuokkola et al. (2017, Filand) [45] Nested case-control Elimination of cow’s milk Children (n = 560): ≤ 5 yrs 7 yrs Height Low
CM elimination diet only (n = 90)
WBR elimination diet only (n = 75)
CM and WBR elimination diet (n = 130)
Controls (n = 265)
Scholl et al. (2014, US) [46] Cohort Maternal Ca metabolic stress defined as elevated intact parathyroid hormone Infants of pregnant women (n = 1,116): 22.8 ± 5.5 yrs 29 yrs Infant birth weight, risk of SGA at birth, fetal growth (birth length and head circumference) Low
Ca, calcium; EAR, Estimated Average Requirement; KBD, Kashin–Beck disease; SGA, small-for-gestational-age; CM, cow's milk; WBR, wheat, barley or rye; RCT, randomized controlled trial; BMI, body mass index.
1)The quality of each study is assessed on the basis of the study design, and risk of bias assessment is used for RCTs [6] cohort or cross-sectional studies [4].
2)Ca of 15 mmol and vitamin D of 625 μg were given to the study participants. The mmol unit of Ca and μg of vitamin D are converted to mg and IU in the table, respectively.
Table 5

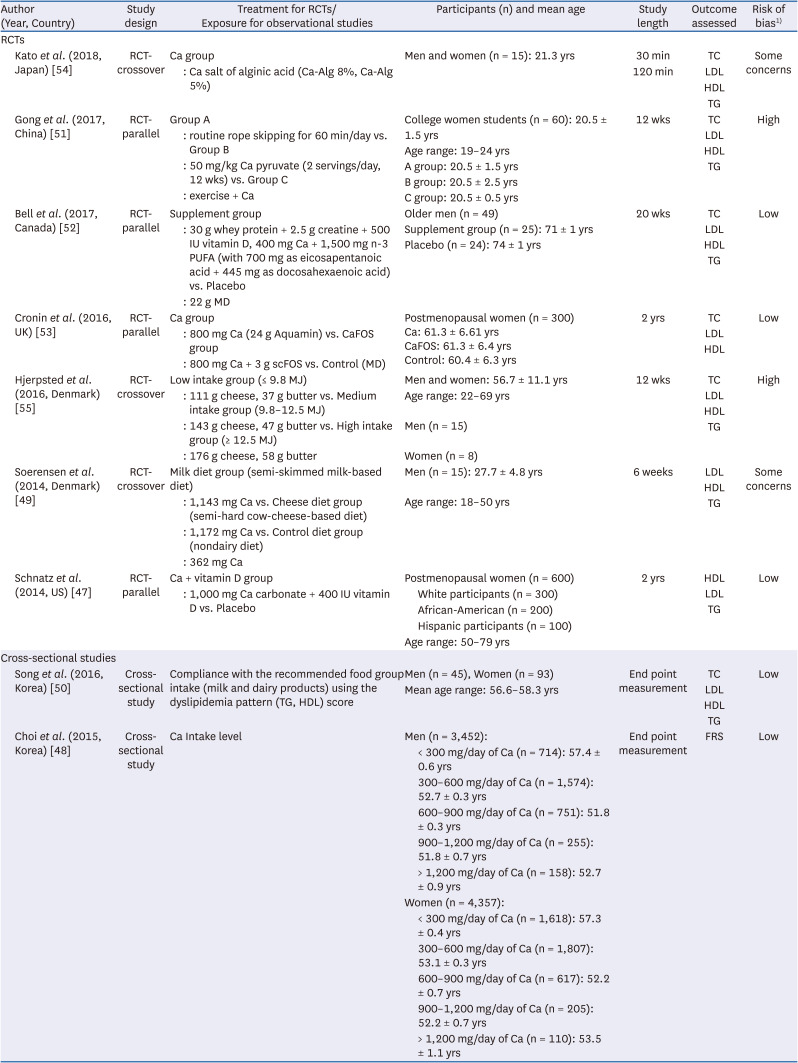
Characteristics of the included studies examining the effect of Ca intake (EAR level) on cardiovascular diseases

nrp-16-S89-i005
Author (Year, Country) Study design Treatment for RCTs/Exposure for observational studies Participants (n) and mean age Study length Outcome assessed Risk of bias1)
RCTs
Kato et al. (2018, Japan) [54] RCT-crossover Ca group Men and women (n = 15): 21.3 yrs 30 min TC Some concerns
: Ca salt of alginic acid (Ca-Alg 8%, Ca-Alg 5%) 120 min LDL
HDL
TG
Gong et al. (2017, China) [51] RCT-parallel Group A College women students (n = 60): 20.5 ± 1.5 yrs 12 wks TC High
: routine rope skipping for 60 min/day vs. Group B Age range: 19–24 yrs LDL
: 50 mg/kg Ca pyruvate (2 servings/day, 12 wks) vs. Group C A group: 20.5 ± 1.5 yrs HDL
: exercise + Ca B group: 20.5 ± 2.5 yrs TG
C group: 20.5 ± 0.5 yrs
Bell et al. (2017, Canada) [52] RCT-parallel Supplement group Older men (n = 49) 20 wks TC Low
: 30 g whey protein + 2.5 g creatine + 500 IU vitamin D, 400 mg Ca + 1,500 mg n-3 PUFA (with 700 mg as eicosapentanoic acid + 445 mg as docosahexaenoic acid) vs. Placebo Supplement group (n = 25): 71 ± 1 yrs LDL
: 22 g MD Placebo (n = 24): 74 ± 1 yrs HDL
TG
Cronin et al. (2016, UK) [53] RCT-parallel Ca group Postmenopausal women (n = 300) 2 yrs TC Low
: 800 mg Ca (24 g Aquamin) vs. CaFOS group Ca: 61.3 ± 6.61 yrs LDL
: 800 mg Ca + 3 g scFOS vs. Control (MD) CaFOS: 61.3 ± 6.4 yrs HDL
Control: 60.4 ± 6.3 yrs
Hjerpsted et al. (2016, Denmark) [55] RCT-crossover Low intake group (≤ 9.8 MJ) Men and women: 56.7 ± 11.1 yrs 12 wks TC High
: 111 g cheese, 37 g butter vs. Medium intake group (9.8–12.5 MJ) Age range: 22–69 yrs LDL
: 143 g cheese, 47 g butter vs. High intake group (≥ 12.5 MJ) Men (n = 15) HDL
: 176 g cheese, 58 g butter Women (n = 8) TG
Soerensen et al. (2014, Denmark) [49] RCT-crossover Milk diet group (semi-skimmed milk-based diet) Men (n = 15): 27.7 ± 4.8 yrs 6 weeks LDL Some concerns
: 1,143 mg Ca vs. Cheese diet group (semi-hard cow-cheese-based diet) Age range: 18–50 yrs HDL
: 1,172 mg Ca vs. Control diet group (nondairy diet) TG
: 362 mg Ca
Schnatz et al. (2014, US) [47] RCT-parallel Ca + vitamin D group Postmenopausal women (n = 600) 2 yrs HDL Low
: 1,000 mg Ca carbonate + 400 IU vitamin D vs. Placebo White participants (n = 300) LDL
African-American (n = 200) TG
Hispanic participants (n = 100)
Age range: 50–79 yrs
Cross-sectional studies
Song et al. (2016, Korea) [50] Cross-sectional study Compliance with the recommended food group intake (milk and dairy products) using the dyslipidemia pattern (TG, HDL) score Men (n = 45), Women (n = 93) End point measurement TC Low
Mean age range: 56.6–58.3 yrs LDL
HDL
TG
Choi et al. (2015, Korea) [48] Cross-sectional study Ca Intake level Men (n = 3,452): End point measurement FRS Low
< 300 mg/day of Ca (n = 714): 57.4 ± 0.6 yrs
300–600 mg/day of Ca (n = 1,574): 52.7 ± 0.3 yrs
600–900 mg/day of Ca (n = 751): 51.8 ± 0.3 yrs
900–1,200 mg/day of Ca (n = 255): 51.8 ± 0.7 yrs
> 1,200 mg/day of Ca (n = 158): 52.7 ± 0.9 yrs
Women (n = 4,357):
< 300 mg/day of Ca (n = 1,618): 57.3 ± 0.4 yrs
300–600 mg/day of Ca (n = 1,807): 53.1 ± 0.3 yrs
600–900 mg/day of Ca (n = 617): 52.2 ± 0.7 yrs
900–1,200 mg/day of Ca (n = 205): 52.2 ± 0.7 yrs
> 1,200 mg/day of Ca (n = 110): 53.5 ± 1.1 yrs
Ca, calcium; EAR, Estimated Average Requirement; RCT, randomized controlled trial; CaFOS, 800 mg of calcium with 3 g of short-chain fructo-oligosaccharides; scFOS, short-chain fructo-oligosaccharides; MD, maltodextrin; TC, total cholesterol; LDL, low density lipoprotein cholesterol; HDL, high density lipoprotein cholesterol; TG, triglyceride; MJ, megajoule; PUFA, polyunsaturated fatty acid; FRS, Framingham risk score.
1)The quality of each study is assessed on the basis of the study design, and risk of bias assessment is used for RCTs [6] or cross-sectional studies [4].
Table 6

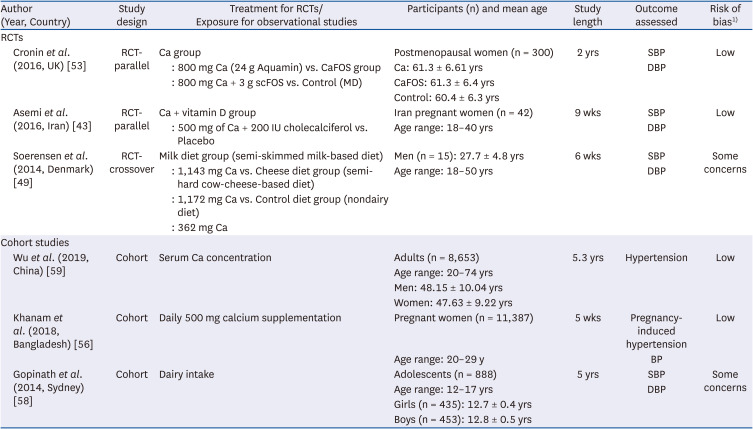
Characteristics of the included studies examining the effect of Ca intake (EAR level) on hypertension

nrp-16-S89-i006
Author (Year, Country) Study design Treatment for RCTs/Exposure for observational studies Participants (n) and mean age Study length Outcome assessed Risk of bias1)
RCTs
Cronin et al. (2016, UK) [53] RCT-parallel Ca group Postmenopausal women (n = 300) 2 yrs SBP Low
: 800 mg Ca (24 g Aquamin) vs. CaFOS group Ca: 61.3 ± 6.61 yrs DBP
: 800 mg Ca + 3 g scFOS vs. Control (MD) CaFOS: 61.3 ± 6.4 yrs
Control: 60.4 ± 6.3 yrs
Asemi et al. (2016, Iran) [43] RCT-parallel Ca + vitamin D group Iran pregnant women (n = 42) 9 wks SBP Low
: 500 mg of Ca + 200 IU cholecalciferol vs. Placebo Age range: 18–40 yrs DBP
Soerensen et al. (2014, Denmark) [49] RCT-crossover Milk diet group (semi-skimmed milk-based diet) Men (n = 15): 27.7 ± 4.8 yrs 6 wks SBP Some concerns
: 1,143 mg Ca vs. Cheese diet group (semi-hard cow-cheese-based diet) Age range: 18–50 yrs DBP
: 1,172 mg Ca vs. Control diet group (nondairy diet)
: 362 mg Ca
Cohort studies
Wu et al. (2019, China) [59] Cohort Serum Ca concentration Adults (n = 8,653) 5.3 yrs Hypertension Low
Age range: 20–74 yrs
Men: 48.15 ± 10.04 yrs
Women: 47.63 ± 9.22 yrs
Khanam et al. (2018, Bangladesh) [56] Cohort Daily 500 mg calcium supplementation Pregnant women (n = 11,387) 5 wks Pregnancy-induced hypertension Low
Age range: 20–29 y BP
Gopinath et al. (2014, Sydney) [58] Cohort Dairy intake Adolescents (n = 888) 5 yrs SBP Some concerns
Age range: 12–17 yrs DBP
Girls (n = 435): 12.7 ± 0.4 yrs
Boys (n = 453): 12.8 ± 0.5 yrs
Ca, calcium; EAR, Estimated Average Requirement; RCT, randomized controlled trial; CaFOS, 800 mg of calcium with 3 g of short-chain fructo-oligosaccharides; scFOS, short-chain fructo-oligosaccharides; MD, maltodextrin; SBP, systolic blood pressure; DBP, diastolic blood pressure; BP, blood pressure.
1)The quality of each study is assessed on the basis of the study design, and risk of bias assessment is used for RCTs [6] or cohort studies [4].
Table 7

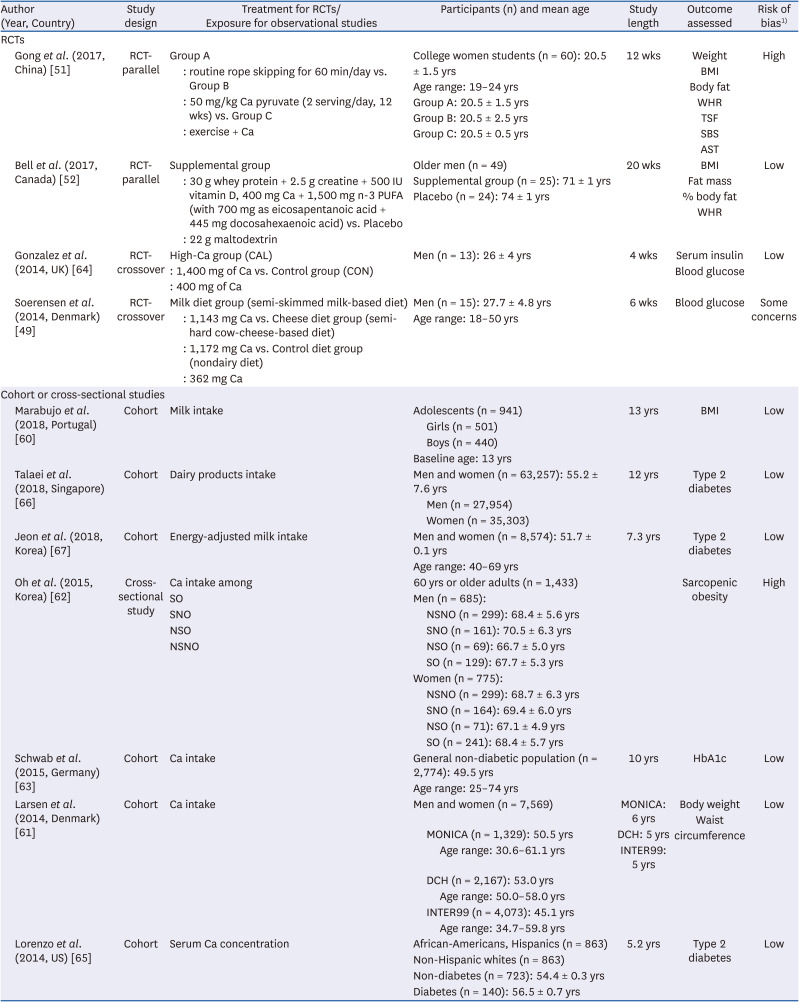
Characteristics of the included studies examining the effect of Ca intake (EAR level) on obesity, diabetes, and metabolic syndrome

nrp-16-S89-i007
Author (Year, Country) Study design Treatment for RCTs/Exposure for observational studies Participants (n) and mean age Study length Outcome assessed Risk of bias1)
RCTs
Gong et al. (2017, China) [51] RCT-parallel Group A College women students (n = 60): 20.5 ± 1.5 yrs 12 wks Weight High
: routine rope skipping for 60 min/day vs. Group B Age range: 19–24 yrs BMI
: 50 mg/kg Ca pyruvate (2 serving/day, 12 wks) vs. Group C Group A: 20.5 ± 1.5 yrs Body fat
: exercise + Ca Group B: 20.5 ± 2.5 yrs WHR
Group C: 20.5 ± 0.5 yrs TSF
SBS
AST
Bell et al. (2017, Canada) [52] RCT-parallel Supplemental group Older men (n = 49) 20 wks BMI Low
: 30 g whey protein + 2.5 g creatine + 500 IU vitamin D, 400 mg Ca + 1,500 mg n-3 PUFA (with 700 mg as eicosapentanoic acid + 445 mg docosahexaenoic acid) vs. Placebo Supplemental group (n = 25): 71 ± 1 yrs Fat mass
: 22 g maltodextrin Placebo (n = 24): 74 ± 1 yrs % body fat
WHR
Gonzalez et al. (2014, UK) [64] RCT-crossover High-Ca group (CAL) Men (n = 13): 26 ± 4 yrs 4 wks Serum insulin Low
: 1,400 mg of Ca vs. Control group (CON) Blood glucose
: 400 mg of Ca
Soerensen et al. (2014, Denmark) [49] RCT-crossover Milk diet group (semi-skimmed milk-based diet) Men (n = 15): 27.7 ± 4.8 yrs 6 wks Blood glucose Some concerns
: 1,143 mg Ca vs. Cheese diet group (semi-hard cow-cheese-based diet) Age range: 18–50 yrs
: 1,172 mg Ca vs. Control diet group (nondairy diet)
: 362 mg Ca
Cohort or cross-sectional studies
Marabujo et al. (2018, Portugal) [60] Cohort Milk intake Adolescents (n = 941) 13 yrs BMI Low
Girls (n = 501)
Boys (n = 440)
Baseline age: 13 yrs
Talaei et al. (2018, Singapore) [66] Cohort Dairy products intake Men and women (n = 63,257): 55.2 ± 7.6 yrs 12 yrs Type 2 diabetes Low
Men (n = 27,954)
Women (n = 35,303)
Jeon et al. (2018, Korea) [67] Cohort Energy-adjusted milk intake Men and women (n = 8,574): 51.7 ± 0.1 yrs 7.3 yrs Type 2 diabetes Low
Age range: 40–69 yrs
Oh et al. (2015, Korea) [62] Cross-sectional study Ca intake among 60 yrs or older adults (n = 1,433) Sarcopenic obesity High
SO Men (n = 685):
SNO NSNO (n = 299): 68.4 ± 5.6 yrs
NSO SNO (n = 161): 70.5 ± 6.3 yrs
NSNO NSO (n = 69): 66.7 ± 5.0 yrs
SO (n = 129): 67.7 ± 5.3 yrs
Women (n = 775):
NSNO (n = 299): 68.7 ± 6.3 yrs
SNO (n = 164): 69.4 ± 6.0 yrs
NSO (n = 71): 67.1 ± 4.9 yrs
SO (n = 241): 68.4 ± 5.7 yrs
Schwab et al. (2015, Germany) [63] Cohort Ca intake General non-diabetic population (n = 2,774): 49.5 yrs 10 yrs HbA1c Low
Age range: 25–74 yrs
Larsen et al. (2014, Denmark) [61] Cohort Ca intake Men and women (n = 7,569) MONICA: 6 yrs Body weight Low
MONICA (n = 1,329): 50.5 yrs DCH: 5 yrs Waist circumference
Age range: 30.6–61.1 yrs INTER99: 5 yrs
DCH (n = 2,167): 53.0 yrs
Age range: 50.0–58.0 yrs
INTER99 (n = 4,073): 45.1 yrs
Age range: 34.7–59.8 yrs
Lorenzo et al. (2014, US) [65] Cohort Serum Ca concentration African-Americans, Hispanics (n = 863) 5.2 yrs Type 2 diabetes Low
Non-Hispanic whites (n = 863)
Non-diabetes (n = 723): 54.4 ± 0.3 yrs
Diabetes (n = 140): 56.5 ± 0.7 yrs
Ca, calcium; EAR, Estimated Average Requirement; RCT, randomized controlled trial; BMI, body mass index; WHR, waist-hip ratio; TSF, triceps skinfold thickness; SBS, subscapular skinfold thickness; AST, abdominal skinfold thickness; PUFA, polyunsaturated fatty acid; MONICA, MONItoring trends and determinants of Cardiovascular disease; DCH, Diet, Cancer and Health Study; SO, sarcopenic obese; SNO, sarcopenic nonobese; NSO, nonsarcopenic obese; NSNO, nonsarcopenic nonobese.
1)The quality of each study is assessed on the basis of the study design, and risk of bias assessment is used for RCTs [6] or cohort or cross-sectional studies [4].
The relationship between Ca intake and growth in infants, toddlers, and adolescents were not consistent across studies (Table 4). There was no effect of Ca on growth in Tibetan children [7] and newborn [43]. However, Ca supplement was associated with an increase in adolescent growth [8], in which Ca and vitamin D supplementation had a positive effect on growth [44] and bone loss [38]. Milk consumption [45] and maternal Ca [46] were related to the growth of the fetus and children, respectively. These studies had several limitations to be considered as the evidence of EAR for Ca. Two RCTs studies were not double blinded and lacked detailed information on statistical analysis or Ca intake amount [744]. Three RCTs studies had a short supplementation period, and the number of the study participants was small [73843]. In one study, information on key factors related to growth such as physical activity, ultraviolet rays, vitamin D, and lean body mass was unclear or did not take account in the statistical model [8]. Two studies included specific participants, such as toddlers with food allergies [45] or infants of low-income mothers in their twenties [46].
In terms of cardiovascular disease, most studies showed that Ca supplements or dairy product intakes were negatively related to blood lipids [4748495051525354] (Table 5). However, Ca supplements used in some studies contained other nutrients, making it difficult to evaluate the effect of Ca itself on blood lipids or cardiovascular disease [47515253]. Several studies examined the effect of Ca on blood lipids by supplementation with Ca-rich supplements, not the dietary intake [4147525354]. In some RCT studies, there was no detailed information on the randomization process [5155]. Several cross-sectional studies could not examine the causal relationship between Ca intake and outcomes [4850]. One cross-sectional study had no information on drugs affecting Ca homeostasis, while one RCT study had a very short-term change (120 min) in blood lipid concentrations [54], and another RCT study examined participants with a more atherogenic lipid profile which would be more susceptible to saturated fatty acids, inducing increases in blood lipids and resulting in more-pronounced differences between diets [49].
Among studies reviewed for the relationship between Ca intake and blood pressure (Table 6), the effect of Ca intake on the decrease in blood pressure was more significant in women compared to men [49565758]; however, there were also results that did not show significant positive effects in both women and men [434953]. A cohort study found that the conjoint effects of serum Ca and insulin resistance at baseline on hypertension at follow-up [59].
The effects of Ca intake on obesity, diabetes, and metabolic syndrome were not consistent (Table 7). Dietary Ca intake was not related to BMI [60] or waist circumference [61]. In elderly men, dietary Ca intake was related to sarcopenic obesity [62]. Ca supplement has a positive effect on body weight [51], lean body mass [52], and glycated hemoglobin (HbA1c) [63]. However, there was no effect [64] or a negative effect [65] of Ca supplement on blood glucose and diabetes. Ca intake from some dairy products had no effect on BMI [60], but had a positive effect on diabetes [6667]. Among these studies, one RCT study was not double-blinded and did not have detailed information on the randomization process or Ca intake amount [51]. Another RCTs study could not evaluate the effect of Ca itself [52]. There were studies that did not consider confounding factors related to Ca intakes, such as vitamin D intakes, PTH concentrations, fat contents of dairy products, growth status, or had dietary measurement errors [6063656667]. For several studies, the generalizability of results was limited [4961636466]. One cross-sectional study was limited to a causal effect of Ca intake [62].

Results of the systematic review for establishing the Ca UL

Results of individual studies from the literature assessment have been outlined in Table 8 according to health indicators in setting the Ca UL. The major health indicators reviewed in this study include kidney stones, ossification, bone health, calcinosis, hypercalcemia, and calculus.
Table 8

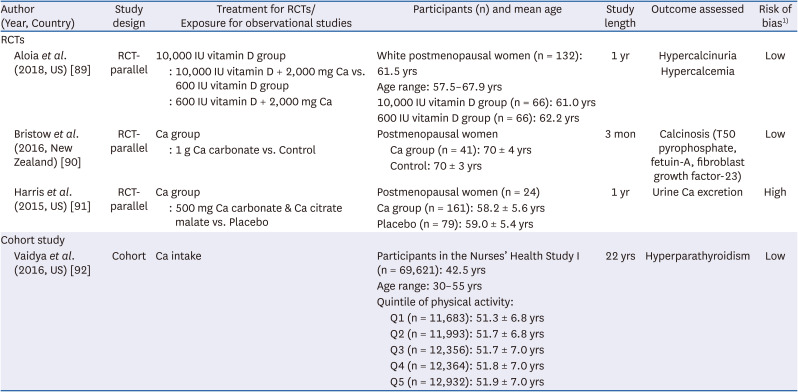
Characteristics of the included studies examining the UL level of Ca intake

nrp-16-S89-i008
Author (Year, Country) Study design Treatment for RCTs/Exposure for observational studies Participants (n) and mean age Study length Outcome assessed Risk of bias1)
RCTs
Aloia et al. (2018, US) [89] RCT-parallel 10,000 IU vitamin D group White postmenopausal women (n = 132): 61.5 yrs 1 yr Hypercalcinuria Low
: 10,000 IU vitamin D + 2,000 mg Ca vs. 600 IU vitamin D group Age range: 57.5–67.9 yrs Hypercalcemia
: 600 IU vitamin D + 2,000 mg Ca 10,000 IU vitamin D group (n = 66): 61.0 yrs
600 IU vitamin D group (n = 66): 62.2 yrs
Bristow et al. (2016, New Zealand) [90] RCT-parallel Ca group Postmenopausal women 3 mon Calcinosis (T50 pyrophosphate, fetuin-A, fibroblast growth factor-23) Low
: 1 g Ca carbonate vs. Control Ca group (n = 41): 70 ± 4 yrs
Control: 70 ± 3 yrs
Harris et al. (2015, US) [91] RCT-parallel Ca group Postmenopausal women (n = 24) 1 yr Urine Ca excretion High
: 500 mg Ca carbonate & Ca citrate malate vs. Placebo Ca group (n = 161): 58.2 ± 5.6 yrs
Placebo (n = 79): 59.0 ± 5.4 yrs
Cohort study
Vaidya et al. (2016, US) [92] Cohort Ca intake Participants in the Nurses’ Health Study I (n = 69,621): 42.5 yrs 22 yrs Hyperparathyroidism Low
Age range: 30–55 yrs
Quintile of physical activity:
Q1 (n = 11,683): 51.3 ± 6.8 yrs
Q2 (n = 11,993): 51.7 ± 6.8 yrs
Q3 (n = 12,356): 51.7 ± 7.0 yrs
Q4 (n = 12,364): 51.8 ± 7.0 yrs
Q5 (n = 12,932): 51.9 ± 7.0 yrs
Ca, calcium; UL, Tolerable Upper Intake Level;RCT, randomized controlled trial.
1)The quality of each study is assessed on the basis of the study design, and risk of bias assessment is used for RCTs [6] or cohort study [4].
There was no evidence on kidney stones, ossification, bone health, and calculus to consider the intake amount of Ca UL. Health indicators showing the detrimental effects of excessive Ca intake were calcinosis, hypercalcemia, hypercalcinuria, hyperparathyroidism, and urine Ca excretion. Only one RCT study in each health indicator was reviewed. Generally, studies could not separately evaluate the effect of Ca intake alone, and the generalization of the results was limited due to small sample size. Therefore, the evidence was not enough to apply the UL criteria.

DISCUSSION

We systematically reviewed literature published between 2008–2013 and 2014–2019 to assess the evidence in revising the KDRIs for Ca. Few studies of good quality were available for review. Most scientific evidence on bone health was reliable, but studies on other outcomes were weak or lacking. No balance studies or Ca absorption studies in Koreans were available in the years between 2014–2019. The changes in EAR and RNI in certain age groups were due to changes in the physical growth standards or rounding.
Habitual Ca intake of Koreans was considered in the 2020 KDRIs. The traditional Korean diet is low in Ca and change in dietary habits may be difficult. According to some revised calculations and rounding (as explained below), the EAR and RNI were subjected to increase in children and adolescents. However, the mean Ca intakes of Korean children and adolescents are far below those in the 2015 KDRIs, and an increase in the values for the 2020 KDRIs seemed unrealistic for public nutrition programs. Therefore, we rounded down the values resulting in similar values as those in the 2015 KDRIs. We recommend increasing the KDRIs for Ca in the future when mean Ca intake increases and approaching higher recommendations becomes realistically possible. However, due to the change in reference body size of older adults in the 2020 KDRIs, the calculated EARs and RNIs slightly decreased. The values were rounded up due to the increased risk of osteoporosis and fracture in this population and the higher rate of consumption of Ca supplements. The percentages of adults that consume Ca containing supplements and of those that reach the recommended intakes increases with age in adults, possibly due to the medical prescription of Ca supplements to prevent osteoporosis. The use of supplements may be the most practical method to adhere to the KDRIs in Koreans as habitual dietary Ca intake is low [6869]. Accordingly, the 2020 KDRI values for Ca did not change from those of 2015.
The KDRIs are established based on the assumption that other nutrients are appropriately consumed. However, in reality, the proper intake of some nutrients may be difficult to achieve. For instance, consumption of processed foods is increasing in Korea. Processed foods are generally high in sodium and phosphorus—2 nutrients that increase Ca excretion [70] when consumed in excess. Low Ca intake and high phosphorus and sodium intake can be detrimental to bone health in Koreans [12]. In particular, Korean adolescents have the highest EAR and RNI but the lowest intakes for Ca while consuming high amounts of sodium, possibly due to high intakes of processed foods [71]. This may negatively affect peak bone mass and increase the risk of osteoporosis and fracture in the later years of life. In addition, due to the decrease of outdoor social activities, increase of indoor activities, use of face masks during coronavirus disease 2019, and limited food sources of vitamin D, vitamin D deficiency may increase despite the already low vitamin D status of Koreans [72]. Low vitamin D status affects Ca metabolism and is associated with low BMD when Ca intake is also low. Therefore, appropriate intake of nutrients in addition to Ca is necessary, especially for Koreans, a population with low mean Ca intake.
As the literature search resulted in few reliable studies to revise the 2015 KDRI values, we thoroughly re-examined the basis of the previous KDRIs. The evidence of the recommendations in children and adolescents (ages 6–18 yrs) in the 2020 KDRIs were tailored to Asians as much as possible. When evidence in the Asian population was lacking but abundant in Whites within a specific age group, we used the mean of Whites and then averaged that with values in Asians in order to give more weight to Asians. In addition, for adolescents ages 12–14 and 15–18 yrs, balance studies were utilized to calculate the EAR and RNI [7374]. Regarding post-menopausal women, a 100 mg/day Ca increment to the calculated RNIs in women aged 50 yrs and older ensure public health protections and err on the side of caution in 2015 and was thus continued in 2020. As a result, the recommendations of the 2020 KDRIs for Ca did not change, but the scientific basis of the 2015 KDRIs was revisited and improved when determined necessarily.
Future research on the effect of Ca intake on non-skeletal outcomes, such as obesity, diabetes, hypertension, and cancer, is required. Small studies suggest a potential benefit of Ca on these outcomes [4951], but well-designed clinical trials are lacking. In pregnant and lactating women, recent evidence [38394041] in addition to those reviewed in 2015 [757677787980818283] indicates a possible need for additional Ca intake compared to that for non-pregnant or non-lactating women. Although the development of technical devices shows that BMD may recover after pregnancy or weaning, micro structures may remain deteriorated [84]. However, results are inconclusive, and more research must be conducted. Due to genetics, ability, and personal preferences, nutrition is not “one size fits all.” Studies have shown that the effect of Ca supplementation on bone may differ on the genotype of the VDR [39]. Our current knowledge on personalized nutrition is still developing. The US has launched Nutrition for Precision Health, powered by the All of Us research program [85].
Some research gaps specific to Koreans were additionally identified during the literature review. Despite decades of demand for clinical trials in Koreans, few have been performed. Studies on Ca balance, Ca absorption, Ca kinetics, and RCTs in diverse age groups are lacking among Koreans. To date, we were able to identify only one small balance study conducted decades ago in Korean children [86]. However, dietary pattern, nutrient intake, body weight, and height of children has drastically changed during the past decades, limiting its applicability. One balance and isotopic study were executed in the US, with a majority of participants being Korean American adolescents (specific ethnicity is not referred to in the manuscript, but the details are familiar as one author participated in the study) [87]. To our knowledge, apart from these 2 studies, most studies of the Korean population are observational, with a majority being cross-sectional. Furthermore, Ca supplement intake information is frequently omitted in observational studies. Another research gap is in pregnant adolescents, an increasing population in Korea [88]. Unlike the DRIs in North Americans, this dynamic life stage has not yet been accounted for in the KDRIs. In addition, nutrient requirements may differ between adult pregnancy and adolescent pregnancy as competition for essential nutrients between the growing adolescent and fetus may occur. A few Ca RCTs in pregnant adolescents are available in Whites but not in Koreans [3875]. Further clinical research in Korean pregnant females, including adolescents, is needed to be incorporated in future recommendations. Furthermore, the demand for personalized nutritional information is increasing in Korea as well. The KDRIs are utilized as public health guidelines; however, personalized approaches to nutrition may affect the shaping of the future KDRIs.
To conclude, despite a comprehensive review of the recent literature, we were unable to find high quality RCTs applicable in the 2020 KDRIs for Ca. Solid scientific evidence remains inadequate to set Ca requirements for outcomes other than bone health. Clinical trials in Koreans in diverse age groups and life stages may improve the quality of future recommendations.

ACKNOWLEDGMENTS

We thank Seunghee Kim (Chonnam National University), Hangyeol Jeon (Chonnam National University), and Dong Eun Lee (Dankook University) for their assistance in the literature screening process.

Notes

Funding: This research was supported by Policy Research Program for (project No. 20180415A13-00, 25193068200, 25203084501) from the Ministry of Health and Welfare in 2018–2020.

Conflict of Interest: The authors declare no potential conflicts of interests.

Author Contributions:

  • Conceptualization: Kim K, Park CY, Bu SY, Choi MJ.

  • Methodology: Kim K, Park CY, Bu SY, Choi MJ.

  • Investigation: Kim K, Park CY, Bu SY, Choi MJ, Choi DS, Jung YM, Yang N.

  • Writing - original draft: Kim K, Park CY, Bu SY, Choi MJ, Jang IS.

  • Writing - review & editing: Kim K, Park CY, Bu SY, Choi MJ.

References

1. O'Dell BL, Sunde RA. Handbook of Nutritionally Essential Mineral Elements. Boca Raton (FL): CRC Press;1997.
2. Institute of Medicine. Dietary Reference Intakes for Calcium and Vitamin D. Washington, D.C.: National Academies Press;2011.
3. Page MJ, McKenzie JE, Bossuyt PM, Boutron I, Hoffmann TC, Mulrow CD, Shamseer L, Tetzlaff JM, Akl EA, Brennan SE, et al. The PRISMA 2020 statement: an updated guideline for reporting systematic reviews. BMJ. 2021; 372:n71. PMID: 33782057.
4. Vandenbroucke JP, Von Elm E, Altman DG, Gøtzsche PC, Mulrow CD, Pocock SJ, Poole C, Schlesselman JJ, Egger M; Iniciativa STROBE. Strengthening the reporting of observational studies in epidemiology (STROBE): explanation and elaboration. Gac Sanit. 2009; 23:158. PMID: 19249134.
5. Wells G, Shea B, O'connell D, Peterson J, Welch V, Losos M, Tugwell P. The Newcastle-Ottawa Scale (NOS) for assessing the quality of nonrandomised studies in meta-analyses [Internet]. Ottawa: University of Ottawa;2018. cited 2019 January 5. Available from: http://www.ohri.ca/programs/clinical_epidemiology/oxford.asp.
6. Jadad AR, Moore RA, Carroll D, Jenkinson C, Reynolds DJ, Gavaghan DJ, McQuay HJ. Assessing the quality of reports of randomized clinical trials: is blinding necessary? Control Clin Trials. 1996; 17:1–12. PMID: 8721797.
7. Rooze S, Mathieu F, Claus W, Yangzom T, Yangzom D, Goyens P, de Maertelaer V. Effect of calcium and vitamin D on growth, rickets and Kashin-Beck disease in 0- to 5-year-old children in a rural area of central Tibet. Trop Med Int Health. 2016; 21:768–775. PMID: 27102369.
8. Ward KA, Cole TJ, Laskey MA, Ceesay M, Mendy MB, Sawo Y, Prentice A. The effect of prepubertal calcium carbonate supplementation on skeletal development in Gambian boys-a 12-year follow-up study. J Clin Endocrinol Metab. 2014; 99:3169–3176. PMID: 24762110.
9. Palacios C, Martin BR, McCabe GP, McCabe L, Peacock M, Weaver CM. Dietary calcium requirements do not differ between Mexican-American boys and girls. J Nutr. 2014; 144:1167–1173. PMID: 24872223.
10. Ma XM, Huang ZW, Yang XG, Su YX. Calcium supplementation and bone mineral accretion in Chinese adolescents aged 12-14 years: a 12-month, dose-response, randomised intervention trial. Br J Nutr. 2014; 112:1510–1520. PMID: 25231730.
11. Vogel KA, Martin BR, McCabe LD, Peacock M, Warden SJ, McCabe GP, Weaver CM. The effect of dairy intake on bone mass and body composition in early pubertal girls and boys: a randomized controlled trial. Am J Clin Nutr. 2017; 105:1214–1229. PMID: 28330908.
12. Ministry of Health and Welfare (KR). The Korean Nutrition Society. Dietary Reference Intakes for Koreans 2015. Sejong: Ministry of Health and Welfare;2015.
13. Silk LN, Greene DA, Baker MK, Jander CB. Tibial bone responses to 6-month calcium and vitamin D supplementation in young male jockeys: a randomised controlled trial. Bone. 2015; 81:554–561. PMID: 26362226.
14. Aloia J, Bojadzievski T, Yusupov E, Shahzad G, Pollack S, Mikhail M, Yeh J. The relative influence of calcium intake and vitamin D status on serum parathyroid hormone and bone turnover biomarkers in a double-blind, placebo-controlled parallel group, longitudinal factorial design. J Clin Endocrinol Metab. 2010; 95:3216–3224. PMID: 20463100.
15. Reid IR, Ames R, Mason B, Reid HE, Bacon CJ, Bolland MJ, Gamble GD, Grey A, Horne A. Randomized controlled trial of calcium supplementation in healthy, nonosteoporotic, older men. Arch Intern Med. 2008; 168:2276–2282. PMID: 19001206.
16. Mathis S, Farley RS, Fuller DK, Jetton AE, Ishikawa S, Caputo JL. Effects of a calcium supplement on bone mineral density in male cyclists. J Sports Med Phys Fitness. 2015; 55:940–945. PMID: 26470637.
17. Gaffney-Stomberg E, Lutz LJ, Rood JC, Cable SJ, Pasiakos SM, Young AJ, McClung JP. Calcium and vitamin D supplementation maintains parathyroid hormone and improves bone density during initial military training: a randomized, double-blind, placebo controlled trial. Bone. 2014; 68:46–56. PMID: 25118085.
18. Silk LN, Greene DA, Baker MK, Jander CB. The effect of calcium and vitamin D supplementation on bone health of male Jockeys. J Sci Med Sport. 2017; 20:225–229. PMID: 27568072.
19. Liu BX, Chen SP, Li YD, Wang J, Zhang B, Lin Y, Guan JH, Cai YF, Liang Z, Zheng F. The effect of the modified eighth section of eight-section brocade on osteoporosis in postmenopausal women: a prospective randomized trial. Medicine (Baltimore). 2015; 94:e991. PMID: 26107684.
20. Slevin MM, Allsopp PJ, Magee PJ, Bonham MP, Naughton VR, Strain JJ, Duffy ME, Wallace JM, Mc Sorley EM. Supplementation with calcium and short-chain fructo-oligosaccharides affects markers of bone turnover but not bone mineral density in postmenopausal women. J Nutr. 2014; 144:297–304. PMID: 24453130.
21. Aloia JF, Dhaliwal R, Shieh A, Mikhail M, Islam S, Yeh JK. Calcium and vitamin d supplementation in postmenopausal women. J Clin Endocrinol Metab. 2013; 98:E1702–E1709. PMID: 24064695.
22. Rajatanavin R, Chailurkit L, Saetung S, Thakkinstian A, Nimitphong H. The efficacy of calcium supplementation alone in elderly Thai women over a 2-year period: a randomized controlled trial. Osteoporos Int. 2013; 24:2871–2877. PMID: 23681085.
23. Nakamura K, Saito T, Kobayashi R, Oshiki R, Kitamura K, Oyama M, Narisawa S, Nashimoto M, Takahashi S, Takachi R. Effect of low-dose calcium supplements on bone loss in perimenopausal and postmenopausal Asian women: a randomized controlled trial. J Bone Miner Res. 2012; 27:2264–2270. PMID: 22653713.
24. Zenk JL, Frestedt JL, Kuskowski MA. Effect of calcium derived from Lithothamnion sp. on markers of calcium metabolism in premenopausal women. J Med Food. 2018; 21:154–158. PMID: 29023178.
25. Lee KS, Jang JS, Lee DR, Kim YH, Nam GE, Han BD, Han KD, Cho KH, Kim SM, Choi YS, et al. Serum ferritin levels are positively associated with bone mineral density in elderly Korean men: the 2008-2010 Korea National Health and Nutrition Examination Surveys. J Bone Miner Metab. 2014; 32:683–690. PMID: 24337956.
26. Chinda D, Shimoyama T, Sawada K, Iino C, Sakuraba H, Nakaji S, Fukuda S. Lifestyle factors rather than Helicobacter pylori infection or estradiol level are associated with osteopenia in Japanese men. Am J Men Health. 2019; 13:1557988319848219.
27. Lee KM, Kwon SS, Chung CY, Lee SY, Kim TG, Choi Y, Park MS. Gender- and body-site-specific factors associated with bone mineral density in a non-institutionalized Korean population aged ≥50 years. J Bone Miner Metab. 2015; 33:401–409. PMID: 25001078.
28. Lee KJ, Kim KS, Kim HN, Seo JA, Song SW. Association between dietary calcium and phosphorus intakes, dietary calcium/phosphorus ratio and bone mass in the Korean population. Nutr J. 2014; 13:114. PMID: 25496564.
29. Yang YJ, Kim J. Factors in relation to bone mineral density in Korean middle-aged and older men: 2008-2010 Korea National Health and Nutrition Examination Survey. Ann Nutr Metab. 2014; 64:50–59. PMID: 24851837.
30. Lee JW, Choi MJ. Nutrition, food habit, and bone mineral density in young college females. Osteoporosis. 2013; 11:81–88.
31. Samozai MN, Kulkarni AK. Do calcium supplements increase serum and urine calcium levels in post-menopausal women? J Nutr Health Aging. 2015; 19:537–541. PMID: 25923483.
32. Kim MK, Chon SJ, Noe EB, Roh YH, Yun BH, Cho S, Choi YS, Lee BS, Seo SK. Associations of dietary calcium intake with metabolic syndrome and bone mineral density among the Korean population: KNHANES 2008-2011. Osteoporos Int. 2017; 28:299–308. PMID: 27503170.
33. Kim KM, Choi SH, Lim S, Moon JH, Kim JH, Kim SW, Jang HC, Shin CS. Interactions between dietary calcium intake and bone mineral density or bone geometry in a low calcium intake population (KNHANES IV 2008-2010). J Clin Endocrinol Metab. 2014; 99:2409–2417. PMID: 24684465.
34. Alghadir AH, Gabr SA, Al-Eisa E. Physical activity and lifestyle effects on bone mineral density among young adults: sociodemographic and biochemical analysis. J Phys Ther Sci. 2015; 27:2261–2270. PMID: 26311965.
35. Kim KM, Choi HS, Choi MJ, Chung HY. Calcium and vitamin D supplementations: 2015 position statement of the Korean Society for Bone and Mineral Research. J Bone Metab. 2015; 22:143–149. PMID: 26713305.
36. Joo NS, Dawson-Hughes B, Kim YS, Oh K, Yeum KJ. Impact of calcium and vitamin D insufficiencies on serum parathyroid hormone and bone mineral density: analysis of the fourth and fifth Korea National Health and Nutrition Examination Survey (KNHANES IV-3, 2009 and KNHANES V-1, 2010). J Bone Miner Res. 2013; 28:764–770. PMID: 23045165.
37. Uenishi K, Ishida H, Kamei A, Shiraki M, Ezawa I, Goto S, Fukuoka H, Hosoi T, Orimo H. Calcium requirement estimated by balance study in elderly Japanese people. Osteoporos Int. 2001; 12:858–863. PMID: 11716189.
38. Diogenes ME, Bezerra FF, Rezende EP, Donangelo CM. Calcium plus vitamin D supplementation during the third trimester of pregnancy in adolescents accustomed to low calcium diets does not affect infant bone mass at early lactation in a randomized controlled trial. J Nutr. 2015; 145:1515–1523. PMID: 26019245.
39. Normando P, Diogenes ME, Cabello PH, Cabello GM, Donangelo CM, Bezerra FF. Calcium plus vitamin D supplementation during pregnancy interacts with polymorphisms in the promoter region of the VDR gene to affect postpartum bone mass of Brazilian adolescent mothers: a randomized controlled trial. Nutrition. 2016; 32:1068–1074. PMID: 27211082.
40. Ettinger AS, Lamadrid-Figueroa H, Mercado-García A, Kordas K, Wood RJ, Peterson KE, Hu H, Hernández-Avila M, Téllez-Rojo MM. Effect of calcium supplementation on bone resorption in pregnancy and the early postpartum: a randomized controlled trial in Mexican women. Nutr J. 2014; 13:116. PMID: 25511814.
41. Cullers A, King JC, Van Loan M, Gildengorin G, Fung EB. Effect of prenatal calcium supplementation on bone during pregnancy and 1 y postpartum. Am J Clin Nutr. 2019; 109:197–206. PMID: 30649176.
42. Zhang ZQ, Chen YM, Wang RQ, Huang ZW, Yang XG, Su YX. The effects of different levels of calcium supplementation on the bone mineral status of postpartum lactating Chinese women: a 12-month randomised, double-blinded, controlled trial. Br J Nutr. 2016; 115:24–31. PMID: 26522081.
43. Asemi Z, Samimi M, Siavashani MA, Mazloomi M, Tabassi Z, Karamali M, Jamilian M, Esmaillzadeh A. Calcium-vitamin D co-supplementation affects metabolic profiles, but not pregnancy outcomes, in healthy pregnant women. Int J Prev Med. 2016; 7:49. PMID: 27076887.
44. Khadilkar AV, Kadam NS, Chiplonkar SA, Khadilkar VV. Effect of micronutrient supplementation on height velocity of underprivileged girls in comparison with un-supplemented healthy controls. J Pediatr Endocrinol Metab. 2014; 27:245–252. PMID: 24150200.
45. Tuokkola J, Luukkainen P, Nevalainen J, Ahonen S, Toppari J, Ilonen J, Veijola R, Knip M, Virtanen SM, Kaila M. Eliminating cows’ milk, but not wheat, barley or rye, increases the risk of growth deceleration and nutritional inadequacies. Acta Paediatr. 2017; 106:1142–1149. PMID: 28345135.
46. Scholl TO, Chen X, Stein TP. Maternal calcium metabolic stress and fetal growth. Am J Clin Nutr. 2014; 99:918–925. PMID: 24500145.
47. Schnatz PF, Jiang X, Vila-Wright S, Aragaki AK, Nudy M, O’Sullivan DM, Jackson R, LeBlanc E, Robinson JG, Shikany JM, et al. Calcium/vitamin D supplementation, serum 25-hydroxyvitamin D concentrations, and cholesterol profiles in the Women’s Health Initiative calcium/vitamin D randomized trial. Menopause. 2014; 21:823–833. PMID: 24594863.
48. Choi SJ, Yeum KJ, Park SJ, Choi B, Joo NS. Dietary calcium and Framingham Risk Score in vitamin D deficient male (KNHANES 2009-2011). Yonsei Med J. 2015; 56:845–852. PMID: 25837195.
49. Soerensen KV, Thorning TK, Astrup A, Kristensen M, Lorenzen JK. Effect of dairy calcium from cheese and milk on fecal fat excretion, blood lipids, and appetite in young men. Am J Clin Nutr. 2014; 99:984–991. PMID: 24622806.
50. Song S, Paik HY, Park M, Song Y. Dyslipidemia patterns are differentially associated with dietary factors. Clin Nutr. 2016; 35:885–891. PMID: 26140958.
51. Gong W, Jiang J. Effect of rope skipping combining calcium pyruvate on fat metabolism of female college students. Biomed Res (Aligarh). 2018; S333–S336.
52. Bell KE, Snijders T, Zulyniak M, Kumbhare D, Parise G, Chabowski A, Phillips SM. A whey protein-based multi-ingredient nutritional supplement stimulates gains in lean body mass and strength in healthy older men: a randomized controlled trial. PLoS One. 2017; 12:e0181387. PMID: 28719669.
53. Cronin BE, Allsopp PJ, Slevin MM, Magee PJ, Livingstone MB, Strain JJ, McSorley EM. Effects of supplementation with a calcium-rich marine-derived multi-mineral supplement and short-chain fructo-oligosaccharides on serum lipids in postmenopausal women. Br J Nutr. 2016; 115:658–665. PMID: 26669430.
54. Kato T, Idota Y, Shiragami K, Koike M, Nishibori F, Tomokane M, Seki T, Itabashi K, Hakoda K, Takahashi H, et al. Randomized, double-blind, crossover clinical trial of the effect of calcium alginate in noodles on postprandial blood glucose level. Biol Pharm Bull. 2018; 41:1367–1371. PMID: 29973437.
55. Hjerpsted JB, Dragsted LO, Tholstrup T. Cheese intake lowers plasma cholesterol concentrations without increasing bile acid excretion. J Nutr Intermed Metab. 2016; 3:12–17.
56. Khanam F, Hossain B, Mistry SK, Mitra DK, Raza WA, Rifat M, Afsana K, Rahman M. The association between daily 500 mg calcium supplementation and lower pregnancy-induced hypertension risk in Bangladesh. BMC Pregnancy Childbirth. 2018; 18:406. PMID: 30332997.
57. Liu Z, Fang A, He J, Shen X, Gao R, Zhao X, Li K. Association of habitually low intake of dietary calcium with blood pressure and hypertension in a population with predominantly plant-based diets. Nutrients. 2018; 10:603.
58. Gopinath B, Flood VM, Burlutsky G, Louie JC, Baur LA, Mitchell P. Dairy food consumption, blood pressure and retinal microcirculation in adolescents. Nutr Metab Cardiovasc Dis. 2014; 24:1221–1227. PMID: 24996501.
59. Wu X, Han T, Gao J, Zhang Y, Zhao S, Sun R, Sun C, Niu Y, Li Y. Association of serum calcium and insulin resistance with hypertension risk: a prospective population-based study. J Am Heart Assoc. 2019; 8:e009585. PMID: 30596304.
60. Marabujo T, Ramos E, Lopes C. Dairy products and total calcium intake at 13 years of age and its association with obesity at 21 years of age. Eur J Clin Nutr. 2018; 72:541–547. PMID: 29371641.
61. Larsen SC, Ängquist L, Ahluwalia TS, Skaaby T, Roswall N, Tjønneland A, Halkjær J, Overvad K, Pedersen O, Hansen T, et al. Interaction between genetic predisposition to obesity and dietary calcium in relation to subsequent change in body weight and waist circumference. Am J Clin Nutr. 2014; 99:957–965. PMID: 24500147.
62. Oh C, Jho S, No JK, Kim HS. Body composition changes were related to nutrient intakes in elderly men but elderly women had a higher prevalence of sarcopenic obesity in a population of Korean adults. Nutr Res. 2015; 35:1–6. PMID: 25524331.
63. Schwab S, Zierer A, Heier M, Fischer B, Huth C, Baumert J, Meisinger C, Peters A, Thorand B. Intake of vitamin and mineral supplements and longitudinal association with HbA1c levels in the general non-diabetic population--results from the MONICA/KORA S3/F3 study. PLoS One. 2015; 10:e0139244. PMID: 26473975.
64. Gonzalez JT, Green BP, Campbell MD, Rumbold PL, Stevenson EJ. The influence of calcium supplementation on substrate metabolism during exercise in humans: a randomized controlled trial. Eur J Clin Nutr. 2014; 68:712–718. PMID: 24642785.
65. Lorenzo C, Hanley AJ, Rewers MJ, Haffner SM. Calcium and phosphate concentrations and future development of type 2 diabetes: the Insulin Resistance Atherosclerosis Study. Diabetologia. 2014; 57:1366–1374. PMID: 24763850.
66. Talaei M, Pan A, Yuan JM, Koh WP. Dairy intake and risk of type 2 diabetes. Clin Nutr. 2018; 37:712–718. PMID: 28318689.
67. Jeon J, Jang J, Park K. Effects of consuming calcium-rich foods on the incidence of type 2 diabetes mellitus. Nutrients. 2018; 11:31.
68. Korea Centers for Disease Control and Prevention. Report Presentation of the Korea National Health and Nutrition Examination Survey (KNHANES) VI: 2013–2015. Sejong: Korea Centers for Disease Control and Prevention;2015.
69. Korea Centers for Disease Control and Prevention. Report Presentation of the Korea National Health and Nutrition Examination Survey (KNHANES) VII: 2016–2017. Sejong: Korea Centers for Disease Control and Prevention;2017.
70. Calvo MS, Moshfegh AJ, Tucker KL. Assessing the health impact of phosphorus in the food supply: issues and considerations. Adv Nutr. 2014; 5:104–113. PMID: 24425729.
71. Kim M, Yoon J. Estimation of usual intake and assessment of nutrient intake for Korean adolescents: analysis of the 2010-2012 Korea National Health and Nutrition Examination Survey. Fam Environ Res. 2017; 55:385–397.
72. Park JH, Hong IY, Chung JW, Choi HS. Vitamin D status in South Korean population: seven-year trend from the KNHANES. Medicine (Baltimore). 2018; 97:e11032. PMID: 29952942.
73. Vatanparast H, Bailey DA, Baxter-Jones AD, Whiting SJ. Calcium requirements for bone growth in Canadian boys and girls during adolescence. Br J Nutr. 2010; 103:575–580. PMID: 19852873.
74. Wu L, Martin BR, Braun MM, Wastney ME, McCabe GP, McCabe LD, DiMeglio LA, Peacock M, Weaver CM. Calcium requirements and metabolism in Chinese-American boys and girls. J Bone Miner Res. 2010; 25:1842–1849. PMID: 20205166.
75. Diogenes ME, Bezerra FF, Rezende EP, Taveira MF, Pinhal I, Donangelo CM. Effect of calcium plus vitamin D supplementation during pregnancy in Brazilian adolescent mothers: a randomized, placebo-controlled trial. Am J Clin Nutr. 2013; 98:82–91. PMID: 23719547.
76. Ward KA, Jarjou L, Prentice A. Long-term effects of maternal calcium supplementation on childhood growth differ between males and females in a population accustomed to a low calcium intake. Bone. 2017; 103:31–38. PMID: 28583879.
77. Abdel-Aleem H, Merialdi M, Elsnosy ED, Elsedfy GO, Abdel-Aleem MA, Villar J. The effect of calcium supplementation during pregnancy on fetal and infant growth: a nested randomized controlled trial within WHO calcium supplementation trial. J Matern Fetal Neonatal Med. 2009; 22:94–100. PMID: 19085634.
78. Koo WW, Walters JC, Esterlitz J, Levine RJ, Bush AJ, Sibai B. Maternal calcium supplementation and fetal bone mineralization. Obstet Gynecol. 1999; 94:577–582. PMID: 10511362.
79. Young BE, McNanley TJ, Cooper EM, McIntyre AW, Witter F, Harris ZL, O’Brien KO. Maternal vitamin D status and calcium intake interact to affect fetal skeletal growth in utero in pregnant adolescents. Am J Clin Nutr. 2012; 95:1103–1112. PMID: 22492380.
80. Hwang IR, Choi YK, Lee WK, Kim JG, Lee IK, Kim SW, Park KG. Association between prolonged breastfeeding and bone mineral density and osteoporosis in postmenopausal women: KNHANES 2010-2011. Osteoporos Int. 2016; 27:257–265. PMID: 26373982.
81. Jarjou LM, Laskey MA, Sawo Y, Goldberg GR, Cole TJ, Prentice A. Effect of calcium supplementation in pregnancy on maternal bone outcomes in women with a low calcium intake. Am J Clin Nutr. 2010; 92:450–457. PMID: 20554790.
82. Jarjou LM, Sawo Y, Goldberg GR, Laskey MA, Cole TJ, Prentice A. Unexpected long-term effects of calcium supplementation in pregnancy on maternal bone outcomes in women with a low calcium intake: a follow-up study. Am J Clin Nutr. 2013; 98:723–730. PMID: 23902782.
83. Liu Z, Qiu L, Chen YM, Su YX. Effect of milk and calcium supplementation on bone density and bone turnover in pregnant Chinese women: a randomized controlled trail. Arch Gynecol Obstet. 2011; 283:205–211. PMID: 20044757.
84. Bjørnerem Å, Ghasem-Zadeh A, Wang X, Bui M, Walker SP, Zebaze R, Seeman E. Irreversible deterioration of cortical and trabecular microstructure associated with breastfeeding. J Bone Miner Res. 2017; 32:681–687. PMID: 27736021.
85. National Institutes of Health (US). All of Us Research Program [Internet]. Bethesda (MD): National Institutes of Health;2021. cited 2021 October 7. Available from: https://allofus.nih.gov/.
86. Lee KH, Choi IS, Oh SH. A study on intake/excretion of sodium and calcium in Korean children. Korean J Nutr. 1995; 28:749–758.
87. Park CY, Hill KM, Elble AE, Martin BR, DiMeglio LA, Peacock M, McCabe GP, Weaver CM. Daily supplementation with 25 μg cholecalciferol does not increase calcium absorption or skeletal retention in adolescent girls with low serum 25-hydroxyvitamin D. J Nutr. 2010; 140:2139–2144. PMID: 20962148.
88. Shin JH, Bauer S, Yoon YS, Jeong HC, Rhie YJ, Lee JH, Woo CW, Choi BM, Kim HJ, Park SH, et al. Obstetric and neonatal outcomes of the teenage pregnancy. J Korean Soc Neonatol. 2010; 17:94–101.
89. Aloia JF, Katumuluwa S, Stolberg A, Usera G, Mikhail M, Hoofnagle AN, Islam S. Safety of calcium and vitamin D supplements, a randomized controlled trial. Clin Endocrinol (Oxf). 2018; 89:742–749. PMID: 30180273.
90. Bristow SM, Gamble GD, Pasch A, O’Neill WC, Stewart A, Horne AM, Reid IR. Acute and 3-month effects of calcium carbonate on the calcification propensity of serum and regulators of vascular calcification: secondary analysis of a randomized controlled trial. Osteoporos Int. 2016; 27:1209–1216. PMID: 26493812.
91. Harris SS, Dawson-Hughes B. Effects of hydration and calcium supplementation on urine calcium concentration in healthy postmenopausal women. J Am Coll Nutr. 2015; 34:340–346. PMID: 25856469.
92. Vaidya A, Curhan GC, Paik JM, Wang M, Taylor EN. Physical activity and the risk of primary hyperparathyroidism. J Clin Endocrinol Metab. 2016; 101:1590–1597. PMID: 26812691.
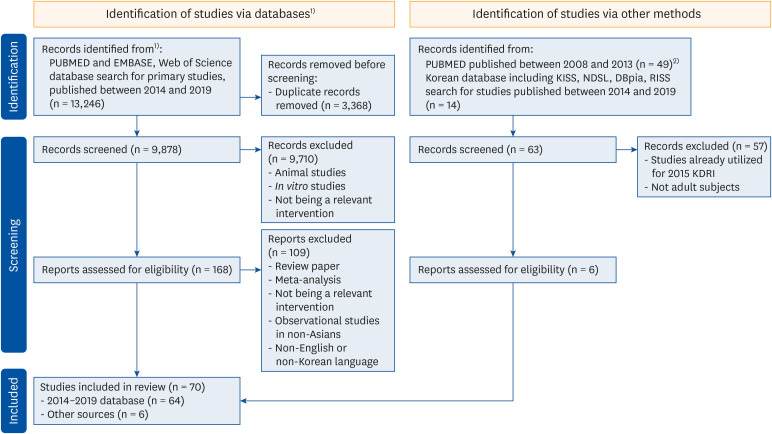
SUPPLEMENTARY MATERIALS

Supplementary Table 1

Search terms used for the literature search in setting the Estimated Average Requirements of the 2020 Dietary Reference Intakes for Koreans for calcium
nrp-16-S89-s001.xls

Supplementary Table 2

Search terms used for the literature search in setting the Tolerable Upper Intake Level of the 2020 Dietary Reference Intakes for Koreans for calcium
nrp-16-S89-s002.xls
TOOLS
Similar articles