

 PDF
PDF Citation
 Print
Print


INTRODUCTION
Sodium is an essential element that maintains homeostasis and physiological functions. Being a major cation in the extracellular fluid, sodium is involved in osmotic pressure regulation and water balance, and also plays a role in nerve impulse transmission, muscle contraction, and acid-base balance [1]. Therefore, insufficient sodium intake is usually associated with adverse health outcomes. Contrarily, excessive sodium intake is a risk factor for several chronic diseases [23], particularly cardiovascular, mainly through the effect of sodium intake on blood pressure (BP) [2456]. It is well known that a reduction in the dietary sodium decreases BP and the incidence of hypertension, which is also associated with reduced morbidity and mortality resulting from cardiovascular diseases (CVDs) [237].
Dietary Reference Intakes (DRIs) are defined as a set of quantitative reference values for the apparently healthy population. They are traditionally used in planning and assessing diets based on nutrient deficiencies and/or toxicities [8]. Previously, an attempt was made for the Korean population to set the Estimated Average Requirement (EAR) and the recommended nutrient intake (RNI) for sodium adequacy, and the tolerable upper intake level (UL) for preventing health problems arising from sodium toxicity [9], leading to the establishment of the sodium adequate intake (AI) instead of the EAR and RNI, and the sodium intake goal instead of the UL, in the 2015 DRIs for Koreans (KDRIs). This was based taking into account the lack of appropriate indicators of sodium exposure, and insufficient scientific evidence on sodium adequacy or toxicity [9]. However, considering the impact of nutrition on the prevention, treatment and health promotion of chronic diseases, the use of chronic disease endpoints to establish the DRIs has been addressed. Population aging and the increased prevalence of chronic diseases worldwide, along with accumulating scientific evidence on the health effect of sodium intake, further potentiated the establishment of dietary recommendations aimed at reducing chronic diseases [8]. As such, there has been a consensus to include a new DRI category for the prevention of chronic diseases, in addition to the traditional framework of DRIs [10].
Very recently, chronic disease risk reduction intake (CDRR) for dietary sodium (a new category of reference values specific for chronic disease risk reduction) has been proposed in the Consensus Study Reports published by the committee of the National Academies of Sciences, Engineering, and Medicine [8]. In this report, the CDRR is defined as the lowest level of intake where there is sufficient strength of evidence (SoE) to characterize a chronic disease risk reduction, which was established in the DRIs for US and Canada [8]. This implies that reducing the sodium intake above the CDRR established would decrease the risk of chronic disease [8]. For the 2020 KDRIs, the committee comprehensively reviewed the available evidence, and considered the update of current KDRIs for sodium by focusing on the CDRR. A thorough systematic literature review of the relationship between dietary sodium and the risk of chronic diseases resulted in the committee establishing the sodium CDRR to prevent chronic diseases as a new category in the 2020 KDRIs.
This review presents the rationale and processes of establishing the KDRIs for adequacy and toxicity of dietary sodium, as well as specific values of the 2020 KDRIs for dietary sodium, using the 4-step evidence-based approach suggested by the US sodium committee [8], comprising the following steps: Step 1. Review and selection of indicators; Step 2. Assessment of the intake–response relationships of the selected indicators and establishment of DRI values; Step 3. Comparison of current population intake levels and DRI values to characterize the risk; Step 4. Discussion of public health implications and special considerations. This report provides the sodium intake level as an AI and, more importantly, we herein report a new CDRR value for dietary sodium for Koreans.
INDICATORS TO ESTABLISH THE KDRIs FOR DIETARY SODIUM
Indicators of sodium adequacy
A critical initial step of the DRIs framework is selection of the indicators for adequate and excessive dietary intakes of sodium. As reported earlier, no sensitive biomarkers are available to help characterize the sodium requirements in a healthy population [8]. For the purpose of the literature review, sodium balance, urinary sodium excretion, and sodium level in blood were selected as indicators of sodium exposure in the 2020 KDRIs. In addition, intermediate biomarkers selected for chronic disease indicators include insulin resistance, plasma renin activity, and BP.
Indicators of sodium toxicity
The UL is defined as the highest intake level at which there is no risk of any adverse health effect in apparently healthy individuals. To set the UL for dietary sodium in the US and Canada, the lowest toxic sodium level was calculated on the basis of an increase in BP due to sodium intake, as the toxicity endpoint in the 2005 DRIs [8]. However, the approach to establish the sodium UL in the report of 2019 jointly developed by the US and Canada differs in that health effects of excessive sodium intakes on BP, stroke and coronary heart need to be considered when establishing the sodium CDRR. Under the synthesis of evidence for the 2020 KDRIs, sodium toxicity should be considered based on toxicity, and not on chronic disease endpoint related indicators.
Chronic disease indicators to establish sodium CDRR
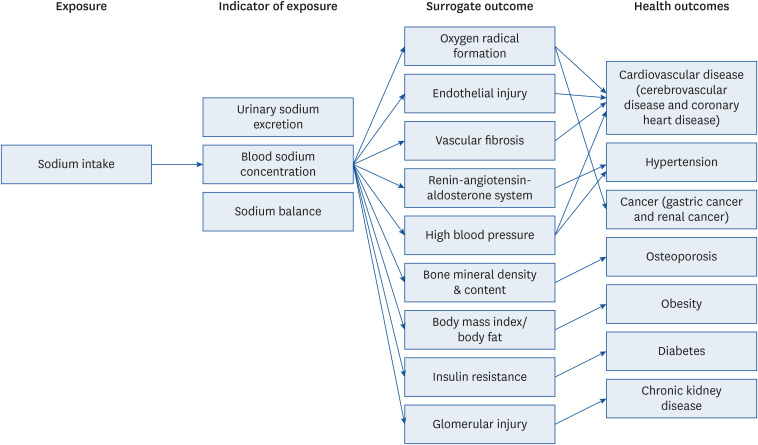
While the sodium UL is established based on the toxic effect derived from excessive intake of sodium, the CDRR indicates the decrease in the risks of chronic diseases with reductions in dietary sodium intake [8]. For the 2020 KDRIs, the committee reviewed the causal relationship between sodium intake and indicators that could potentially inform the sodium CDRRs, including chronic disease endpoints and surrogate markers. The scientific evidence and conclusions previously accumulated in the 2015 KDRIs was also considered for this deliberation. To review the causal relationship between sodium intake and chronic disease, we finally selected CVD (cerebrovascular disease and coronary heart disease), hypertension, cancer (gastric cancer and renal cancer), osteoporosis, obesity, diabetes, and chronic kidney disease as potential health outcomes, and renin-angiotensin-aldosterone system (RAAS), high BP, bone mineral density, bone mineral content, body mass index (BMI), and glomerular injury as surrogate markers (Fig. 1). Evidence from these indicators can be accumulated to inform the development of a sodium CDRR. More specifically, if there is moderate to high SoE for a causal relationship and an intake–response relationship between sodium intake and chronic disease indicators, a sodium CDRR would be established [11].
INTAKE–RESPONSE RELATIONSHIP AND SPECIFICATION OF KDRI VALUES
The EAR, RNI, and AI for sodium adequacy
In general, the EAR and RNI are established based on available sufficient scientific evidence for nutrient requirements, in the absence of which the AI is established [12]. Due to insufficient scientific evidence of the intake–response relationship for selected adequacy indicators to establish the EAR and RNI in the 2020 KDRIs (which was similar to the 2015 KDRIs), the committee established the AI of dietary sodium for the 2020 KDRIs. It is generally accepted that AI can be established using the average sodium intake of a healthy population [8] when it is not possible to establish the EAR and RNI. However, the average daily intake of dietary sodium for Koreans was determined to be 3,287 mg according to the 2019 Korea National Health and Nutrition Examination Survey (KNHANES) [13], which is too high to be considered as the sodium AI value. Therefore, the AI for sodium in the 2020 KDRIs was established based on the results of balance studies involving healthy subjects and evidence of the adverse physiological effects of low sodium consumption, such as toxic effects or the occurrence of various diseases [8]. It was established that a diet containing approximately 1,500 mg/day of sodium met the recommended intakes for other nutrients [14]. Increase in plasma levels of total cholesterol was found in the range 460–690 mg/day of sodium intake [15]. When considering the association of sodium intake with insulin resistance, sodium intake lower than 700 mg/day increased insulin resistance [16], while a sodium intake of ≥ 1,200 mg/day was not associated with insulin resistance in non-obese and normotensive men [17]. In addition, evidence from a well-designed balance study conducted among adults [18] reported that sodium intake of 1,525 mg/day among adult men was equivalent to the excreted sodium. Taken together, the appropriateness of the sodium AI value of 1,500 mg/day for adults aged 19–64 years in the 2015 KDRIs was reviewed, and it was decided to recommend this value in the 2020 KDRIs. Since there was no available evidence enough to establish the sodium AI for other age groups, the sodium AI for infants, children, adolescents, and the elderly was calculated by extrapolating from the adult sodium AI value, based on the energy intake involved, as follows [19]:
For males aged 6–8 years, 9–11 years, 12–64 years, 65–74 years, and ≥ 75 years, the sodium AI values were established at 1,100 mg/day, 1,300 mg/day, 1,500 mg/day, 1,300 mg/day, and 1,100 mg/day, respectively. For females aged 6–8 years, 9–64 years, 65–74 years, and ≥ 75 years, the sodium AI values were established at 1,400 mg/day, 1,500 mg/day, 1,400 mg/day, and 1,100 mg/day, respectively. For children aged 1–2 years and 3–5 years, the AI for sodium was 800 mg/day and 1,000 mg/day, respectively, for both genders. The sodium AI for infants was estimated based on the sodium intakes from breastfeeding, and were determined to be 110 mg/day for infants aged 0–5 months, and 370 mg/day for infants aged 6–11 months (Supplementary Table 1).
The UL for sodium toxicity
In the 2020 KDRIs, no potential indicators for adverse toxicological effects of sodium were identified subsequent to reviewing the available evidence after excluding the association of sodium intake with chronic disease related indicators. Lethal levels of dietary sodium, primarily due to the ingestion of acute doses, have been previously reported [202122]. However, they were unsuitable for establishing a sodium UL since the levels did not necessarily reflect the toxicological effects of high sodium intake in our habitual diets. Furthermore, several sodium studies reported that sodium intakes affect the occurrence of headaches [232425]. However, since the evidence for sodium toxicity was insufficient to determine sodium toxicity risk, the UL for sodium was not established in the 2020 KDRIs. In fact, sodium UL for Koreans has been replaced by intake goal, set at 2,000 mg/day for adults since 2015 KDRIs. The sodium CDRR for reducing the risk of chronic disease is now included as a new category in the 2020 KDRIs; hence, the intake goal of dietary sodium could not be identified in the 2020 KDRIs.
The CDRR for sodium based on chronic disease risk reduction
A systematic literature review was thoroughly conducted to identify scientific evidence of the potential detrimental health effects of excessive intake of dietary sodium. The methods and results of the review are as follows.
Selection of studies for the systematic review
Randomized controlled trials, cohort studies, nested case-control studies, case-control studies, and cross-sectional studies on the relationship between sodium and the risk of several chronic diseases, published between January 2014 and December 2018, were identified using the PubMed (https://pubmed.ncbi.nlm.nih.gov) and Web of Science (https://www.webofknowledge.com) databases. The search keywords used were “salt,” “sodium intake,” “dietary sodium,” and “urinary sodium” for the independent variables, and “CVD,” “cerebrovascular disease,” “coronary heart disease,” “hypertension,” “BP,” “RAAS,” “obesity,” “BMI,” “osteoporosis,” “bone mineral density,” “bone mineral content,” “osteoporotic fracture,” “diabetes,” “chronic kidney disease,” “proteinuria,” “gastric cancer,” and “renal cancer” for dependent variables. Studies written in both Korean and English were included for this review.
Inclusion/exclusion criteria
Articles were extracted based on their titles and abstracts. The inclusion and exclusion criteria were as follows: 1) inclusion of only human studies, 2) in cases of multiple publications involving the same study population, only the most recent study was included, 3) reviews or meta-analyses were excluded. Using these criteria, the studies were reviewed independently by 2 reviewers, and initial disagreements between the reviewers were resolved by eventual consensus between them.
Data collection
The following information was collected from each study: author name, publication year, country, diseases examined, study design, study subjects (health status, life stage, age, and sex), confounding or effect-modifying variables, measures of sodium (dietary sodium intake or urinary sodium excretion), category of sodium intake, outcomes (level of incidence, and mortality and controls), adjusted relative risk/odds ratio with 95% confidence intervals, and trends (P).
Quality evaluation of the study
The quality of each study was evaluated using the Cochrane RoB 2.0 template and the STROBE checklist for intervention and cross-sectional studies, and the Newcastle-Ottawa scale for cohort, nested case-control, and case-control studies. Using these tools, the risk of bias (RoB) level was classified as “low,” “some concerns,” or “high” for each study. Moreover, the overall SoE was classified into grades I (strong), II (moderate), III (limited), and IV (grade not assignable), based on the criteria employed by the US Department of Agriculture’s Nutrition Evidence Library. These grading criteria include quality in relation to RoB, quantity (number of studies and participants), consistency of findings across studies, public health impact (directness and magnitude), and generalizability (references). To establish the sodium CDRR, the SoE for both the causal relationship between sodium intake and chronic disease indicators and their intake–response relationship should be at least moderate, using the Grading of Recommendations, Assessment, Development, and Evaluation (GRADE) system [11].
Results of the systematic literature review
A total of 1,033 articles were identified via the initial computerized literature search. Based on the titles and abstracts of the articles, 248 articles were selected independently by the 2 reviewers. Randomized controlled trials, cohort studies, nested case-control studies, case-control studies, and cross-sectional studies were selected, whereas reviews or meta-analyses were excluded. Moreover, multiple publications that included the same population, insufficient study population, or unhealthy subjects, were excluded. Finally, through a full text review of the remaining articles, 43 studies (7 randomized controlled trials, 18 cohort studies, 3 nested case-control studies, and 15 cross-sectional study) were included for evaluating the RoB and SoE of the harmful effects of sodium intake levels on several chronic diseases (Fig. 2 and Table 1). Details of the eligible studies for the systematic review are presented in Tables 2 and 3, Supplementary Tables 2 and 3. We found that SoE of the relationship between dietary sodium and CVD, cerebrovascular disease, hypertension, and their surrogate marker systolic/diastolic BP, was at least moderate. Specifically, there was strong evidence for BP lowering the effect of sodium. Furthermore, there was a moderate SoE for the intake–response relationship between sodium intake and the risk of CVD or cerebrovascular disease. However, evidence associating sodium intake with the risk of coronary heart disease, cancer, bone mineral density, RAAS, and obesity were insufficient (limited or grade not assignable) (Table 4).
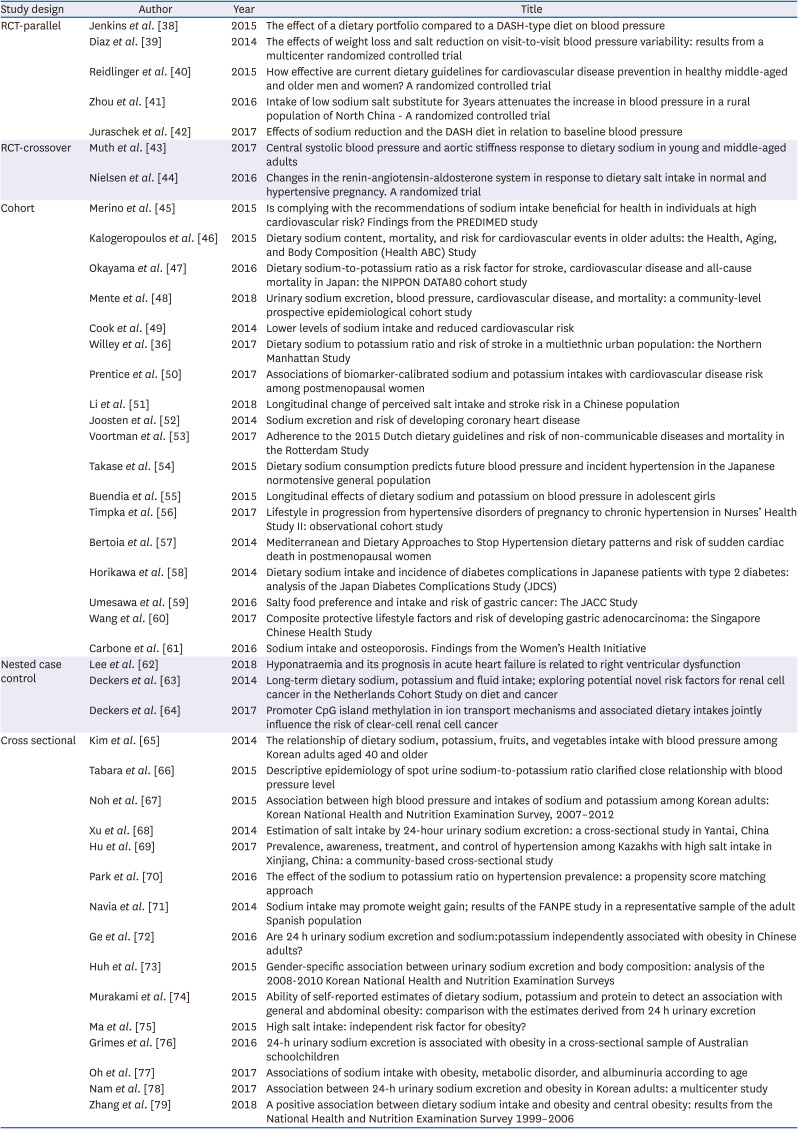
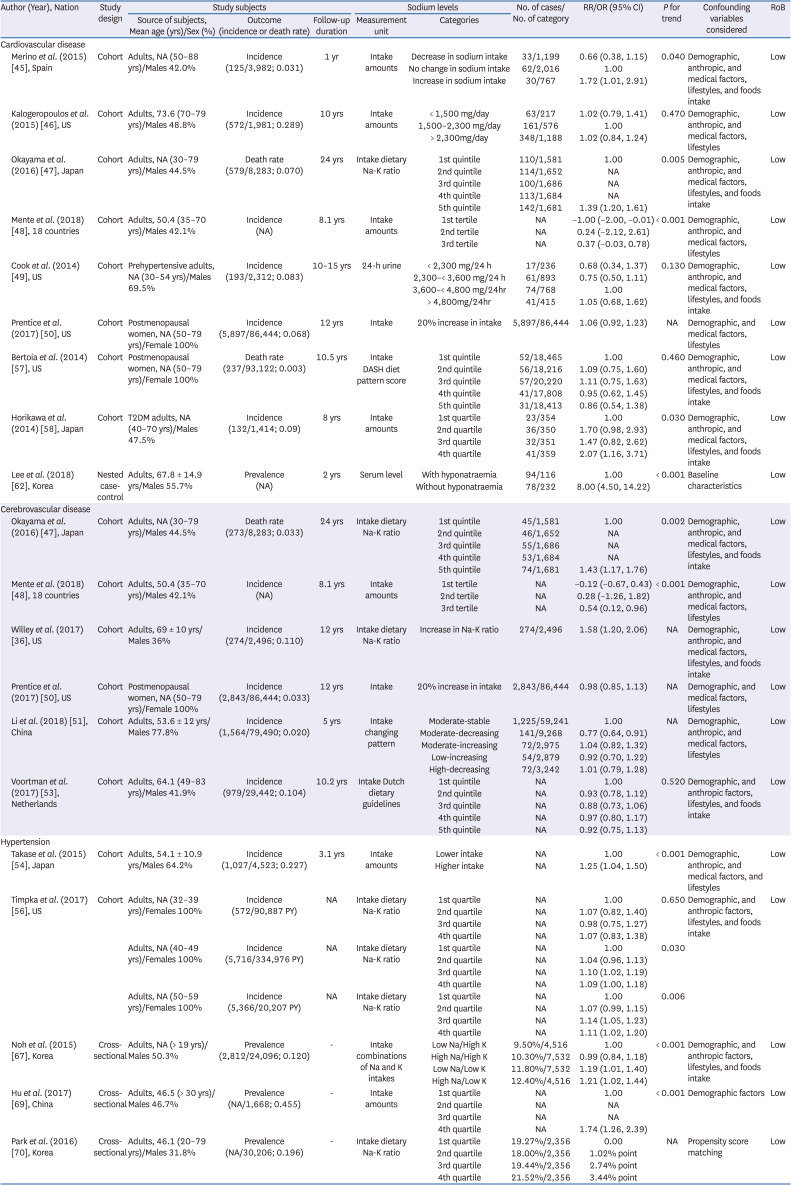
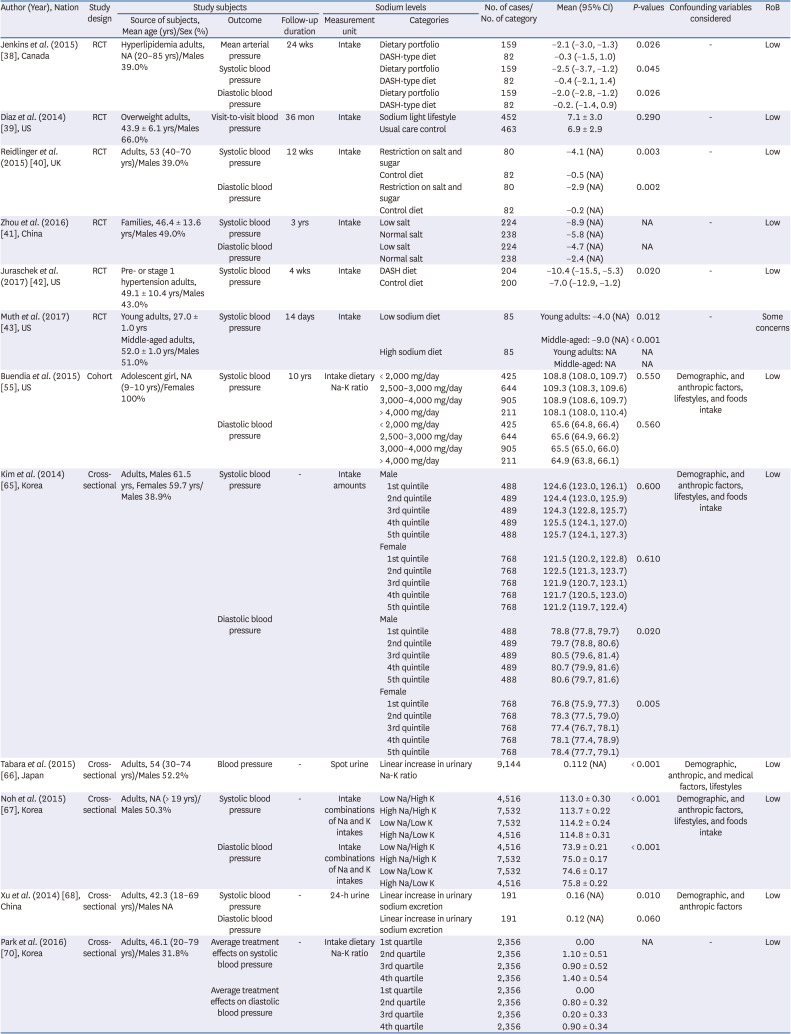
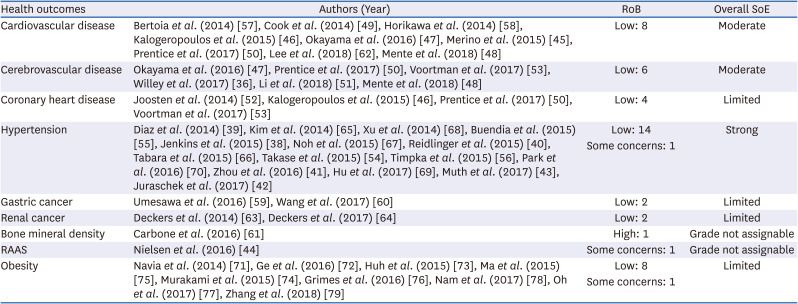
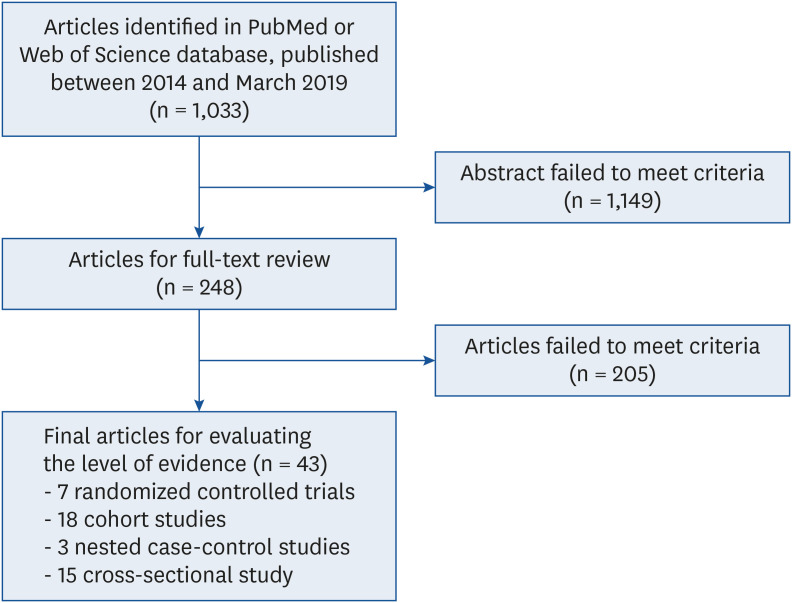
Table 1
List of studies included in the systemic literature review
| Study design | Author | Year | Title |
|---|---|---|---|
| RCT-parallel | Jenkins et al. [38] | 2015 | The effect of a dietary portfolio compared to a DASH-type diet on blood pressure |
| Diaz et al. [39] | 2014 | The effects of weight loss and salt reduction on visit-to-visit blood pressure variability: results from a multicenter randomized controlled trial | |
| Reidlinger et al. [40] | 2015 | How effective are current dietary guidelines for cardiovascular disease prevention in healthy middle-aged and older men and women? A randomized controlled trial | |
| Zhou et al. [41] | 2016 | Intake of low sodium salt substitute for 3years attenuates the increase in blood pressure in a rural population of North China - A randomized controlled trial | |
| Juraschek et al. [42] | 2017 | Effects of sodium reduction and the DASH diet in relation to baseline blood pressure | |
| RCT-crossover | Muth et al. [43] | 2017 | Central systolic blood pressure and aortic stiffness response to dietary sodium in young and middle-aged adults |
| Nielsen et al. [44] | 2016 | Changes in the renin-angiotensin-aldosterone system in response to dietary salt intake in normal and hypertensive pregnancy. A randomized trial | |
| Cohort | Merino et al. [45] | 2015 | Is complying with the recommendations of sodium intake beneficial for health in individuals at high cardiovascular risk? Findings from the PREDIMED study |
| Kalogeropoulos et al. [46] | 2015 | Dietary sodium content, mortality, and risk for cardiovascular events in older adults: the Health, Aging, and Body Composition (Health ABC) Study | |
| Okayama et al. [47] | 2016 | Dietary sodium-to-potassium ratio as a risk factor for stroke, cardiovascular disease and all-cause mortality in Japan: the NIPPON DATA80 cohort study | |
| Mente et al. [48] | 2018 | Urinary sodium excretion, blood pressure, cardiovascular disease, and mortality: a community-level prospective epidemiological cohort study | |
| Cook et al. [49] | 2014 | Lower levels of sodium intake and reduced cardiovascular risk | |
| Willey et al. [36] | 2017 | Dietary sodium to potassium ratio and risk of stroke in a multiethnic urban population: the Northern Manhattan Study | |
| Prentice et al. [50] | 2017 | Associations of biomarker-calibrated sodium and potassium intakes with cardiovascular disease risk among postmenopausal women | |
| Li et al. [51] | 2018 | Longitudinal change of perceived salt intake and stroke risk in a Chinese population | |
| Joosten et al. [52] | 2014 | Sodium excretion and risk of developing coronary heart disease | |
| Voortman et al. [53] | 2017 | Adherence to the 2015 Dutch dietary guidelines and risk of non-communicable diseases and mortality in the Rotterdam Study | |
| Takase et al. [54] | 2015 | Dietary sodium consumption predicts future blood pressure and incident hypertension in the Japanese normotensive general population | |
| Buendia et al. [55] | 2015 | Longitudinal effects of dietary sodium and potassium on blood pressure in adolescent girls | |
| Timpka et al. [56] | 2017 | Lifestyle in progression from hypertensive disorders of pregnancy to chronic hypertension in Nurses’ Health Study II: observational cohort study | |
| Bertoia et al. [57] | 2014 | Mediterranean and Dietary Approaches to Stop Hypertension dietary patterns and risk of sudden cardiac death in postmenopausal women | |
| Horikawa et al. [58] | 2014 | Dietary sodium intake and incidence of diabetes complications in Japanese patients with type 2 diabetes: analysis of the Japan Diabetes Complications Study (JDCS) | |
| Umesawa et al. [59] | 2016 | Salty food preference and intake and risk of gastric cancer: The JACC Study | |
| Wang et al. [60] | 2017 | Composite protective lifestyle factors and risk of developing gastric adenocarcinoma: the Singapore Chinese Health Study | |
| Carbone et al. [61] | 2016 | Sodium intake and osteoporosis. Findings from the Women’s Health Initiative | |
| Nested case control | Lee et al. [62] | 2018 | Hyponatraemia and its prognosis in acute heart failure is related to right ventricular dysfunction |
| Deckers et al. [63] | 2014 | Long-term dietary sodium, potassium and fluid intake; exploring potential novel risk factors for renal cell cancer in the Netherlands Cohort Study on diet and cancer | |
| Deckers et al. [64] | 2017 | Promoter CpG island methylation in ion transport mechanisms and associated dietary intakes jointly influence the risk of clear-cell renal cell cancer | |
| Cross sectional | Kim et al. [65] | 2014 | The relationship of dietary sodium, potassium, fruits, and vegetables intake with blood pressure among Korean adults aged 40 and older |
| Tabara et al. [66] | 2015 | Descriptive epidemiology of spot urine sodium-to-potassium ratio clarified close relationship with blood pressure level | |
| Noh et al. [67] | 2015 | Association between high blood pressure and intakes of sodium and potassium among Korean adults: Korean National Health and Nutrition Examination Survey, 2007–2012 | |
| Xu et al. [68] | 2014 | Estimation of salt intake by 24-hour urinary sodium excretion: a cross-sectional study in Yantai, China | |
| Hu et al. [69] | 2017 | Prevalence, awareness, treatment, and control of hypertension among Kazakhs with high salt intake in Xinjiang, China: a community-based cross-sectional study | |
| Park et al. [70] | 2016 | The effect of the sodium to potassium ratio on hypertension prevalence: a propensity score matching approach | |
| Navia et al. [71] | 2014 | Sodium intake may promote weight gain; results of the FANPE study in a representative sample of the adult Spanish population | |
| Ge et al. [72] | 2016 | Are 24 h urinary sodium excretion and sodium:potassium independently associated with obesity in Chinese adults? | |
| Huh et al. [73] | 2015 | Gender-specific association between urinary sodium excretion and body composition: analysis of the 2008-2010 Korean National Health and Nutrition Examination Surveys | |
| Murakami et al. [74] | 2015 | Ability of self-reported estimates of dietary sodium, potassium and protein to detect an association with general and abdominal obesity: comparison with the estimates derived from 24 h urinary excretion | |
| Ma et al. [75] | 2015 | High salt intake: independent risk factor for obesity? | |
| Grimes et al. [76] | 2016 | 24-h urinary sodium excretion is associated with obesity in a cross-sectional sample of Australian schoolchildren | |
| Oh et al. [77] | 2017 | Associations of sodium intake with obesity, metabolic disorder, and albuminuria according to age | |
| Nam et al. [78] | 2017 | Association between 24-h urinary sodium excretion and obesity in Korean adults: a multicenter study | |
| Zhang et al. [79] | 2018 | A positive association between dietary sodium intake and obesity and central obesity: results from the National Health and Nutrition Examination Survey 1999–2006 |
![]()
Table 2
Association between sodium levels and the risk of chronic diseases (event outcomes)
| Author (Year), Nation | Study design | Study subjects | Sodium levels | No. of cases/No. of category | RR/OR (95% CI) | P for trend | Confounding variables considered | RoB | ||||
|---|---|---|---|---|---|---|---|---|---|---|---|---|
| Source of subjects, Mean age (yrs)/Sex (%) | Outcome (incidence or death rate) | Follow-up duration | Measurement unit | Categories | ||||||||
| Cardiovascular disease | ||||||||||||
| Merino et al. (2015) [45], Spain | Cohort | Adults, NA (50–88 yrs)/Males 42.0% | Incidence (125/3,982; 0.031) | 1 yr | Intake amounts | Decrease in sodium intake | 33/1,199 | 0.66 (0.38, 1.15) | 0.040 | Demographic, anthropic, and medical factors, lifestyles, and foods intake | Low | |
| No change in sodium intake | 62/2,016 | 1.00 | ||||||||||
| Increase in sodium intake | 30/767 | 1.72 (1.01, 2.91) | ||||||||||
| Kalogeropoulos et al. (2015) [46], US | Cohort | Adults, 73.6 (70–79 yrs)/Males 48.8% | Incidence (572/1,981; 0.289) | 10 yrs | Intake amounts | < 1,500 mg/day | 63/217 | 1.02 (0.79, 1.41) | 0.470 | Demographic, anthropic, and medical factors, lifestyles | Low | |
| 1,500–2,300 mg/day | 161/576 | 1.00 | ||||||||||
| > 2,300mg/day | 348/1,188 | 1.02 (0.84, 1.24) | ||||||||||
| Okayama et al. (2016) [47], Japan | Cohort | Adults, NA (30–79 yrs)/Males 44.5% | Death rate (579/8,283; 0.070) | 24 yrs | Intake dietary Na-K ratio | 1st quintile | 110/1,581 | 1.00 | 0.005 | Demographic, anthropic, and medical factors, lifestyles, and foods intake | Low | |
| 2nd quintile | 114/1,652 | NA | ||||||||||
| 3rd quintile | 100/1,686 | NA | ||||||||||
| 4th quintile | 113/1,684 | NA | ||||||||||
| 5th quintile | 142/1,681 | 1.39 (1.20, 1.61) | ||||||||||
| Mente et al. (2018) [48], 18 countries | Cohort | Adults, 50.4 (35–70 yrs)/Males 42.1% | Incidence (NA) | 8.1 yrs | Intake amounts | 1st tertile | NA | −1.00 (−2.00, −0.01) | < 0.001 | Demographic, anthropic, and medical factors, lifestyles | Low | |
| 2nd tertile | NA | 0.24 (−2.12, 2.61) | ||||||||||
| 3rd tertile | NA | 0.37 (−0.03, 0.78) | ||||||||||
| Cook et al. (2014) [49], US | Cohort | Prehypertensive adults, NA (30–54 yrs)/Males 69.5% | Incidence (193/2,312; 0.083) | 10–15 yrs | 24-h urine | < 2,300 mg/24 h | 17/236 | 0.68 (0.34, 1.37) | 0.130 | Demographic, anthropic, and medical factors, lifestyles, and foods intake | Low | |
| 2,300–< 3,600 mg/24 h | 61/893 | 0.75 (0.50, 1.11) | ||||||||||
| 3,600–< 4,800 mg/24hr | 74/768 | 1.00 | ||||||||||
| > 4,800mg/24hr | 41/415 | 1.05 (0.68, 1.62) | ||||||||||
| Prentice et al. (2017) [50], US | Cohort | Postmenopausal women, NA (50–79 yrs)/Female 100% | Incidence (5,897/86,444; 0.068) | 12 yrs | Intake | 20% increase in intake | 5,897/86,444 | 1.06 (0.92, 1.23) | NA | Demographic, and medical factors, lifestyles | Low | |
| Bertoia et al. (2014) [57], US | Cohort | Postmenopausal women, NA (50–79 yrs)/Female 100% | Death rate (237/93,122; 0.003) | 10.5 yrs | Intake | 1st quintile | 52/18,465 | 1.00 | 0.460 | Demographic, anthropic, and medical factors, lifestyles, and foods intake | Low | |
| DASH diet pattern score | 2nd quintile | 56/18,216 | 1.09 (0.75, 1.60) | |||||||||
| 3rd quintile | 57/20,220 | 1.11 (0.75, 1.63) | ||||||||||
| 4th quintile | 41/17,808 | 0.95 (0.62, 1.45) | ||||||||||
| 5th quintile | 31/18,413 | 0.86 (0.54, 1.38) | ||||||||||
| Horikawa et al. (2014) [58], Japan | Cohort | T2DM adults, NA (40–70 yrs)/Males 47.5% | Incidence (132/1,414; 0.09) | 8 yrs | Intake amounts | 1st quartile | 23/354 | 1.00 | 0.030 | Demographic, anthropic, and medical factors, lifestyles, and foods intake | Low | |
| 2nd quartile | 36/350 | 1.70 (0.98, 2.93) | ||||||||||
| 3rd quartile | 32/351 | 1.47 (0.82, 2.62) | ||||||||||
| 4th quartile | 41/359 | 2.07 (1.16, 3.71) | ||||||||||
| Lee et al. (2018) [62], Korea | Nested case-control | Adults, 67.8 ± 14.9 yrs/Males 55.7% | Prevalence (NA) | 2 yrs | Serum level | With hyponatraemia | 94/116 | 1.00 | < 0.001 | Baseline characteristics | Low | |
| Without hyponatraemia | 78/232 | 8.00 (4.50, 14.22) | ||||||||||
| Cerebrovascular disease | ||||||||||||
| Okayama et al. (2016) [47], Japan | Cohort | Adults, NA (30–79 yrs)/Males 44.5% | Death rate (273/8,283; 0.033) | 24 yrs | Intake dietary Na-K ratio | 1st quintile | 45/1,581 | 1.00 | 0.002 | Demographic, anthropic, and medical factors, lifestyles, and foods intake | Low | |
| 2nd quintile | 46/1,652 | NA | ||||||||||
| 3rd quintile | 55/1,686 | NA | ||||||||||
| 4th quintile | 53/1,684 | NA | ||||||||||
| 5th quintile | 74/1,681 | 1.43 (1.17, 1.76) | ||||||||||
| Mente et al. (2018) [48], 18 countries | Cohort | Adults, 50.4 (35–70 yrs)/Males 42.1% | Incidence (NA) | 8.1 yrs | Intake amounts | 1st tertile | NA | −0.12 (−0.67, 0.43) | < 0.001 | Demographic, anthropic, and medical factors, lifestyles | Low | |
| 2nd tertile | NA | 0.28 (−1.26, 1.82) | ||||||||||
| 3rd tertile | NA | 0.54 (0.12, 0.96) | ||||||||||
| Willey et al. (2017) [36], US | Cohort | Adults, 69 ± 10 yrs/Males 36% | Incidence (274/2,496; 0.110) | 12 yrs | Intake dietary Na-K ratio | Increase in Na-K ratio | 274/2,496 | 1.58 (1.20, 2.06) | NA | Demographic, anthropic, and medical factors, lifestyles, and foods intake | Low | |
| Prentice et al. (2017) [50], US | Cohort | Postmenopausal women, NA (50–79 yrs)/Female 100% | Incidence (2,843/86,444; 0.033) | 12 yrs | Intake | 20% increase in intake | 2,843/86,444 | 0.98 (0.85, 1.13) | NA | Demographic, and medical factors, lifestyles | Low | |
| Li et al. (2018) [51], China | Cohort | Adults, 53.6 ± 12 yrs/Males 77.8% | Incidence (1,564/79,490; 0.020) | 5 yrs | Intake changing pattern | Moderate-stable | 1,225/59,241 | 1.00 | NA | Demographic, anthropic, and medical factors, lifestyles | Low | |
| Moderate-decreasing | 141/9,268 | 0.77 (0.64, 0.91) | ||||||||||
| Moderate-increasing | 72/2,975 | 1.04 (0.82, 1.32) | ||||||||||
| Low-increasing | 54/2,879 | 0.92 (0.70, 1.22) | ||||||||||
| High-decreasing | 72/3,242 | 1.01 (0.79, 1.28) | ||||||||||
| Voortman et al. (2017) [53], Netherlands | Cohort | Adults, 64.1 (49–83 yrs)/Males 41.9% | Incidence (979/29,442; 0.104) | 10.2 yrs | Intake Dutch dietary guidelines | 1st quintile | NA | 1.00 | 0.520 | Demographic, and anthropic factors, lifestyles, and foods intake | Low | |
| 2nd quintile | NA | 0.93 (0.78, 1.12) | ||||||||||
| 3rd quintile | NA | 0.88 (0.73, 1.06) | ||||||||||
| 4th quintile | NA | 0.97 (0.80, 1.17) | ||||||||||
| 5th quintile | NA | 0.92 (0.75, 1.13) | ||||||||||
| Hypertension | ||||||||||||
| Takase et al. (2015) [54], Japan | Cohort | Adults, 54.1 ± 10.9 yrs/Males 64.2% | Incidence (1,027/4,523; 0.227) | 3.1 yrs | Intake amounts | Lower intake | NA | 1.00 | < 0.001 | Demographic, anthropic, and medical factors, and lifestyles | Low | |
| Higher intake | NA | 1.25 (1.04, 1.50) | ||||||||||
| Timpka et al. (2017) [56], US | Cohort | Adults, NA (32–39 yrs)/Females 100% | Incidence (572/90,887 PY) | NA | Intake dietary Na-K ratio | 1st quartile | NA | 1.00 | 0.650 | Demographic, and anthropic factors, lifestyles, and foods intake | Low | |
| 2nd quartile | NA | 1.07 (0.82, 1.40) | ||||||||||
| 3rd quartile | NA | 0.98 (0.75, 1.27) | ||||||||||
| 4th quartile | NA | 1.07 (0.83, 1.38) | ||||||||||
| Adults, NA (40–49 yrs)/Females 100% | Incidence (5,716/334,976 PY) | NA | Intake dietary Na-K ratio | 1st quartile | NA | 1.00 | 0.030 | |||||
| 2nd quartile | NA | 1.04 (0.96, 1.13) | ||||||||||
| 3rd quartile | NA | 1.10 (1.02, 1.19) | ||||||||||
| 4th quartile | NA | 1.09 (1.00, 1.18) | ||||||||||
| Adults, NA (50–59 yrs)/Females 100% | Incidence (5,366/20,207 PY) | NA | Intake dietary Na-K ratio | 1st quartile | NA | 1.00 | 0.006 | |||||
| 2nd quartile | NA | 1.07 (0.99, 1.15) | ||||||||||
| 3rd quartile | NA | 1.14 (1.05, 1.23) | ||||||||||
| 4th quartile | NA | 1.11 (1.02, 1.20) | ||||||||||
| Noh et al. (2015) [67], Korea | Cross-sectional | Adults, NA (> 19 yrs)/Males 50.3% | Prevalence (2,812/24,096; 0.120) | - | Intake combinations of Na and K intakes | Low Na/High K | 9.50%/4,516 | 1.00 | < 0.001 | Demographic, and anthropic factors, lifestyles, and foods intake | Low | |
| High Na/High K | 10.30%/7,532 | 0.99 (0.84, 1.18) | ||||||||||
| Low Na/Low K | 11.80%/7,532 | 1.19 (1.01, 1.40) | ||||||||||
| High Na/Low K | 12.40%/4,516 | 1.21 (1.02, 1.44) | ||||||||||
| Hu et al. (2017) [69], China | Cross-sectional | Adults, 46.5 (> 30 yrs)/Males 46.7% | Prevalence (NA/1,668; 0.455) | - | Intake amounts | 1st quartile | NA | 1.00 | < 0.001 | Demographic factors | Low | |
| 2nd quartile | NA | NA | ||||||||||
| 3rd quartile | NA | NA | ||||||||||
| 4th quartile | NA | 1.74 (1.26, 2.39) | ||||||||||
| Park et al. (2016) [70], Korea | Cross-sectional | Adults, 46.1 (20–79 yrs)/Males 31.8% | Prevalence (NA/30,206; 0.196) | - | Intake dietary Na-K ratio | 1st quartile | 19.27%/2,356 | 0.00 | NA | Propensity score matching | Low | |
| 2nd quartile | 18.00%/2,356 | 1.02% point | ||||||||||
| 3rd quartile | 19.44%/2,356 | 2.74% point | ||||||||||
| 4th quartile | 21.52%/2,356 | 3.44% point | ||||||||||
A moderate to strong strength of evidence was determined for the relationship between sodium and cardiovascular disease, cerebrovascular disease, and hypertension.
RR, relative risk; OR, odds ratio; CI, confidence interval; RoB, risk of bias; NA, not available; PY, person years; T2DM, type 2 diabetes mellitus.
![]()
Table 3
Association between sodium levels and the risk of chronic diseases (continuous outcomes): hypertension
| Author (Year), Nation | Study design | Study subjects | Sodium levels | No. of cases/No. of category | Mean (95% CI) | P-values | Confounding variables considered | RoB | ||||
|---|---|---|---|---|---|---|---|---|---|---|---|---|
| Source of subjects, Mean age (yrs)/Sex (%) | Outcome | Follow-up duration | Measurement unit | Categories | ||||||||
| Jenkins et al. (2015) [38], Canada | RCT | Hyperlipidemia adults, NA (20–85 yrs)/Males 39.0% | Mean arterial pressure | 24 wks | Intake | Dietary portfolio | 159 | −2.1 (−3.0, −1.3) | 0.026 | - | Low | |
| DASH-type diet | 82 | −0.3 (−1.5, 1.0) | ||||||||||
| Systolic blood pressure | Dietary portfolio | 159 | −2.5 (−3.7, −1.2) | 0.045 | ||||||||
| DASH-type diet | 82 | −0.4 (−2.1, 1.4) | ||||||||||
| Diastolic blood pressure | Dietary portfolio | 159 | −2.0 (−2.8, −1.2) | 0.026 | ||||||||
| DASH-type diet | 82 | −0.2. (−1.4, 0.9) | ||||||||||
| Diaz et al. (2014) [39], US | RCT | Overweight adults, 43.9 ± 6.1 yrs/Males 66.0% | Visit-to-visit blood pressure | 36 mon | Intake | Sodium light lifestyle | 452 | 7.1 ± 3.0 | 0.290 | - | Low | |
| Usual care control | 463 | 6.9 ± 2.9 | ||||||||||
| Reidlinger et al. (2015) [40], UK | RCT | Adults, 53 (40–70 yrs)/Males 39.0% | Systolic blood pressure | 12 wks | Intake | Restriction on salt and sugar | 80 | −4.1 (NA) | 0.003 | - | Low | |
| Control diet | 82 | −0.5 (NA) | ||||||||||
| Diastolic blood pressure | Restriction on salt and sugar | 80 | −2.9 (NA) | 0.002 | ||||||||
| Control diet | 82 | −0.2 (NA) | ||||||||||
| Zhou et al. (2016) [41], China | RCT | Families, 46.4 ± 13.6 yrs/Males 49.0% | Systolic blood pressure | 3 yrs | Intake | Low salt | 224 | −8.9 (NA) | NA | - | Low | |
| Normal salt | 238 | −5.8 (NA) | ||||||||||
| Diastolic blood pressure | Low salt | 224 | −4.7 (NA) | NA | ||||||||
| Normal salt | 238 | −2.4 (NA) | ||||||||||
| Juraschek et al. (2017) [42], US | RCT | Pre- or stage 1 hypertension adults, 49.1 ± 10.4 yrs/Males 43.0% | Systolic blood pressure | 4 wks | Intake | DASH diet | 204 | −10.4 (−15.5, −5.3) | 0.020 | - | Low | |
| Control diet | 200 | −7.0 (−12.9, −1.2) | ||||||||||
| Muth et al. (2017) [43], US | RCT | Young adults, 27.0 ± 1.0 yrs | Systolic blood pressure | 14 days | Intake | Low sodium diet | 85 | Young adults: −4.0 (NA) | 0.012 | - | Some concerns | |
| Middle-aged adults, 52.0 ± 1.0 yrs/Males 51.0% | Middle-aged: −9.0 (NA) | < 0.001 | ||||||||||
| High sodium diet | 85 | Young adults: NA | NA | |||||||||
| Middle-aged: NA | NA | |||||||||||
| Buendia et al. (2015) [55], US | Cohort | Adolescent girl, NA (9–10 yrs)/Females 100% | Systolic blood pressure | 10 yrs | Intake dietary Na-K ratio | < 2,000 mg/day | 425 | 108.8 (108.0, 109.7) | 0.550 | Demographic, and anthropic factors, lifestyles, and foods intake | Low | |
| 2,500–3,000 mg/day | 644 | 109.3 (108.3, 109.6) | ||||||||||
| 3,000–4,000 mg/day | 905 | 108.9 (108.6, 109.7) | ||||||||||
| > 4,000 mg/day | 211 | 108.1 (108.0, 110.4) | ||||||||||
| Diastolic blood pressure | < 2,000 mg/day | 425 | 65.6 (64.8, 66.4) | 0.560 | ||||||||
| 2,500–3,000 mg/day | 644 | 65.6 (64.9, 66.2) | ||||||||||
| 3,000–4,000 mg/day | 905 | 65.5 (65.0, 66.0) | ||||||||||
| > 4,000 mg/day | 211 | 64.9 (63.8, 66.1) | ||||||||||
| Kim et al. (2014) [65], Korea | Cross-sectional | Adults, Males 61.5 yrs, Females 59.7 yrs/Males 38.9% | Systolic blood pressure | - | Intake amounts | Male | Demographic, and anthropic factors, lifestyles, and foods intake | Low | ||||
| 1st quintile | 488 | 124.6 (123.0, 126.1) | 0.600 | |||||||||
| 2nd quintile | 489 | 124.4 (123.0, 125.9) | ||||||||||
| 3rd quintile | 489 | 124.3 (122.8, 125.7) | ||||||||||
| 4th quintile | 489 | 125.5 (124.1, 127.0) | ||||||||||
| 5th quintile | 488 | 125.7 (124.1, 127.3) | ||||||||||
| Female | ||||||||||||
| 1st quintile | 768 | 121.5 (120.2, 122.8) | 0.610 | |||||||||
| 2nd quintile | 768 | 122.5 (121.3, 123.7) | ||||||||||
| 3rd quintile | 768 | 121.9 (120.7, 123.1) | ||||||||||
| 4th quintile | 768 | 121.7 (120.5, 123.0) | ||||||||||
| 5th quintile | 768 | 121.2 (119.7, 122.4) | ||||||||||
| Diastolic blood pressure | Male | |||||||||||
| 1st quintile | 488 | 78.8 (77.8, 79.7) | 0.020 | |||||||||
| 2nd quintile | 489 | 79.7 (78.8, 80.6) | ||||||||||
| 3rd quintile | 489 | 80.5 (79.6, 81.4) | ||||||||||
| 4th quintile | 489 | 80.7 (79.9, 81.6) | ||||||||||
| 5th quintile | 488 | 80.6 (79.7, 81.6) | ||||||||||
| Female | ||||||||||||
| 1st quintile | 768 | 76.8 (75.9, 77.3) | 0.005 | |||||||||
| 2nd quintile | 768 | 78.3 (77.5, 79.0) | ||||||||||
| 3rd quintile | 768 | 77.4 (76.7, 78.1) | ||||||||||
| 4th quintile | 768 | 78.1 (77.4, 78.9) | ||||||||||
| 5th quintile | 768 | 78.4 (77.7, 79.1) | ||||||||||
| Tabara et al. (2015) [66], Japan | Cross-sectional | Adults, 54 (30–74 yrs)/Males 52.2% | Blood pressure | - | Spot urine | Linear increase in urinary Na-K ratio | 9,144 | 0.112 (NA) | < 0.001 | Demographic, anthropic, and medical factors, lifestyles | Low | |
| Noh et al. (2015) [67], Korea | Cross-sectional | Adults, NA (> 19 yrs)/Males 50.3% | Systolic blood pressure | - | Intake combinations of Na and K intakes | Low Na/High K | 4,516 | 113.0 ± 0.30 | < 0.001 | Demographic, and anthropic factors, lifestyles, and foods intake | Low | |
| High Na/High K | 7,532 | 113.7 ± 0.22 | ||||||||||
| Low Na/Low K | 7,532 | 114.2 ± 0.24 | ||||||||||
| High Na/Low K | 4,516 | 114.8 ± 0.31 | ||||||||||
| Diastolic blood pressure | Intake combinations of Na and K intakes | Low Na/High K | 4,516 | 73.9 ± 0.21 | < 0.001 | |||||||
| High Na/High K | 7,532 | 75.0 ± 0.17 | ||||||||||
| Low Na/Low K | 7,532 | 74.6 ± 0.17 | ||||||||||
| High Na/Low K | 4,516 | 75.8 ± 0.22 | ||||||||||
| Xu et al. (2014) [68], China | Cross-sectional | Adults, 42.3 (18–69 yrs)/Males NA | Systolic blood pressure | - | 24-h urine | Linear increase in urinary sodium excretion | 191 | 0.16 (NA) | 0.010 | Demographic, and anthropic factors | Low | |
| Diastolic blood pressure | Linear increase in urinary sodium excretion | 191 | 0.12 (NA) | 0.060 | ||||||||
| Park et al. (2016) [70], Korea | Cross-sectional | Adults, 46.1 (20–79 yrs)/Males 31.8% | Average treatment effects on systolic blood pressure | - | Intake dietary Na-K ratio | 1st quartile | 2,356 | 0.00 | NA | - | Low | |
| 2nd quartile | 2,356 | 1.10 ± 0.51 | ||||||||||
| 3rd quartile | 2,356 | 0.90 ± 0.52 | ||||||||||
| 4th quartile | 2,356 | 1.40 ± 0.54 | ||||||||||
| Average treatment effects on diastolic blood pressure | 1st quartile | 2,356 | 0.00 | |||||||||
| 2nd quartile | 2,356 | 0.80 ± 0.32 | ||||||||||
| 3rd quartile | 2,356 | 0.20 ± 0.33 | ||||||||||
| 4th quartile | 2,356 | 0.90 ± 0.34 | ||||||||||
Moderate to strong strength of evidence was determined for the relationship between sodium and hypertension.
CI, confidence interval; RoB, risk of bias; NA, not available; RCT, randomized controlled trial.
![]()
Table 4
Level of risk of bias and strength of evidence for the relationship between sodium intakes and chronic diseases
| Health outcomes | Authors (Year) | RoB | Overall SoE |
|---|---|---|---|
| Cardiovascular disease | Bertoia et al. (2014) [57], Cook et al. (2014) [49], Horikawa et al. (2014) [58], Kalogeropoulos et al. (2015) [46], Okayama et al. (2016) [47], Merino et al. (2015) [45], Prentice et al. (2017) [50], Lee et al. (2018) [62], Mente et al. (2018) [48] | Low: 8 | Moderate |
| Cerebrovascular disease | Okayama et al. (2016) [47], Prentice et al. (2017) [50], Voortman et al. (2017) [53], Willey et al. (2017) [36], Li et al. (2018) [51], Mente et al. (2018) [48] | Low: 6 | Moderate |
| Coronary heart disease | Joosten et al. (2014) [52], Kalogeropoulos et al. (2015) [46], Prentice et al. (2017) [50], Voortman et al. (2017) [53] | Low: 4 | Limited |
| Hypertension | Diaz et al. (2014) [39], Kim et al. (2014) [65], Xu et al. (2014) [68], Buendia et al. (2015) [55], Jenkins et al. (2015) [38], Noh et al. (2015) [67], Reidlinger et al. (2015) [40], Tabara et al. (2015) [66], Takase et al. (2015) [54], Timpka et al. (2015) [56], Park et al. (2016) [70], Zhou et al. (2016) [41], Hu et al. (2017) [69], Muth et al. (2017) [43], Juraschek et al. (2017) [42] | Low: 14 | Strong |
| Some concerns: 1 | |||
| Gastric cancer | Umesawa et al. (2016) [59], Wang et al. (2017) [60] | Low: 2 | Limited |
| Renal cancer | Deckers et al. (2014) [63], Deckers et al. (2017) [64] | Low: 2 | Limited |
| Bone mineral density | Carbone et al. (2016) [61] | High: 1 | Grade not assignable |
| RAAS | Nielsen et al. (2016) [44] | Some concerns: 1 | Grade not assignable |
| Obesity | Navia et al. (2014) [71], Ge et al. (2016) [72], Huh et al. (2015) [73], Ma et al. (2015) [75], Murakami et al. (2015) [74], Grimes et al. (2016) [76], Nam et al. (2017) [78], Oh et al. (2017) [77], Zhang et al. (2018) [79] | Low: 8 | Limited |
| Some concerns: 1 |
![]()
In a meta-analysis of 39 randomized clinical trials on the intake–response, there was a strong SoE that sodium reduction decreased the risk of CVD, hypertension, and systolic/diastolic BP in subjects with a sodium intake of 2,300–4,100 mg/day. In addition, there was a moderate SoE that sodium reduction in subjects with a sodium intake of 4,100–5,000 mg/day decreased the effect of systolic/diastolic BP. However, the SoE was weak for intake levels ≤ 2,300 mg/day [8]. Taken together, we concluded that there is a moderate-to-high SoE for reduced sodium intake decreasing the risk of CVD, hypertension, and BP in persons with sodium intake levels of 2,300–5,000 mg/day. Accordingly, the DRIs jointly developed by US and Canada set 2,300 mg/day as the CDRR of sodium for adults [8]. Based on a systematic review and the CDRR established in the DRIs for US and Canada, the 2020 KDRIs established the CDRR for sodium at 2,300 mg/day for Koreans aged 19–64 years. Moreover, the CDRR for sodium according to age, sex, and life-stage were extrapolated from the adult values by considering the energy intake involved, as follows [19]:
The sodium CDRR for children aged 1–2 years and 3–5 years was established as 1,200 mg/day and 1,600 mg/day, respectively, for both genders. The CDRR for children aged 6–8 years and 9–11 years was set at 1,800 mg/day and 2,000 mg/day for males, and 2,100 mg/day and 2,300 mg/day for females, respectively, and for adolescents aged 12–18 years the CDRR was set at 2,300 mg for both genders. For the elderly aged 65–74 years and ≥ 75 years, the sodium CDRR values were established as 1,900 mg/day and 1,800 mg/day for males, and 2,200 mg/day and 1,700 mg/day for females, respectively (Supplementary Table 1).
INTAKE ASSESSMENT TO CHARACTERIZE RISK
Currently, majority of the populations are reported to consume dietary sodium above the recommended WHO levels [7], while countries consuming less than 2,000 mg of sodium per day are the poor with malnutrition problems [26]. Especially in Asian countries, the mean sodium intakes are higher than 4,600 mg/day [27]. According to the 2019 KNHANES, the average daily sodium intake was 3,287 mg/day (males, 3,851 mg/day; females, 2,699 mg/day) in South Korea, and the percentage of excessive sodium intake of ≥ 2,000 mg/day was 74.0% (84.5% for males and 63.5% for females) among Koreans aged ≥ 9 years [28]. In both developed and developing countries, including South Korea, where various processed foods produced by the modern food supply system are consumed, the feasibility of achieving a sodium intake goal of 2,000 mg/day is constantly questioned. Therefore, it is necessary to set a flexible goal for sodium intake for Koreans, based on the eating habits and food system in this population. Considering the food sources of dietary sodium, the predominant sources of dietary sodium for the Korean population are reported to be salt and kimchi, followed by soy sauce, ramen and soybean paste [1329]. Moreover, the highest sodium source per serving was ramen (1,563 mg per serving), followed by salted seafood (jeotgal) (956 mg per serving), buckwheat noodles (891 mg per serving), and sandwich/hamburger/pizza (830 mg per serving) [1329].
PUBLIC HEALTH IMPLICATIONS AND SPECIAL CONSIDERATIONS
Contrary to the conventional idea that a lower sodium intake is healthy, recent studies have reported a U-shaped or J-shaped curve for the association between sodium intake and CVD risks, rather than a continuously increasing positive association [530]. Although there is a continuous positive linear relationship between sodium intake and BP, a sodium intake of < 3 g or > 7 g/d increases the risk of CVD in a U-shaped curve, when compared to an intake of 4–5 g/d [30]. Future studies on the effect of very low sodium intakes, and balance studies on adequate sodium intake, are required to establish the AI for sodium in the Korean population. It should be acknowledged that the absence of reference values of UL or intake goal for dietary sodium does not indicate that there are no adverse toxicological effects of excessive sodium intake. Rather, it means that there is a lack of evidence for the toxicological effects of sodium in healthy populations. Therefore, further studies using the toxicological risk assessment approach are needed in order to set the UL in the future.
It has also been reported that the ratio between dietary sodium and potassium (Na:K ratio) is associated with health outcomes [313233]. Specifically, a high Na:K ratio is reported to be associated with increased BP, and risk of hypertension and stroke [343536]. Despite national efforts of reducing sodium intake at the population level, the Na:K ratio remains high among Koreans (ratio of 2.20 in 2019) [37]. Therefore, a health policy that targets lowering of the Na:K ratio is needed to improve public health in the Korean population.
The main limitation is insufficient evidence necessary to assess the relationship between sodium intake and chronic diseases in the Korean population. However, there is considerable evidence worldwide, for understanding the association between sodium intake and chronic disease. Furthermore, a meta-analysis on intake–response conducted by the US committee studying the DRIs of sodium, included Japanese and Chinese studies. Therefore, the CDRR established by the US committee can be used as the provisional CDRR for Koreans. Considering the increasing prevalence of hypertension and CVDs in South Korea, establishing and promoting this CDRR would be beneficial. Further studies on the relationship between sodium intake and chronic diseases are required to establish the CDRR for sodium in the Korean population. Moreover, since the majority of Koreans consume sodium at levels above the CDRR, there is a need to find new solutions, including technological innovations, that can reduce sodium in the food supply and in consumption.
CONCLUSIONS
The 2020 KDRIs established the AI value for dietary sodium intake at 1,500 mg/day for adults aged 19–64 years, which is the same as in the 2015 KDRIs. Moreover, on the basis of a systematic review, the CDRR for sodium was set at 2,300 mg/day for adults aged 19–64 years as a new reference value, specific to chronic disease risk reduction. Intake goal for dietary sodium established in the 2015 KDRIs (instead of the UL) was not presented in the 2020 KDRIs. For the next revision of the KDRIs, further studies are required on sodium adequacy and toxicity, and their associations with chronic diseases, in the Korean population.
 XML Download