

 PDF
PDF Citation
 Print
Print


INTRODUCTION
Proteins are essential macronutrients for the human body, allowing both growth and maintenance. They provide amino acids to construct not only approximately 25,000 proteins encoded within the human genome, but also other nitrogen compounds required for the structural and functional system of the human body. The dietary requirement of proteins is based on the amount of protein and/or the constituent amino acids that need to be provided through the diet, to satisfy the metabolic demand and nitrogen equilibrium [1]. The current estimated average requirement (EAR) of protein as proposed in the Dietary Reference Intakes for Koreans (KDRIs) is based on the nitrogen balance approach as well as the factorial method for special needs for growth, pregnancy, and lactation [2].
The last two decades have seen a gradual increase in the average protein consumption in the Korean population [3]. According to the Korea National Health and Nutrition Examination Survey of 2013 to 2017, the average protein consumption of the Korean population is above the current EAR of protein, and even above the recommended nutrient intake in KDRIs for all age groups, except among the over 75 years elderly [2] (Table 1). Intriguingly, similar to increasing protein intake, there has also been an increase in the consumption of animal foods rich in proteins [4].
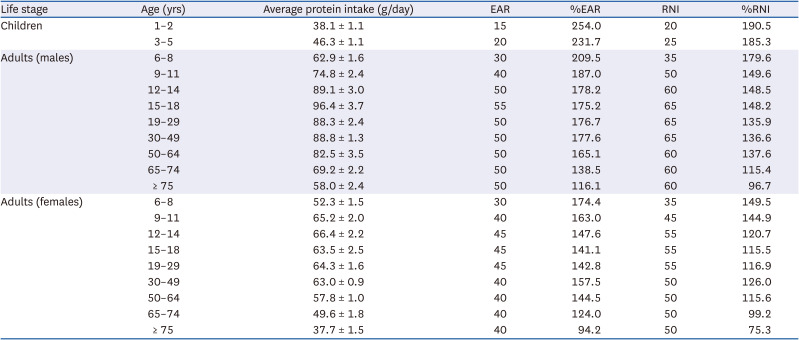
Table 1
Comparison of the 2020 Dietary Reference Intakes for Koreans of protein with the average daily protein intake estimated by the 2013–2017 Korea National Health and Nutrition Examination Survey by age group
![]()
Due to insufficient evidence based on scientific data, there has been substantial discussion about the validity and safety of high protein consumption. This study aims to review recent evidence published in 2014–2020 from human studies, focusing on adequate protein intake for the prevention of chronic diseases throughout the life cycle.
Go to : 
HIGH PROTEIN INTAKE IN EARLY LIFE AND OBESITY RISK
Protein intake in early life is critical for adequate development and growth. It has been established the adequate intake level of protein for infants in KDRIs based on the assumption that breastfeeding milk supplies enough protein for an infant’s adequate growth [2]. While clinical outcomes from protein deficiency have been well studied, the effects of early exposure to high protein diet during infancy have not been fully explored. Recent evidence indicates that infants on a high protein formula-fed diet in the first two years of life show greater weight gains and weight/length-for-age, as compared to breastmilk-fed infants (Table 2) [5678910]. Rapid weight gain during infancy is known to be a risk factor for obesity in later life [1112]. A European multicenter, double-blind, randomized controlled trial (RCT) study reported that high protein formula-fed infants in the first year of life showed higher body mass index (BMI) at 6 years of age than breastmilk-fed infants [9]. The results suggest that a lower protein formula reduces BMI and childhood obesity risk, potentially leading to reduced risks for adulthood obesity. This requires further investigations with long-term follow-ups.
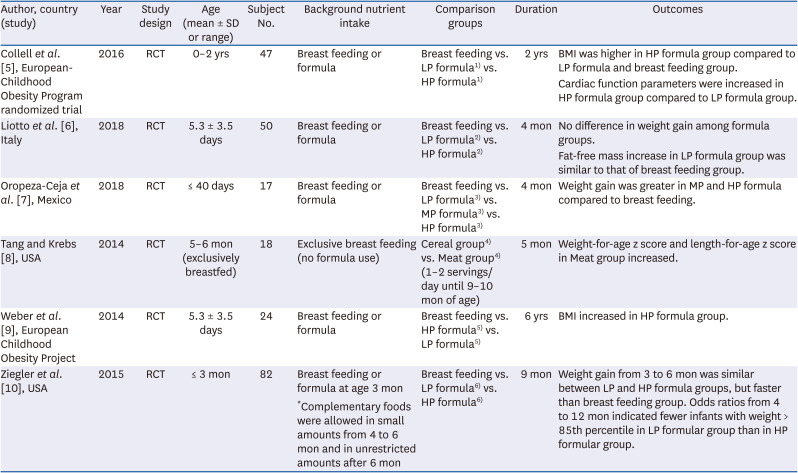
Table 2
Associations of development and growth with high protein formula intake in early life
| Author, country (study) | Year | Study design | Age (mean ± SD or range) | Subject No. | Background nutrient intake | Comparison groups | Duration | Outcomes |
|---|---|---|---|---|---|---|---|---|
| Collell et al. [5], European-Childhood Obesity Program randomized trial | 2016 | RCT | 0–2 yrs | 47 | Breast feeding or formula | Breast feeding vs. LP formula1) vs. HP formula1) | 2 yrs | BMI was higher in HP formula group compared to LP formula and breast feeding group. |
| Cardiac function parameters were increased in HP formula group compared to LP formula group. | ||||||||
| Liotto et al. [6], Italy | 2018 | RCT | 5.3 ± 3.5 days | 50 | Breast feeding or formula | Breast feeding vs. LP formula2) vs. HP formula2) | 4 mon | No difference in weight gain among formula groups. |
| Fat-free mass increase in LP formula group was similar to that of breast feeding group. | ||||||||
| Oropeza-Ceja et al. [7], Mexico | 2018 | RCT | ≤ 40 days | 17 | Breast feeding or formula | Breast feeding vs. LP formula3) vs. MP formula3) vs. HP formula3) | 4 mon | Weight gain was greater in MP and HP formula compared to breast feeding. |
| Tang and Krebs [8], USA | 2014 | RCT | 5–6 mon (exclusively breastfed) | 18 | Exclusive breast feeding (no formula use) | Cereal group4) vs. Meat group4) (1–2 servings/day until 9–10 mon of age) | 5 mon | Weight-for-age z score and length-for-age z score in Meat group increased. |
| Weber et al. [9], European Childhood Obesity Project | 2014 | RCT | 5.3 ± 3.5 days | 24 | Breast feeding or formula | Breast feeding vs. HP formula5) vs. LP formula5) | 6 yrs | BMI increased in HP formula group. |
| Ziegler et al. [10], USA | 2015 | RCT | ≤ 3 mon | 82 | Breast feeding or formula at age 3 mon | Breast feeding vs. LP formula6) vs. HP formula6) | 9 mon | Weight gain from 3 to 6 mon was similar between LP and HP formula groups, but faster than breast feeding group. Odds ratios from 4 to 12 mon indicated fewer infants with weight > 85th percentile in LP formular group than in HP formular group. |
| *Complementary foods were allowed in small amounts from 4 to 6 mon and in unrestricted amounts after 6 mon |
RCT, randomized controlled trial; BMI, body mass index; LP, low protein; MP, middle protein; HP, high protein.
1)LP formula: 1.25–1.6 g/100 mL; HP formula: 2.05–3.2 g/100 mL.
2)LP formula: 1.2 g/100 mL; HP formula: 1.7 g/100 mL.
3)LP formula: 1 g protein/dL with bovine alpha-lactalbumin, 26% of total protein; MP formula: 1.3 g/dL with bovine lactalbumin; HP formula: 1.5 g/dL with standard infant formula, which is based on cow’s milk proteins, adjusted by the addition of whey protein concentrates to more closely resemble the whey protein-to-casein ratio of human milk of proximately 65:35.
4)Cereal group: fortified infant cereals as the first complementary food; meat group: commercially prepared pureed meats.
5)LP formula: 1.25 g/dL and 1.6 g/dL protein for follow-up; HP formula: 2.05 g/dL and 3.2 g/dL protein for follow-up.
6)LP formula: 1.61 g/100 kcal (modified bovine whey proteins with caseinoglycomacropeptide removed); HP formula: 2.15 g/100 kcal (unmodified bovine milk protein with a whey/casein ratio of 60/40).
![]()
Go to :
HIGH PROTEIN INTAKE AND CARDIOVASCULAR DISEASE (CVD) IN ADULTHOOD
Metabolic outcomes of high protein consumption have been repeatedly reported [1314]. Excess protein intake is associated with an increased risk of metabolic disorders such as obesity and associated CVD. These associations are often, but not exclusively, speculated from indirect consequences of high protein consumption accompanied by high energy and animal fat intake. Recent RCTs have reported that high protein intake effectively reduces the biomarkers for CVD risk in healthy and obese adults [15161718]. It is noteworthy that these results are limited to either young healthy individuals with iso- or hypercaloric diets, or overweight and obese adults with hypocaloric diets [15161718]. Moreover, prospective cohorts and cross-sectional studies have shown inconsistent results associating protein intake as grams per day or energy percentage and CVD [192021222324]; this could probably be due to the varying ranges of cutoff for the level of intake or the percentage of energy. Further investigations are needed to fully understand the effect of protein intake on CVD risks with respect to the level of energy consumption and the protein proportion of total energy.
Go to :
ASSOCIATIONS OF PROTEIN SOURCES AND CVD
It was further observed that intake of animal and plant protein is associated with metabolic disease risk factors (Table 3). In general, the quality of protein varies depending on the composition of amino acids such as indispensable amino acid ratio and animal or plant food sources [25]. However, there is limited evidence to establish dietary reference intake of animal and plant protein for Koreans. The associations of animal and plant protein intake with metabolic diseases, such as CVD, were inconsistent. In several Western studies, plant protein intake had a beneficial effect on blood pressure, whereas animal protein intake had no significant effect on blood pressure [2627]. Conversely, in Japanese adults, animal protein intake had a stronger preventive effect on high blood pressure than plant protein intake [28].
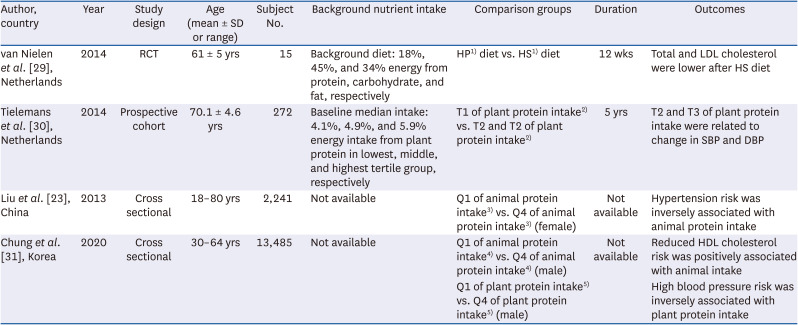
Table 3
Associations of animal and plant protein intake with cardiovascular disease
| Author, country | Year | Study design | Age (mean ± SD or range) | Subject No. | Background nutrient intake | Comparison groups | Duration | Outcomes |
|---|---|---|---|---|---|---|---|---|
| van Nielen et al. [29], Netherlands | 2014 | RCT | 61 ± 5 yrs | 15 | Background diet: 18%, 45%, and 34% energy from protein, carbohydrate, and fat, respectively | HP1) diet vs. HS1) diet | 12 wks | Total and LDL cholesterol were lower after HS diet |
| Tielemans et al. [30], Netherlands | 2014 | Prospective cohort | 70.1 ± 4.6 yrs | 272 | Baseline median intake: 4.1%, 4.9%, and 5.9% energy intake from plant protein in lowest, middle, and highest tertile group, respectively | T1 of plant protein intake2) vs. T2 and T2 of plant protein intake2) | 5 yrs | T2 and T3 of plant protein intake were related to change in SBP and DBP |
| Liu et al. [23], China | 2013 | Cross sectional | 18–80 yrs | 2,241 | Not available | Q1 of animal protein intake3) vs. Q4 of animal protein intake3) (female) | Not available | Hypertension risk was inversely associated with animal protein intake |
| Chung et al. [31], Korea | 2020 | Cross sectional | 30–64 yrs | 13,485 | Not available | Q1 of animal protein intake4) vs. Q4 of animal protein intake4) (male) | Not available | Reduced HDL cholesterol risk was positively associated with animal intake |
| Q1 of plant protein intake5) vs. Q4 of plant protein intake5) (male) | High blood pressure risk was inversely associated with plant protein intake |
RCT, randomized controlled trial; HP, high mixed protein; HS, high soy protein; LDL, low-density lipoprotein; SBP, systolic blood pressure; DBP, diastolic blood pressure; HDL, high-density lipoprotein.
1)HP diet: high protein diet of mixed, not soy sources (high protein mix, 1.6 g protein/kg/day); HS diet: high protein diet replacing meat with soy (high protein soy, 1.7 g protein/kg/day, 30 g/day soy).
2)T1: lowest tertile group, energy intake from plant protein 4.1%/day; T2 and T3: middle and highest tertile groups, energy intake from plant protein 4.9% and 5.9%/day, respectively (baseline median intake).
3)Q1: lowest quartile group, animal protein intake < 3.4 g/day; Q4: highest quartile group, animal protein intake > 11.3 g/day.
4)Q1: lowest quartile group, animal protein intake 11.4 ± 0.3 g/day; Q4: highest quartile group, animal protein intake 88.4 ± 1.3 g/day.
5)Q1: lowest quartile group, plant protein intake 22.2 ± 0.2 g/day; Q4: highest quartile group, plant protein intake 62.5 ± 0.4 g/day.
![]()
Contradictory results from recent studies have established that the association of animal protein and plant protein intake with cardiovascular risk factors remains controversial. For example, in an RCT of postmenopausal women with abdominal obesity, soy protein diet showed 4% and 9% reduction in the total and low-density lipoprotein cholesterol plasma levels, compared to a mixed protein diet which mainly consisted of meat, dairy, and bread [29]. In addition, in a cohort study of male elderly, high plant protein intake was associated with reduced 5-year change in blood pressure as compared to low plant protein intake, while animal protein intake showed no significant association [30]. However, according to a cross-sectional study, high animal protein intake was inversely related to the prevalence of hypertension, as compared to low animal protein intake among female adults [23]. Another study reported that higher animal protein intake was associated with higher prevalence of reduced high-density lipoprotein cholesterol, while higher plant protein intake was associated with lower prevalence of high blood pressure in Korean male adults [31]. Thus, more evidence and sensitive analysis are required to establish dietary reference intake of animal and plant protein intake in a large population, by conducting further clinical studies. In addition, specific populations, such as vegetarians whose food protein sources are relatively clear, should be considered in future studies for establishing dietary reference intake of animal and plant protein.
Go to :
HIGH PROTEIN INTAKE AND SARCOPENIA IN ELDERLY
Sarcopenia is defined as an abnormal loss of muscle mass and muscle strength [32]. In the elderly, sarcopenia results in frailty, which is characterized by unintentional weight loss, weakness, exhaustion, reduced physical activity, and falls [33], thereby reducing the quality of life and shortening the lifespan. Physical inactivity and low protein intake are suggested risk factors for sarcopenia [34] and frailty [35]. Therefore, to prevent sarcopenia, the need to adjust and increase the protein intake standards for elderly individuals over 65 years of age has been suggested. Moreover, older people who want to maintain muscle mass and optimal body function require higher amounts of dietary protein than younger individuals to overcome age-related anabolic resistance [36373839]. Summarizing the results of literature analysis on frailty/sarcopenia since 2014, research results have consistently reported that protein supplementation or high-protein diet in elderly subjects suppresses the sarcopenia/frailty indicators (muscle mass and muscle strength loss) and increases muscle fiber production (Table 4).
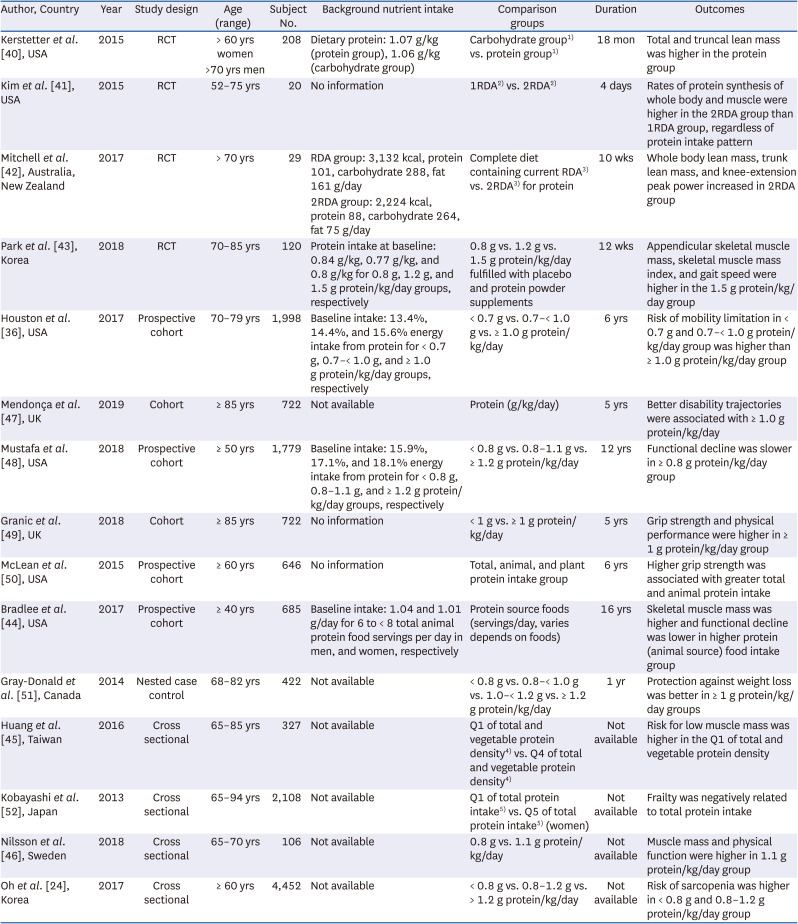
Table 4
Associations of protein intake with sarcopenia in elderly
| Author, country | Year | Study design | Age (range) | Subject No. | Background nutrient intake | Comparison groups | Duration | Outcomes |
|---|---|---|---|---|---|---|---|---|
| Kerstetter et al. [40], USA | 2015 | RCT | > 60 yrs women | 208 | Dietary protein: 1.07 g/kg (protein group), 1.06 g/kg (carbohydrate group) | Carbohydrate group1) vs. protein group1) | 18 mon | Total and truncal lean mass was higher in the protein group |
| >70 yrs men | ||||||||
| Kim et al. [41], USA | 2015 | RCT | 52–75 yrs | 20 | No information | 1RDA2) vs. 2RDA2) | 4 days | Rates of protein synthesis of whole body and muscle were higher in the 2RDA group than 1RDA group, regardless of protein intake pattern |
| Mitchell et al. [42], Australia, New Zealand | 2017 | RCT | > 70 yrs | 29 | RDA group: 3,132 kcal, protein 101, carbohydrate 288, fat 161 g/day | Complete diet containing current RDA3) vs. 2RDA3) for protein | 10 wks | Whole body lean mass, trunk lean mass, and knee-extension peak power increased in 2RDA group |
| 2RDA group: 2,224 kcal, protein 88, carbohydrate 264, fat 75 g/day | ||||||||
| Park et al. [43], Korea | 2018 | RCT | 70–85 yrs | 120 | Protein intake at baseline: 0.84 g/kg, 0.77 g/kg, and 0.8 g/kg for 0.8 g, 1.2 g, and 1.5 g protein/kg/day groups, respectively | 0.8 g vs. 1.2 g vs. 1.5 g protein/kg/day fulfilled with placebo and protein powder supplements | 12 wks | Appendicular skeletal muscle mass, skeletal muscle mass index, and gait speed were higher in the 1.5 g protein/kg/day group |
| Houston et al. [36], USA | 2017 | Prospective cohort | 70–79 yrs | 1,998 | Baseline intake: 13.4%, 14.4%, and 15.6% energy intake from protein for < 0.7 g, 0.7–< 1.0 g, and ≥ 1.0 g protein/kg/day groups, respectively | < 0.7 g vs. 0.7–< 1.0 g vs. ≥ 1.0 g protein/kg/day | 6 yrs | Risk of mobility limitation in < 0.7 g and 0.7–< 1.0 g protein/kg/day group was higher than ≥ 1.0 g protein/kg/day group |
| Mendonça et al. [47], UK | 2019 | Cohort | ≥ 85 yrs | 722 | Not available | Protein (g/kg/day) | 5 yrs | Better disability trajectories were associated with ≥ 1.0 g protein/kg/day |
| Mustafa et al. [48], USA | 2018 | Prospective cohort | ≥ 50 yrs | 1,779 | Baseline intake: 15.9%, 17.1%, and 18.1% energy intake from protein for < 0.8 g, 0.8–1.1 g, and ≥ 1.2 g protein/kg/day groups, respectively | < 0.8 g vs. 0.8–1.1 g vs. ≥ 1.2 g protein/kg/day | 12 yrs | Functional decline was slower in ≥ 0.8 g protein/kg/day group |
| Granic et al. [49], UK | 2018 | Cohort | ≥ 85 yrs | 722 | No information | < 1 g vs. ≥ 1 g protein/kg/day | 5 yrs | Grip strength and physical performance were higher in ≥ 1 g protein/kg/day group |
| McLean et al. [50], USA | 2015 | Prospective cohort | ≥ 60 yrs | 646 | No information | Total, animal, and plant protein intake group | 6 yrs | Higher grip strength was associated with greater total and animal protein intake |
| Bradlee et al. [44], USA | 2017 | Prospective cohort | ≥ 40 yrs | 685 | Baseline intake: 1.04 and 1.01 g/day for 6 to < 8 total animal protein food servings per day in men, and women, respectively | Protein source foods (servings/day, varies depends on foods) | 16 yrs | Skeletal muscle mass was higher and functional decline was lower in higher protein (animal source) food intake group |
| Gray-Donald et al. [51], Canada | 2014 | Nested case control | 68–82 yrs | 422 | Not available | < 0.8 g vs. 0.8–< 1.0 g vs. 1.0–< 1.2 g vs. ≥ 1.2 g protein/kg/day | 1 yr | Protection against weight loss was better in ≥ 1 g protein/kg/day groups |
| Huang et al. [45], Taiwan | 2016 | Cross sectional | 65–85 yrs | 327 | Not available | Q1 of total and vegetable protein density4) vs. Q4 of total and vegetable protein density4) | Not available | Risk for low muscle mass was higher in the Q1 of total and vegetable protein density |
| Kobayashi et al. [52], Japan | 2013 | Cross sectional | 65–94 yrs | 2,108 | Not available | Q1 of total protein intake5) vs. Q5 of total protein intake5) (women) | Not available | Frailty was negatively related to total protein intake |
| Nilsson et al. [46], Sweden | 2018 | Cross sectional | 65–70 yrs | 106 | Not available | 0.8 g vs. 1.1 g protein/kg/day | Not available | Muscle mass and physical function were higher in 1.1 g protein/kg/day group |
| Oh et al. [24], Korea | 2017 | Cross sectional | ≥ 60 yrs | 4,452 | Not available | < 0.8 g vs. 0.8–1.2 g vs. > 1.2 g protein/kg/day | Not available | Risk of sarcopenia was higher in < 0.8 g and 0.8–1.2 g protein/kg/day group |
RCT, randomized controlled trial; RDA, recommended dietary allowance.
1)Carbohydrate group: carbohydrate (isocaloric maltodextrin) supplement group; Protein group: 45 g whey protein (40 g protein, 1.3 g protein/kg) group.
2)1RDA (0.8 g/kg/day), 2RDA (1.5 g/kg/day) with uneven (15/20/65% total protein amount at breakfast/lunch/dinner) or even (33/33/33% total protein amount at breakfast/lunch/dinner) intake of protein in the context of mixed meals.
3)RDA: 0.8 g/kg/day; 2RDA: 1.6 g/kg/day.
4)Q1: lowest quartile group, < 13.2% and < 5.8% for total and vegetable protein density, respectively; Q4: highest quartile group, ≥ 17.2% and ≥ 9.4% for total and vegetable protein density, respectively.
5)Q1: lowest quintile group, total protein intake ≤ 62.9 g/day; Q5: highest quintile group, total protein intake ≥ 84.3 g/day.
![]()
In a study providing 40 g protein supplement (1.3 g protein/kg/day) for 18 month to male and female senior citizens with no difference in daily protein intake, there was a significant increase in the amount of lean body mass [40]. In the context of mixed meals, whole body and muscle protein synthesis rate and net protein balance were significantly higher in the 1.5 g protein/kg/day intake group than in the 0.8 g protein/kg/day group [41]. Even or uneven distribution of protein intake across the three meals had no effect on these results. Consumption of a well-controlled complete diet containing twice the Recommended Dietary Allowance (RDA) (1.6 g/kg/day) of protein for 10 weeks in over 70-year-old men resulted in increased whole-body mass, trunk lean mass, and physical function manifested by knee-extension peak power and grip strength, as compared to intake of RDA (0.8 g/kg/day) group [42]. As shown in the protein dose-response study of Park et al. [43], the beneficial effects targeted towards the prevention of sarcopenia and frailty appear to be manifested by a protein intake of 1.5 g/kg/day. Prospective cohort and cross-sectional studies reported the beneficial effect of high-protein (≥ 0.8–1.0 g/kg/day vs < 0.8 g/kg/day) diet on preventing loss of skeletal muscle mass and physical function in the elderly (Table 4). However, there has been no consistent research demonstrating the effect of dietary protein sources. Increased skeletal muscle mass and lower functional decline were reported in the group consuming maximum animal protein foods [44], whereas the group with the least amount of plant protein intake was at a higher risk [45].
Conversely, blood urea nitrogen was significantly increased with protein intake of 1.2–1.6 g/kg/day, as compared to protein intake of 0.8 g/kg/day, within the normal range [4143]. Given the decline in kidney function with age, concerns are frequently raised about the effect of a high-protein diet on kidney function in the elderly. Additionally, since body mass of the elderly is lower than the general adult, there is an opinion that the intake of low protein is not consequential. Further quantitative studies to define optimal protein intake in old age are therefore required in the future.
Go to :
CONCLUSION
Accruing studies have reported the correlation between protein intake and chronic diseases. However, insufficient scientific evidence fails to establish the protein intake standards for the prevention of obesity, CVD, and sarcopenia. These standards need to be determined by considering the characteristics based on the life cycle and health status. High protein intake in early childhood may be a risk factor for obesity, but may help prevent frailty and sarcopenia in the elderly. In the future, measures, such as reducing protein in infant formula and increasing protein intake in the elderly, are expected to be prepared. In particular, it should be considered that compared to other age groups, lack of protein intake in the elderly may be higher due to the inability to eat good quality meals due to loss of appetite, weakness, and difficulty in eating due to disease. The correlation between the protein source and the risk of chronic disease also remains inconsistent, and most reports are based on observational studies or a small number of subjects, thereby limiting interpretation. It is believed that more clinical intervention studies are required in the future to prepare more sophisticated protein intake standards based on scientific evidence.
Go to :
 XML Download