Journal List > Nutr Res Pract > v.16(Suppl 1) > 1162207

Kim, Kim, Kim, Choe, and Lee: Usual intake of dietary isoflavone and its major food sources in Koreans: Korea National Health and Nutrition Examination Survey 2016-2018 data

Abstract

BACKGROUND/OBJECTIVES

Accumulating evidence has shown the beneficial effects of isoflavone on health. There is limited information on the usual isoflavone intake for Koreans. This study examined the usual intake of total isoflavone and its major food sources in Koreans according to age and gender.

SUBJECTS/METHODS

The dietary intake data of 21,271 participants aged 1 yrs and older from the Korea National Health and Nutrition Examination Survey (KNHANES) VII 2016–2018 were analyzed. The average isoflavone intake was estimated based on the 24-h dietary recall data in KNHANES and the isoflavone database from the Korea Rural Development Administration (RDA) and literatures. The usual isoflavone intake was estimated by applying the ratio of within- and between-participant variance estimated from the 2009 KNHANES data to the 7th KNHANES (2016–2018) data. The variance of the isoflavone intake was calculated using MIXTRAN macro with intake data for two days in the 2009 KNHANES. Complex sample analysis with stratified variables and integrated weights was conducted.

RESULTS

The mean total isoflavone intake in the Korean population aged 1 yrs and older (n = 21,271) was 139.27 mg/d, which was higher than the usual intake of 47.44mg/d. Legumes were a major contributing food group (91%), with arrowroot being a major individual contributor to the isoflavone intake (67.2%), followed by 21.3% of soybean, 5.4% of bean sprouts, and 2.1% of tofu. The usual isoflavone intake was highest in the participants aged 50 to 64 yrs old and increased with age until 50 to 64 yrs and then decreased with further increases in age. The usual isoflavone intake of participants aged 65 yrs and older was higher for men than for women, showing gender differences.

CONCLUSIONS

The usual dietary intake of isoflavone varied according to age and gender in the Korean population. This study showed that the usual isoflavone intake was lower than the average isoflavone intake. The difference between percentiles of the usual isoflavone intake was similarly smaller than the average intake. An estimation of average intake can be hindered by the occasional consumption of foods high in isoflavones, suggesting that the usual intake estimation method can be more appropriate. Further research will be needed to establish isoflavone dietary guidelines regarding the effects of isoflavone intake on health outcomes.

INTRODUCTION

Isoflavone is one of the subclasses of dietary flavonoids, which is the major group of polyphenolic compounds predominantly present in plant-based foods [12]. Soy and soy products are the predominant dietary sources of isoflavones [3]. The amount of isoflavones in soy varies according to the cultivar, cultivation conditions, and post-harvest processing [45]. The isoflavone content ranges from 580 to 3,800 mg/kg fresh weight and 1.2 to 4.2 mg/g dry weight in soybean (primarily in the structure of daidzein, genistein, and their conjugates) [36]. The isoflavone levels in soy milk have been reported to range between 30 and 175 mg/L [3]. Isoflavones are also present in legumes (e.g., chickpeas and lentils), nuts, vegetables, and fruits [7].
Isoflavones act as phytoestrogens because they have a chemical structure similar to estrogen. Isoflavone glycosides include the following: daidzin, genistin, glycitin, ononin, issotrin, acetyldaidzin, acetylgenistin, acetylglycitin, malonyldaidzin, malonylgenistin, malonylglycitin, malonylononin, and malonylsissotrin. Isoflavone aglycones include genistein (7,4′-dihydroxy-6-methoxyisoflavone), daidzein (7,4′-dihydroxyisoflavone), glycitein (7,4′-dihydroxy-6-methoxyisoflavone), biochanin A (5,7-dihydroxy-4′-methoxyisoflavone), and formononetin (7-hydroxy-4′-methoxyisoflavone) [8]. Isoflavone aglycones are the active forms hydrolyzed from glycosides, which are inactive forms of isoflavone [89]. In particular, daidzin and daidzein (soy isoflavone) are metabolized to equol (7-hydroxy-3-[4′-hydroxyphenyl] chroman) by the action of intestinal microflora [1011]. Equol has been suggested to have beneficial effects on human health [10].
Epidemiological and intervention studies have reported that the consumption of soy or isoflavone is inversely associated with the risk of type 2 diabetes mellitus (T2DM) [12], cardiovascular disease (CVD) [1314], cerebral and myocardial infarctions (CI and MI) [15], bone loss [1617], cognitive degeneration [1819], gastrointestinal cancer [20], colorectal cancer [21], prostate cancer [22], breast cancer [2324], and menopausal symptoms [25]. A meta-analysis of six prospective studies with 4 publications showed that the highest intake (60 mg/d) of soy isoflavone was associated with a 12% lower risk of T2DM compared to the lowest intake of soy isoflavone (relative risk = 0.88; 95% confidence interval, 0.81 to 0.96; I2 = 37.2%) [12]. In a meta-analysis of 63 randomized controlled trials (RCTs) in 6,427 postmenopausal women, the intake of genistein (54 mg/d) or ipriflavone (600 mg/d) was associated with improved bone mineral density (BMD) [16].
Despite the beneficial effects of dietary intake of isoflavone on T2DM, CVD, osteoporosis, cognitive function, and cancers [12151618222426], there are still concerns about isoflavone intake as a potential endocrine disruptor with adverse effects on growth, fertility, and the reproductive and endocrine systems at certain human life stages [27]. According to the USA National Toxicology Program (USA-NTP), adverse doses of fertility were reported to be 0.1 mg/(kg body weight × days) in children and 0.3 mg/(kg body weight × days) in adults depending on the individual’s susceptibility [28]. Infants fed soy milk or formula at ≤ 4 mon showed higher Pre-School Activities Inventory (PSAI) scores (less female-typical role play) in girls compared with infants fed breast milk and milk formula [29]. Girls with precocious puberty had a significant level of serum isoflavone [30].
An accurate estimation of the dietary isoflavone intake based on gender and age is critical when considering the beneficial and harmful aspects of isoflavone for public health [2731]. The estimation of the total isoflavone intake and major food sources has been conducted in several countries, including Japan [3233], China [32], Hong Kong [3234], Singapore [32], the USA [3536], the UK [373839], Australia [40], Spain [41], Ireland [39], Italy [39], and the Netherlands [39]. Adults in the USA, the UK, Australia, Spain, Ireland, Italy, and the Netherlands aged ≥ 19 yrs consumed less than 3 mg/d of isoflavone [353637394041]. Adults (aged ≥ 19 yrs) in Japan showed a daily isoflavone intake of 25 to 50 mg. Hong Kong and Singaporean adults showed lower isoflavone intakes than Chinese adults [32]. The major food sources of isoflavone are soy products, followed by legumes in those countries [32353637394041].
Although a few studies on the estimation of dietary isoflavone intake and major food sources in Korea have been conducted, they focused on a certain age group of the Korean population [42434445]. Thus, the research on the usual dietary intake and major food sources of isoflavones based on a representative Korean population is still required to reflect the differences across age groups. This study examined the usual total isoflavone intake and explored major food sources for different age and sex groups in the Korean population using Korea National Health and Nutrition Examination Survey VII (KNHANES VII) data.

SUBJECTS AND METHODS

Database for calculation of usual intake and subjects

The KNHANES is a large, representative, nationwide cross-sectional health and nutrition survey conducted for Koreans aged 1 yrs or older living in Korea. Further details of KNHANES can be found elsewhere [44]. The KNHANES consists of a health interview survey, a nutrition survey, and a health examination survey. A 2-step stratified cluster sampling method was applied in KNHANES to ensure a representative sample and estimation accuracy. Detailed investigation methods and protocols have been addressed in previous studies [4647]. A multiple-pass 24-h dietary recall method and the relative frequency weighting of each food were used to estimate the usual total isoflavone intake in the KNHANES [48]. At least 2 days of dietary data are required to estimate the usual of total isoflavone intake. On the other hand, because the KNAHNES basically provides only one-day data for each individual except for KNHANES 2009, this study calculated the ratio of the within- and between-participants variance of the 7th KNHANES (2016, 2017, and 2018) data based on the 2009 KNHANES data. It estimated the usual isoflavone intake using the 2016, 2017, and 2018 KNHANES data.
The 24-h dietary recall method in the 2009 KNHANES was performed with an additional one day in 50 out of 200 surveys (n = 9,391). Through this process, two-day intake data were generated from 2,029 of the total subjects, which was the most recent data consisting of two days of a 24-h dietary recall method available thus far. Thus, this study calculated the ratio of within-person to between-person variance in isoflavone intake from the 2009 KNAHNES data. The usual isoflavone intake was estimated by applying the ratio to the 24-h dietary recall data of the 7th KNAHNES data (n = 21,271) conducted in 2016, 2017, and 2018.

Dietary assessment

The isoflavone intake was calculated mainly based on the ‘isoflavone database’ developed by the Korea Rural Development Administration (RDA) in 2018. The isoflavone content (mg/100 g) of 268 food items was released, and the isoflavone content was calculated from genistein, daidzein, glycitein, biochanin A, formononetin, isomucronulatol, methylnissolin, 3′-hydroxydaidzein, 3′-methoxydaidzein, calycosin, and odoratin. The information on the isoflavone content from 142 food items provided in Park’s thesis [49] and data on isoflavone content from 560 food items in the U.S. Department of Agriculture database (Release 2.0) were also used to increase the coverage of the database [50]. The food intake data with food code (N_FCODE3) was used in the dataset. The food intake amount was calculated by linking each food code with the isoflavone content database, where KNHANES has the unique food code system used as the primary code. The isoflavone intake was calculated for each food based on the isoflavone contents when identified as a similar food after examining the moisture content and properties of the food. The linkage process was first performed using the 2009 KNHANES to calculate isoflavone intake for 4 yrs and then relinked with the food code of the 7th KNHANES. After matching, as isoflavone content is not zero, 266 food codes in the KNHANES were used in this linkage process. For the ‘cereals’ food group, bread and rice cakes were the main foods in the DB for the isoflavone content, while soybeans, peas, kidney beans, tofu, and arrowroot were the main foods in the ‘legumes’ food group. Peanuts in the ‘nuts and seeds’ food group and bean sprouts and mungbean sprouts in the ‘vegetables’ food group had relatively high isoflavone contents. This study’s database also included peanut butter from the ‘fats and oils’ food group, as well as gochujang, soybean paste, and ssamjang from the ‘seasonings’ food group.

Statistical analysis

The National Cancer Institute (NCI) one-day method was applied to estimate the usual isoflavone intake. The intake data for more than 2 days are required for some subjects in the target group to use the existing NCI method. The basic principle of the NCI 1-d method is the same as that of the NCI method. The NCI 1-d method calculates the within-person to between-person variance ratio from intakes for two days or more in a group other than the same group and then applies it to the target group. Ultimately, the daily intake of the target group can be estimated.
Therefore, this study calculated the variance ratio of the isoflavone intake from the intake data for 2 days in the 2009 KNHANES through the MIXTRAN macro and applied it to the 3-yrs data of the 7th KNHANES (TRAN-1 macro). The estimated daily total isoflavone intake is presented with the mean, SE, and 9 percentiles (1st, 5th, 10th, 25th, 50th, 75th, 90th, 95th, and 99th). All statistical analyses were carried out using Statistical Analysis System (SAS version 9.4; SAS Institute, Cary, NC, USA). The SAS survey procedures and the appropriate weight, strata, and cluster variables were applied to account for the complex survey design of the KNHANES.

RESULTS

Isoflavone contents of food groups and contribution rates of each food source

Table 1 lists the isoflavone contents of 15 food groups according to the food code classification system. The legumes group had the highest isoflavone content (615.50 mg), followed by seasonings (90.41 mg), sugars (41.28 mg), and processed foods (25.36 mg). The contribution of the legumes food group to the daily isoflavone intake in the 7th KNHANES was the highest (90.99%). In comparison, the contribution rates of the vegetables and seasonings food groups were 5.56% and 2.13%, respectively (Table 1).
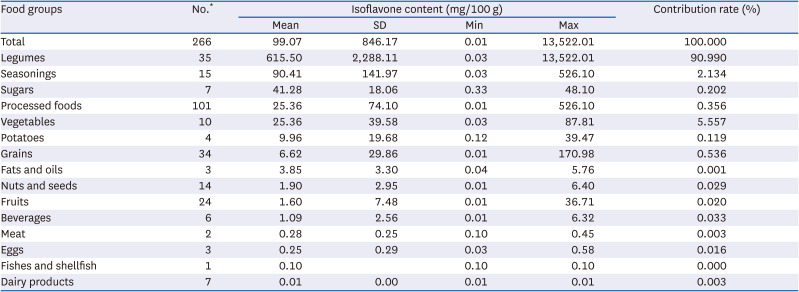
Table 1

Database for the isoflavone content of the selected food groups and percentage contribution for each food group (KNHANES VII)

nrp-16-S134-i001
Food groups No.* Isoflavone content (mg/100 g) Contribution rate (%)
Mean SD Min Max
Total 266 99.07 846.17 0.01 13,522.01 100.000
Legumes 35 615.50 2,288.11 0.03 13,522.01 90.990
Seasonings 15 90.41 141.97 0.03 526.10 2.134
Sugars 7 41.28 18.06 0.33 48.10 0.202
Processed foods 101 25.36 74.10 0.01 526.10 0.356
Vegetables 10 25.36 39.58 0.03 87.81 5.557
Potatoes 4 9.96 19.68 0.12 39.47 0.119
Grains 34 6.62 29.86 0.01 170.98 0.536
Fats and oils 3 3.85 3.30 0.04 5.76 0.001
Nuts and seeds 14 1.90 2.95 0.01 6.40 0.029
Fruits 24 1.60 7.48 0.01 36.71 0.020
Beverages 6 1.09 2.56 0.01 6.32 0.033
Meat 2 0.28 0.25 0.10 0.45 0.003
Eggs 3 0.25 0.29 0.03 0.58 0.016
Fishes and shellfish 1 0.10 0.10 0.10 0.000
Dairy products 7 0.01 0.00 0.01 0.01 0.003
KNHANES, Korea National Health and Nutrition Examination Survey
*Number of individual foods in each food group.
Table 2 lists the contribution rates of individual food sources of isoflavone. The highest contribution rate to isoflavone intake was 67.16% for arrowroot, 21.25% for soybean, 5.44% for bean sprouts, and 2.10% for tofu (Table 2).
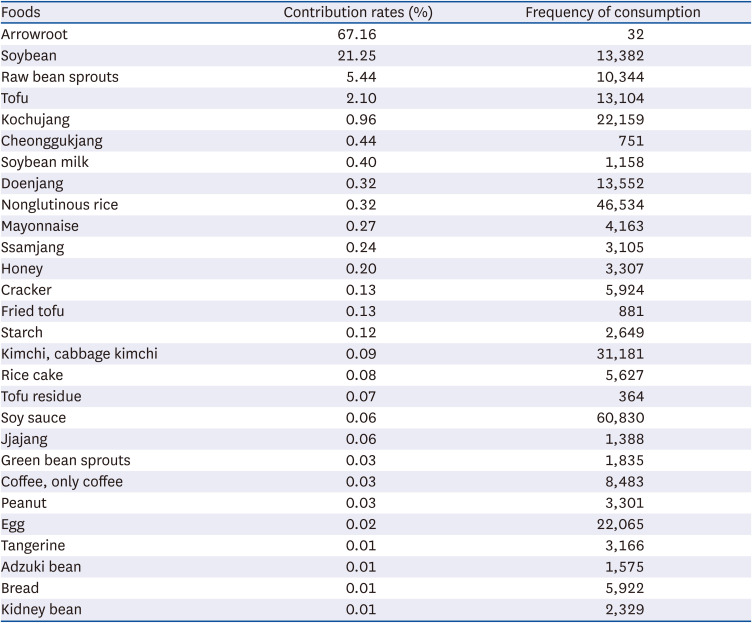
Table 2

Contribution rates and frequency for individual food sources of isoflavone

nrp-16-S134-i002
Foods Contribution rates (%) Frequency of consumption
Arrowroot 67.16 32
Soybean 21.25 13,382
Raw bean sprouts 5.44 10,344
Tofu 2.10 13,104
Kochujang 0.96 22,159
Cheonggukjang 0.44 751
Soybean milk 0.40 1,158
Doenjang 0.32 13,552
Nonglutinous rice 0.32 46,534
Mayonnaise 0.27 4,163
Ssamjang 0.24 3,105
Honey 0.20 3,307
Cracker 0.13 5,924
Fried tofu 0.13 881
Starch 0.12 2,649
Kimchi, cabbage kimchi 0.09 31,181
Rice cake 0.08 5,627
Tofu residue 0.07 364
Soy sauce 0.06 60,830
Jjajang 0.06 1,388
Green bean sprouts 0.03 1,835
Coffee, only coffee 0.03 8,483
Peanut 0.03 3,301
Egg 0.02 22,065
Tangerine 0.01 3,166
Adzuki bean 0.01 1,575
Bread 0.01 5,922
Kidney bean 0.01 2,329

Average and usual intake of total isoflavone according to age groups

Table 3 lists the average total isoflavone intake in the Korean population (KNHANES VII) according to the age groups. The average intake of the 50–64 yrs age group was highest (287.87 mg) across all age groups. In the 50–64 yrs age group, a significant difference of 579.77 mg was detected between the 99th (790.41 mg) and 95th percentile (210.64 mg) (Table 3).
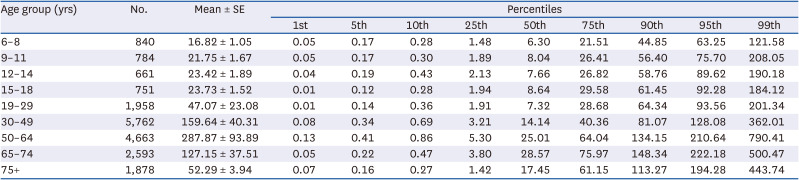
Table 3

Average intake* of total isoflavone in the Korean population (KNHANES VII) according to the age groups

nrp-16-S134-i003
Age group (yrs) No. Mean ± SE Percentiles
1st 5th 10th 25th 50th 75th 90th 95th 99th
6–8 840 16.82 ± 1.05 0.05 0.17 0.28 1.48 6.30 21.51 44.85 63.25 121.58
9–11 784 21.75 ± 1.67 0.05 0.17 0.30 1.89 8.04 26.41 56.40 75.70 208.05
12–14 661 23.42 ± 1.89 0.04 0.19 0.43 2.13 7.66 26.82 58.76 89.62 190.18
15–18 751 23.73 ± 1.52 0.01 0.12 0.28 1.94 8.64 29.58 61.45 92.28 184.12
19–29 1,958 47.07 ± 23.08 0.01 0.14 0.36 1.91 7.32 28.68 64.34 93.56 201.34
30–49 5,762 159.64 ± 40.31 0.08 0.34 0.69 3.21 14.14 40.36 81.07 128.08 362.01
50–64 4,663 287.87 ± 93.89 0.13 0.41 0.86 5.30 25.01 64.04 134.15 210.64 790.41
65–74 2,593 127.15 ± 37.51 0.05 0.22 0.47 3.80 28.57 75.97 148.34 222.18 500.47
75+ 1,878 52.29 ± 3.94 0.07 0.16 0.27 1.42 17.45 61.15 113.27 194.28 443.74
*Unit (mg/day).
Table 4 presents the usual total isoflavone intake in Koreans according to the age groups. The 50–64 yrs age group showed the highest usual total isoflavone intake (62.32 mg). In the 50–64 yrs age group, the usual intakes at the 99th and 95th percentile were 220.42 mg and 110.59 mg, respectively (Table 4).
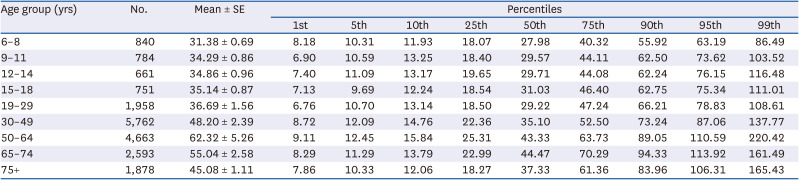
Table 4

Usual intake* of total isoflavone in the Korean population (KNHANES VII) according to age groups

nrp-16-S134-i004
Age group (yrs) No. Mean ± SE Percentiles
1st 5th 10th 25th 50th 75th 90th 95th 99th
6–8 840 31.38 ± 0.69 8.18 10.31 11.93 18.07 27.98 40.32 55.92 63.19 86.49
9–11 784 34.29 ± 0.86 6.90 10.59 13.25 18.40 29.57 44.11 62.50 73.62 103.52
12–14 661 34.86 ± 0.96 7.40 11.09 13.17 19.65 29.71 44.08 62.24 76.15 116.48
15–18 751 35.14 ± 0.87 7.13 9.69 12.24 18.54 31.03 46.40 62.75 75.34 111.01
19–29 1,958 36.69 ± 1.56 6.76 10.70 13.14 18.50 29.22 47.24 66.21 78.83 108.61
30–49 5,762 48.20 ± 2.39 8.72 12.09 14.76 22.36 35.10 52.50 73.24 87.06 137.77
50–64 4,663 62.32 ± 5.26 9.11 12.45 15.84 25.31 43.33 63.73 89.05 110.59 220.42
65–74 2,593 55.04 ± 2.58 8.29 11.29 13.79 22.99 44.47 70.29 94.33 113.92 161.49
75+ 1,878 45.08 ± 1.11 7.86 10.33 12.06 18.27 37.33 61.36 83.96 106.31 165.43
KNHANES, Korea National Health and Nutrition Examination Survey.
*Unit (mg/day).

The average and usual intake of total isoflavone according to gender and age groups

Table 5 lists the average total isoflavone intake in Koreans according to gender and age groups. The distribution had a long tail to the right. The mean total isoflavone intake was 139.27 mg, but the median total isoflavone intake was 13.96 mg (data not shown), indicating that the mean was increased by extreme values. The isoflavone intake distribution was also presented according to gender and age groups. Overall, average isoflavone intake was likely to increase with age. The 50–64 yrs age group showed the highest isoflavone intake for both men and women (men: 232.45mg, women: 343.01mg), with the 50–64-yrs-old women group showing the highest intake. On the other hand, the isoflavone intake decreased for the participants aged 65 yrs and older. Among the participants aged 6 to 18 yrs and 65 yrs and older, the average isoflavone intake of men was higher than that of women. The average isoflavone intake of women was higher than that of men aged 19 to 64 yrs. Overall, the isoflavone intake at the 99th percentile (379.02 mg/d) was much higher than that at the 95th percentile (146.95 mg/d) in most age and gender groups resulting in an increase in average isoflavone intake (Table 5).
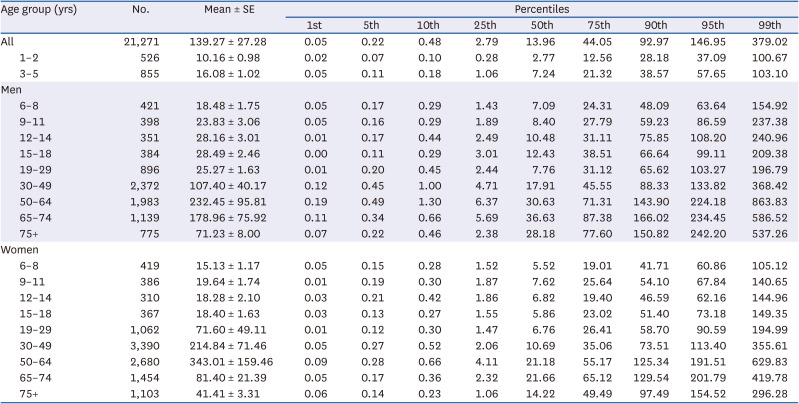
Table 5

Average intake* of total isoflavone in the Korean population (KNHANES VII) according to gender and age groups

nrp-16-S134-i005
Age group (yrs) No. Mean ± SE Percentiles
1st 5th 10th 25th 50th 75th 90th 95th 99th
All 21,271 139.27 ± 27.28 0.05 0.22 0.48 2.79 13.96 44.05 92.97 146.95 379.02
1–2 526 10.16 ± 0.98 0.02 0.07 0.10 0.28 2.77 12.56 28.18 37.09 100.67
3–5 855 16.08 ± 1.02 0.05 0.11 0.18 1.06 7.24 21.32 38.57 57.65 103.10
Men
6–8 421 18.48 ± 1.75 0.05 0.17 0.29 1.43 7.09 24.31 48.09 63.64 154.92
9–11 398 23.83 ± 3.06 0.05 0.16 0.29 1.89 8.40 27.79 59.23 86.59 237.38
12–14 351 28.16 ± 3.01 0.01 0.17 0.44 2.49 10.48 31.11 75.85 108.20 240.96
15–18 384 28.49 ± 2.46 0.00 0.11 0.29 3.01 12.43 38.51 66.64 99.11 209.38
19–29 896 25.27 ± 1.63 0.01 0.20 0.45 2.44 7.76 31.12 65.62 103.27 196.79
30–49 2,372 107.40 ± 40.17 0.12 0.45 1.00 4.71 17.91 45.55 88.33 133.82 368.42
50–64 1,983 232.45 ± 95.81 0.19 0.49 1.30 6.37 30.63 71.31 143.90 224.18 863.83
65–74 1,139 178.96 ± 75.92 0.11 0.34 0.66 5.69 36.63 87.38 166.02 234.45 586.52
75+ 775 71.23 ± 8.00 0.07 0.22 0.46 2.38 28.18 77.60 150.82 242.20 537.26
Women
6–8 419 15.13 ± 1.17 0.05 0.15 0.28 1.52 5.52 19.01 41.71 60.86 105.12
9–11 386 19.64 ± 1.74 0.01 0.19 0.30 1.87 7.62 25.64 54.10 67.84 140.65
12–14 310 18.28 ± 2.10 0.03 0.21 0.42 1.86 6.82 19.40 46.59 62.16 144.96
15–18 367 18.40 ± 1.63 0.03 0.13 0.27 1.55 5.86 23.02 51.40 73.18 149.35
19–29 1,062 71.60 ± 49.11 0.01 0.12 0.30 1.47 6.76 26.41 58.70 90.59 194.99
30–49 3,390 214.84 ± 71.46 0.05 0.27 0.52 2.06 10.69 35.06 73.51 113.40 355.61
50–64 2,680 343.01 ± 159.46 0.09 0.28 0.66 4.11 21.18 55.17 125.34 191.51 629.83
65–74 1,454 81.40 ± 21.39 0.05 0.17 0.36 2.32 21.66 65.12 129.54 201.79 419.78
75+ 1,103 41.41 ± 3.31 0.06 0.14 0.23 1.06 14.22 49.49 97.49 154.52 296.28
KNHANES, Korea National Health and Nutrition Examination Survey.
*Unit (mg/day).
Table 6 lists the estimated usual intake of the total isoflavone by gender and age groups using the NCI 1-d method. The usual intake in the Korean population was 47.44 mg and the SE was 1.60. The usual intake decreased significantly compared to the average intake (Table 5), and the SEs were small. The difference between the median value (data not shown) and the mean value of the usual intake also decreased compared to the difference in average intake. The usual intake at the 99th percentile (149.42 mg/d) was similar to the intake at the 95th percentile (94.32 mg/d). As shown in Table 6, the usual total isoflavone intake ranged from 30 to 40 mg per day in both men and women under the age of 30. The usual intake of subjects aged 30 yrs and older was higher than that of subjects under 30 yrs, showing the highest intake level in the 50–64 yrs age group. The usual isoflavone intakes of men and women aged 30–49 yrs were 47.57 and 48.88 mg/d, respectively, while the usual isoflavone intakes of men and women aged 50–64 yrs were 62.00 and 62.63 mg/d, respectively. There appeared to be no gender difference in the age group under 64 yrs of age, whereas in the age group 65 yrs and older, the usual isoflavone intake of men was higher than that of women (Table 6).
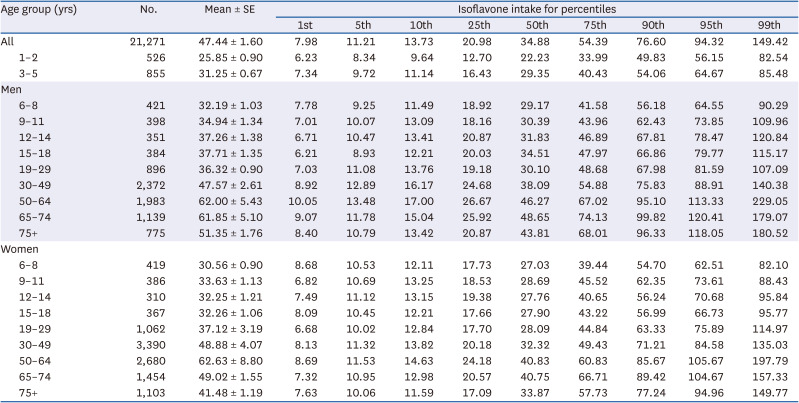
Table 6

Usual intake* of total isoflavone in the Korean population (KNHANES VII) according to gender and age groups

nrp-16-S134-i006
Age group (yrs) No. Mean ± SE Isoflavone intake for percentiles
1st 5th 10th 25th 50th 75th 90th 95th 99th
All 21,271 47.44 ± 1.60 7.98 11.21 13.73 20.98 34.88 54.39 76.60 94.32 149.42
1–2 526 25.85 ± 0.90 6.23 8.34 9.64 12.70 22.23 33.99 49.83 56.15 82.54
3–5 855 31.25 ± 0.67 7.34 9.72 11.14 16.43 29.35 40.43 54.06 64.67 85.48
Men
6–8 421 32.19 ± 1.03 7.78 9.25 11.49 18.92 29.17 41.58 56.18 64.55 90.29
9–11 398 34.94 ± 1.34 7.01 10.07 13.09 18.16 30.39 43.96 62.43 73.85 109.96
12–14 351 37.26 ± 1.38 6.71 10.47 13.41 20.87 31.83 46.89 67.81 78.47 120.84
15–18 384 37.71 ± 1.35 6.21 8.93 12.21 20.03 34.51 47.97 66.86 79.77 115.17
19–29 896 36.32 ± 0.90 7.03 11.08 13.76 19.18 30.10 48.68 67.98 81.59 107.09
30–49 2,372 47.57 ± 2.61 8.92 12.89 16.17 24.68 38.09 54.88 75.83 88.91 140.38
50–64 1,983 62.00 ± 5.43 10.05 13.48 17.00 26.67 46.27 67.02 95.10 113.33 229.05
65–74 1,139 61.85 ± 5.10 9.07 11.78 15.04 25.92 48.65 74.13 99.82 120.41 179.07
75+ 775 51.35 ± 1.76 8.40 10.79 13.42 20.87 43.81 68.01 96.33 118.05 180.52
Women
6–8 419 30.56 ± 0.90 8.68 10.53 12.11 17.73 27.03 39.44 54.70 62.51 82.10
9–11 386 33.63 ± 1.13 6.82 10.69 13.25 18.53 28.69 45.52 62.35 73.61 88.43
12–14 310 32.25 ± 1.21 7.49 11.12 13.15 19.38 27.76 40.65 56.24 70.68 95.84
15–18 367 32.26 ± 1.06 8.09 10.45 12.21 17.66 27.90 43.22 56.99 66.73 95.77
19–29 1,062 37.12 ± 3.19 6.68 10.02 12.84 17.70 28.09 44.84 63.33 75.89 114.97
30–49 3,390 48.88 ± 4.07 8.13 11.32 13.82 20.18 32.32 49.43 71.21 84.58 135.03
50–64 2,680 62.63 ± 8.80 8.69 11.53 14.63 24.18 40.83 60.83 85.67 105.67 197.79
65–74 1,454 49.02 ± 1.55 7.32 10.95 12.98 20.57 40.75 66.71 89.42 104.67 157.33
75+ 1,103 41.48 ± 1.19 7.63 10.06 11.59 17.09 33.87 57.73 77.24 94.96 149.77
KNHANES, Korea National Health and Nutrition Examination Survey.
*Unit (mg/day).

DISCUSSION

This study evaluated the usual isoflavone intake and its major food sources for different age groups by gender in the Korean population using an expanded isoflavone database and a 24-h dietary recall data of KNHANES VII. The present study showed that the average intake and usual intake differed according to age and gender. The average intake showed a gender difference in all age groups, while the usual intake showed a gender difference only in the age group over 65 yrs old. The difference between the average intake and the usual intake is likely to be more pronounced when a large quantity of foods high in isoflavones are consumed occasionally.
The usual dietary isoflavone intake was greater among adults aged 30 yrs and older than those aged under 30 yrs (30–40 mg for those aged < 30 yrs, over 47 mg for those aged 30 yrs and older except for women aged 75 yrs and older), which is consistent with the results by Lee and Kim [45]. Korean adults aged 50–64 yrs consumed the highest amount of total isoflavone across all age groups.
In this study, the usual intake of isoflavone in adults aged 20 yrs and older was greater than the results of Lee and Kim [45]. They reported a mean isoflavone intake of 23.1 mg/d in Korean adults aged 20 yrs and older with a substantial variation among individuals (16.9 mg/d [0–190 mg] at the 50th percentile; 10% of individuals consumed 50 mg/d; and 10% of individuals consumed 5 mg/d) [45].
In a previous European study on the total isoflavone intake across four countries [39], dietary isoflavone intakes were 913 µg/d in the Netherlands, 726 µg/d in Ireland, 718 µg/d in the UK, and 554 µg/d in Italy [39]. The main sources of isoflavones in European countries were soy products, followed by legumes and (pea) nuts, bread, and breakfast cereals [39]. Individuals (aged 35–74 yrs) in most European countries [4151] consumed less than 3 mg/d of isoflavones. Individuals (aged ≥ 19 yrs) in the USA also consumed less than 3 mg/d of isoflavones (1.0 mg/day or 0.7 mg/1,000 kcal) [52]. The mean daily isoflavone intake of Australian men and women aged 39–65 yrs was 2.22 mg. The main sources of isoflavone were bread followed by minced-meat dishes, tofu, soy-based noodles and pasta, minced meat as a sauce, soybeans, coffee, soy crisps/snacks, and tempeh [40]. Japanese people (aged 19–80 yrs) consumed 25 to 50 mg per day [32]. Adults in Hong Kong and Singapore consumed less isoflavones than those in Japan. In particular, China showed regional variations in intake [32]. Asian countries tend to consume more isoflavones than European countries owing to their higher intake of soy or soy products [323752535455]. Wakai et al. [33] reported that soy foods, such as tofu, miso, natto, and fried tofu, accounted for approximately 90% of the total isoflavone intake in Japan.
In the present study, the usual intakes of isoflavone were 32–35 mg/d in Korean children (aged 6–11 yrs). These results are inconsistent with previous findings of isoflavone intake of 8 mg/d in Korean children (aged 8–11 yrs) [5657]. The discrepancy in Korean children can be explained by the differences in their family’s dietary patterns. Owing to the rapid westernization of the Korean diet, various dietary patterns coexist, along with the Korean traditional diet pattern and the Western-style pattern. According to Lee et al. [58], using a 24-h dietary recall in the 2008 KNHANES, isoflavone intake was 30.4 mg/d in children aged 2–18 yrs and consumed the recommended daily intakes of fruits and vegetables, whereas the isoflavone intake was 4.9 mg/d in children who did not consume the recommended daily intakes of fruits and vegetables. Compared to other Asian countries, the daily isoflavone intake was 12–14 mg/d in Japanese children (aged 1–6 yrs) [59]. In Chinese children (aged 1–14 yrs), daily isoflavone intake was 500 µg/kg body weight [60]. Taiwanese children aged 8–9 yrs consumed 36.6 mg/d [61]. Overall, there are differences in usual isoflavone intakes according to age and gender within Korea. An inconsistency in the usual isoflavone intake has been observed among countries or ethnicities and dietary patterns via cumulated evidence.
This study also found that the major contributing food groups to the isoflavone intake in Korea were legumes (91%), vegetables (5.6%), and seasonings (2.1%). Thus, certain dietary patterns that include these contributors, such as legumes, may contribute to the usual isoflavone intake, as mentioned above. This study identified legumes (90%) as a major food group contributing to isoflavone in Korea, which was consistent with a previous study [4245]. As for the major individual food sources of total isoflavone, arrowroot showed the highest proportion of total isoflavone intake (67.16%) owing to its high isoflavone content. There is the possibility that arrowroot was consumed on certain days when the KNHANES was performed, which resulted in the highest arrowroot intake in the legumes food group. As arrowroot is not a frequently consumed food, dietary data based on a one-day 24-h dietary recall in KNHANES may result in large variations in the isoflavone intake level between the consumer group and non-consumer group. Therefore, further study will be needed to estimate the daily consumption, which may provide more specific and realistic data on the food sources of the isoflavone intake.
This study had some limitations. First, recall bias can exist as the 24-h dietary recall data depends on the subjects’ memory, which can lead to under- or overestimations of the total isoflavone intake. Second, the estimated isoflavone intake can be reduced or elevated if more food sources of isoflavone are added (updated) to the isoflavone database. Third, the dominant isoflavone sources, especially arrowroot, which are not foods commonly consumed by the general population, may result in greater variations among individuals.
Despite the limitations, these findings provide crucial information. To the best of the authors’ knowledge, this is the first study to estimate the usual total isoflavone intake and examine the major food sources of isoflavone in the Korean population according to age and gender using KNHANES VII. Furthermore, MIXTRAN macro with the NCI 1-d method as a novel analysis method for KNHANES data was applied in this study to estimate the total isoflavone intake with the 3-yrs data of KNHANES. This study used a nationally representative sample of the Korean population and a national isoflavone database based on a typical diet to provide fundamental evidence for establishing the isoflavone intake recommendations for Koreans, such as dietary reference intakes and recommended dietary allowance. Lastly, this study provided basic data on isoflavone intake for the global comparison between countries according to age and gender.
In conclusion, this study examined the usual isoflavone intake and major food sources of isoflavone in the Korean population according to age and gender. This study provides fundamental data for future studies investigating the relationship between the isoflavone intake and human health.

Notes

Funding: This research was supported by Policy Research Program for (project No. 20180415A13-00, 25193068200, 25203084501) from the Ministry of Health and Welfare in 2018~2020 and partly supported by Gachon University Research Fund (202103380001).

Conflict of Interest: The authors declare no potential conflicts of interests.

Author Contributions:

  • Conceptualization: Lee HJ.

  • Data curation: Kim DW.

  • Formal analysis: Kim DW, Lee HJ.

  • Investigation: Kim K, Lee HJ.

  • Methodology: Kim DW.

  • Supervision: Lee HJ.

  • Validation: Choe JS.

  • Visualization: Lee HJ.

  • Writing - original draft: Kim Y.

  • Writing - review & editing: Kim K, Lee HJ.

References

1. Kumar S, Pandey AK. Chemistry and biological activities of flavonoids: an overview. Sci World J. 2013; 2013:162750.
2. Kim Y, Keogh JB, Clifton PM. Polyphenols and glycemic control. Nutrients. 2016; 8:17.
3. Manach C, Scalbert A, Morand C, Rémésy C, Jiménez L. Polyphenols: food sources and bioavailability. Am J Clin Nutr. 2004; 79:727–747. PMID: 15113710.
4. Kim HS, Kang BK, Seo JH, Kim HT, Ha TJ, Oh JH, Shin SO, Baek IY. Effect of different planting times on the quantitative variation of total seed isoflavone content and composition in Korean soybean cultivars (Glycine max (L.) Merr.). J Crop Sci Biotechnol. 2021; 24:179–190.
5. Morgan HE, Dillaway D, Edwards TM. Estrogenicity of soybeans (Glycine max) varies by plant organ and developmental stage. Endocr Disruptors (Austin). 2014; 2:e28490.
6. Kurzer MS, Xu X. Dietary phytoestrogens. Annu Rev Nutr. 1997; 17:353–381. PMID: 9240932.
7. Bustamante-Rangel M, Delgado-Zamarreño MM, Pérez-Martín L, Rodríguez-Gonzalo E, Domínguez-Álvarez J. Analysis of Isoflavones in Foods. Compr Rev Food Sci Food Saf. 2018; 17:391–411. PMID: 33350079.
8. Křížová L, Dadáková K, Kašparovská J, Kašparovský T. Isoflavones. Molecules. 2019; 24:1076.
9. Setchell KD, Brown NM, Zimmer-Nechemias L, Brashear WT, Wolfe BE, Kirschner AS, Heubi JE. Evidence for lack of absorption of soy isoflavone glycosides in humans, supporting the crucial role of intestinal metabolism for bioavailability. Am J Clin Nutr. 2002; 76:447–453. PMID: 12145021.
10. Yuan JP, Wang JH, Liu X. Metabolism of dietary soy isoflavones to equol by human intestinal microflora--implications for health. Mol Nutr Food Res. 2007; 51:765–781. PMID: 17579894.
11. Rafii F, Davis C, Park M, Heinze TM, Beger RD. Variations in metabolism of the soy isoflavonoid daidzein by human intestinal microfloras from different individuals. Arch Microbiol. 2003; 180:11–16. PMID: 12783157.
12. Tang J, Wan Y, Zhao M, Zhong H, Zheng JS, Feng F. Legume and soy intake and risk of type 2 diabetes: a systematic review and meta-analysis of prospective cohort studies. Am J Clin Nutr. 2020; 111:677–688. PMID: 31915830.
13. Ruscica M, Pavanello C, Gandini S, Gomaraschi M, Vitali C, Macchi C, Morlotti B, Aiello G, Bosisio R, Calabresi L, et al. Effect of soy on metabolic syndrome and cardiovascular risk factors: a randomized controlled trial. Eur J Nutr. 2018; 57:499–511. PMID: 27757595.
14. Tokede OA, Onabanjo TA, Yansane A, Gaziano JM, Djoussé L. Soya products and serum lipids: a meta-analysis of randomised controlled trials. Br J Nutr. 2015; 114:831–843. PMID: 26268987.
15. Kokubo Y, Iso H, Ishihara J, Okada K, Inoue M, Tsugane S. JPHC Study Group. Association of dietary intake of soy, beans, and isoflavones with risk of cerebral and myocardial infarctions in Japanese populations: the Japan Public Health Center-based (JPHC) study cohort I. Circulation. 2007; 116:2553–2562. PMID: 18025534.
16. Sansai K, Na Takuathung M, Khatsri R, Teekachunhatean S, Hanprasertpong N, Koonrungsesomboon N. Effects of isoflavone interventions on bone mineral density in postmenopausal women: a systematic review and meta-analysis of randomized controlled trials. Osteoporos Int. 2020; 31:1853–1864. PMID: 32524173.
17. Lambert MN, Hu LM, Jeppesen PB. A systematic review and meta-analysis of the effects of isoflavone formulations against estrogen-deficient bone resorption in peri- and postmenopausal women. Am J Clin Nutr. 2017; 106:801–811. PMID: 28768649.
18. Nakamoto M, Otsuka R, Nishita Y, Tange C, Tomida M, Kato Y, Imai T, Sakai T, Ando F, Shimokata H. Soy food and isoflavone intake reduces the risk of cognitive impairment in elderly Japanese women. Eur J Clin Nutr. 2018; 72:1458–1462. PMID: 29348624.
19. Lin HC, Peng CH, Huang CN, Chiou JY. Soy-based foods are negatively associated with cognitive decline in Taiwan’s elderly. J Nutr Sci Vitaminol (Tokyo). 2018; 64:335–339. PMID: 30381623.
20. Tse G, Eslick GD. Soy and isoflavone consumption and risk of gastrointestinal cancer: a systematic review and meta-analysis. Eur J Nutr. 2016; 55:63–73. PMID: 25547973.
21. Jiang R, Botma A, Rudolph A, Hüsing A, Chang-Claude J. Phyto-oestrogens and colorectal cancer risk: a systematic review and dose-response meta-analysis of observational studies. Br J Nutr. 2016; 116:2115–2128. PMID: 28091359.
22. Applegate CC, Rowles JL 3rd, Ranard KM, Jeon S, Erdman JW. Soy consumption and the risk of prostate cancer: an updated systematic review and meta-analysis. Nutrients. 2018; 10:40.
23. Nagata C, Mizoue T, Tanaka K, Tsuji I, Tamakoshi A, Matsuo K, Wakai K, Inoue M, Tsugane S, Sasazuki S, et al. Soy intake and breast cancer risk: an evaluation based on a systematic review of epidemiologic evidence among the Japanese population. Jpn J Clin Oncol. 2014; 44:282–295. PMID: 24453272.
24. Qiu S, Jiang C. Soy and isoflavones consumption and breast cancer survival and recurrence: a systematic review and meta-analysis. Eur J Nutr. 2019; 58:3079–3090. PMID: 30382332.
25. Franco OH, Chowdhury R, Troup J, Voortman T, Kunutsor S, Kavousi M, Oliver-Williams C, Muka T. Use of plant-based therapies and menopausal symptoms: a systematic review and meta-analysis. JAMA. 2016; 315:2554–2563. PMID: 27327802.
26. Li N, Wu X, Zhuang W, Xia L, Chen Y, Zhao R, Yi M, Wan Q, Du L, Zhou Y. Soy and isoflavone consumption and multiple health outcomes: umbrella review of systematic reviews and meta-analyses of observational studies and randomized trials in humans. Mol Nutr Food Res. 2020; 64:e1900751. PMID: 31584249.
27. Cederroth CR, Zimmermann C, Nef S. Soy, phytoestrogens and their impact on reproductive health. Mol Cell Endocrinol. 2012; 355:192–200. PMID: 22210487.
28. Bennetau-Pelissero C. Risks and benefits of phytoestrogens: where are we now? Curr Opin Clin Nutr Metab Care. 2016; 19:477–483. PMID: 27749767.
29. Adgent MA, Daniels JL, Edwards LJ, Siega-Riz AM, Rogan WJ. Early-life soy exposure and gender-role play behavior in children. Environ Health Perspect. 2011; 119:1811–1816. PMID: 21813368.
30. Kim J, Kim S, Huh K, Kim Y, Joung H, Park M. High serum isoflavone concentrations are associated with the risk of precocious puberty in Korean girls. Clin Endocrinol (Oxf). 2011; 75:831–835. PMID: 21623856.
31. Domínguez-López I, Yago-Aragón M, Salas-Huetos A, Tresserra-Rimbau A, Hurtado-Barroso S. Effects of dietary phytoestrogens on hormones throughout a human lifespan: a review. Nutrients. 2020; 12:2456.
32. Messina M, Nagata C, Wu AH. Estimated Asian adult soy protein and isoflavone intakes. Nutr Cancer. 2006; 55:1–12. PMID: 16965235.
33. Wakai K, Egami I, Kato K, Kawamura T, Tamakoshi A, Lin Y, Nakayama T, Wada M, Ohno Y. Dietary intake and sources of isoflavones among Japanese. Nutr Cancer. 1999; 33:139–145. PMID: 10368808.
34. Chan SG, Ho SC, Kreiger N, Darlington G, So KF, Chong PY. Dietary sources and determinants of soy isoflavone intake among midlife Chinese women in Hong Kong. J Nutr. 2007; 137:2451–2455. PMID: 17951484.
35. Kim K, Vance TM, Chun OK. Estimated intake and major food sources of flavonoids among US adults: changes between 1999-2002 and 2007-2010 in NHANES. Eur J Nutr. 2016; 55:833–843. PMID: 26026481.
36. Chun OK, Chung SJ, Song WO. Urinary isoflavones and their metabolites validate the dietary isoflavone intakes in US adults. J Am Diet Assoc. 2009; 109:245–254. PMID: 19167951.
37. Mulligan AA, Welch AA, McTaggart AA, Bhaniani A, Bingham SA. Intakes and sources of soya foods and isoflavones in a UK population cohort study (EPIC-Norfolk). Eur J Clin Nutr. 2007; 61:248–254. PMID: 16943849.
38. Mulligan AA, Kuhnle GG, Lentjes MA, van Scheltinga V, Powell NA, McTaggart A, Bhaniani A, Khaw KT. Intakes and sources of isoflavones, lignans, enterolignans, coumestrol and soya-containing foods in the Norfolk arm of the European Prospective Investigation into Cancer and Nutrition (EPIC-Norfolk), from 7 d food diaries, using a newly updated database. Public Health Nutr. 2013; 16:1454–1462. PMID: 22939391.
39. van Erp-Baart MA, Brants HA, Kiely M, Mulligan A, Turrini A, Sermoneta C, Kilkkinen A, Valsta LM. Isoflavone intake in four different European countries: the VENUS approach. Br J Nutr. 2003; 89(Suppl 1):S25–S30. PMID: 12725653.
40. Murphy KJ, Walker KM, Dyer KA, Bryan J. Estimation of daily intake of flavonoids and major food sources in middle-aged Australian men and women. Nutr Res. 2019; 61:64–81. PMID: 30683440.
41. Zamora-Ros R, Andres-Lacueva C, Lamuela-Raventós RM, Berenguer T, Jakszyn P, Barricarte A, Ardanaz E, Amiano P, Dorronsoro M, Larrañaga N, et al. Estimation of dietary sources and flavonoid intake in a Spanish adult population (EPIC-Spain). J Am Diet Assoc. 2010; 110:390–398. PMID: 20184989.
42. Kim J, Kwon C. Estimated dietary isoflavone intake of Korean population based on national nutrition survey. Nutr Res. 2001; 21:947–953. PMID: 11446978.
43. Lee MJ, Kim MJ, Min SH, Yoon S. A study on the attitude of soy food and estimated dietary isoflavone intake among Korean adolescents. Korean J Community Nutr. 2004; 9:606–614.
44. Lee SK, Lee MJ, Yoon S, Kwon DJ. Estimated isoflavone intake from soy products in Korean middle-aged women. J Korean Soc Food Sci Nutr. 2000; 29:948–956.
45. Lee MJ, Kim JH. Estimated dietary isoflavone intake among Korean adults. Nutr Res Pract. 2007; 1:206–211. PMID: 20368940.
46. Kweon S, Kim Y, Jang MJ, Kim Y, Kim K, Choi S, Chun C, Khang YH, Oh K. Data resource profile: the Korea National Health and Nutrition Examination Survey (KNHANES). Int J Epidemiol. 2014; 43:69–77. PMID: 24585853.
47. Korea Centers for Disease Control and Prevention. Findings from Korea National Health and Nutrition Examination Survey [Internet]. Cheongju: Korea Centers for Disease Control and Prevention;2018. cited 2021 June 12. Available from: https://knhanes.kdca.go.kr/knhanes/sub01/sub01_05.do#s5_02.
48. Korea Disease Control and Prevention Agency. Survey contents [Internet]. Cheongju: Korea Disease Control and Prevention Agency;2021. cited 2020 January 12. Available from: https://knhanes.kdca.go.kr/knhanes/sub02/sub02_03.do#s8_04.
49. Park M. Preparation of Korean isoflavone database and evaluation of isoflavone intake among Korean adolescents [master’s thesis]. Seoul: Seoul National University;2005.
50. Bhagwat S, Haytowitz DB, Holden JM. USDA Database for the Isoflavone Content of Selected Foods, Release 2.0. Washington, D.C.: U.S. Department of Agriculture, Agricultural Research Service, Nutrient Data Laboratory;2008.
51. Zamora-Ros R, Knaze V, Luján-Barroso L, Kuhnle GG, Mulligan AA, Touillaud M, Slimani N, Romieu I, Powell N, Tumino R, et al. Dietary intakes and food sources of phytoestrogens in the European Prospective Investigation into Cancer and Nutrition (EPIC) 24-hour dietary recall cohort. Eur J Clin Nutr. 2012; 66:932–941. PMID: 22510793.
52. Bai W, Wang C, Ren C. Intakes of total and individual flavonoids by US adults. Int J Food Sci Nutr. 2014; 65:9–20. PMID: 24020353.
53. Bosetti C, Rossi M, McLaughlin JK, Negri E, Talamini R, Lagiou P, Montella M, Ramazzotti V, Franceschi S, LaVecchia C. Flavonoids and the risk of renal cell carcinoma. Cancer Epidemiol Biomarkers Prev. 2007; 16:98–101. PMID: 17220336.
54. Ovaskainen ML, Törrönen R, Koponen JM, Sinkko H, Hellström J, Reinivuo H, Mattila P. Dietary intake and major food sources of polyphenols in Finnish adults. J Nutr. 2008; 138:562–566. PMID: 18287367.
55. Peterson J, Lagiou P, Samoli E, Lagiou A, Katsouyanni K, La Vecchia C, Dwyer J, Trichopoulos D. Flavonoid intake and breast cancer risk: a case--control study in Greece. Br J Cancer. 2003; 89:1255–1259. PMID: 14520456.
56. Kim J, Kim HJ, Joung H, Park MK, Li S, Song Y, Franke AA, Paik HY. Overnight urinary excretion of isoflavones as an indicator for dietary isoflavone intake in Korean girls of pubertal age. Br J Nutr. 2010; 104:709–715. PMID: 20385037.
57. Park MK, Song Y, Joung H, Li SJ, Paik HY. Establishment of an isoflavone database for usual Korean foods and evaluation of isoflavone intake among Korean children. Asia Pac J Clin Nutr. 2007; 16:129–139. PMID: 17215190.
58. Lee HS, Cho YH, Park J, Shin HR, Sung MK. Dietary intake of phytonutrients in relation to fruit and vegetable consumption in Korea. J Acad Nutr Diet. 2013; 113:1194–1199. PMID: 23830325.
59. Wada K, Nakamura K, Masue T, Sahashi Y, Ando K, Nagata C. Soy intake and urinary sex hormone levels in preschool Japanese children. Am J Epidemiol. 2011; 173:998–1003. PMID: 21427172.
60. Hu XJ, Song WR, Gao LY, Nie SP, Eisenbrand G, Xie MY. Assessment of dietary phytoestrogen intake via plant-derived foods in China. Food Addit Contam Part A Chem Anal Control Expo Risk Assess. 2014; 31:1325–1335. PMID: 24950423.
61. Hsiao AKF, Lyons-Wall PM. Soy consumption in Taiwanese children in Taipei. J Nutr. 2000; 130:705S.
TOOLS
Similar articles