Journal List > Nutr Res Pract > v.16(3) > 1162201

Song and Shim: Food behaviors accounting for the recent trends in dietary fatty acid profiles among Korean adults

Abstract

BACKGROUND/OBJECTIVES

This study examined the changes in food behaviors of dietary fatty acids over 2007–2018 among Korean adults.

SUBJECTS/METHODS

This study used data from the 4th (2007–2009), 5th (2010–2012), 6th (2013–2015), and 7th (2016–2018) Korea National Health and Nutrition Examination Surveys. A total of 46,307 adults aged 19–64 yrs were selected and dietary data were obtained from a single 24-h recall. In the 4th and 7th data, the major food sources for each fatty acid based on the contributing percentage of the food item were compared. The consumption trends in the major food sources were presented as grams per day over 2007–2018 and compared across the survey periods using the multiple regression model.

RESULTS

From 2007 to 2018, for total fat, saturated fatty acid (SFA), and monounsaturated fatty acid, the contribution of animal food sources, including beef, chicken, and eggs increased but plant food sources (e.g., tofu, soybean, and plant oil) decreased. As polyunsaturated fatty acid sources, mayonnaise, eggs, and bread showed higher contributions, whereas soybean and tofu showed lower contributions in the 7th data compared to the 4th data. For n-3 fatty acids, the contribution of fish decreased between the 4th and 7th data. Over 12 yrs, the significant increases in the absolute amount of consumption from animal sources were observed. In contrast, decreases in the consumption from plant sources and fish were seen across the survey periods.

CONCLUSIONS

In Korean adults, increases in the intake of dietary fatty acids along with changes in the food behaviors during 2007–2018 have evoked great concern for SFA intake, which is a cardiovascular disease risk factor. Healthy food sources of dietary fatty acids should be emphasized in this population.

INTRODUCTION

Each type of dietary fatty acid has a different association with health outcomes. Replacing saturated fatty acid (SFA) with polyunsaturated fatty acid (PUFA) is known to decrease the risk of coronary heart disease, and PUFA intake is related to a reduced risk of diabetes mellitus [1]. In addition, a previous study showed that food sources of SFA had different associations with cardiovascular disease (CVD) risk. Meat SFA was positively associated but dairy SFA was inversely associated with CVD [2]. Therefore, a balanced intake of dietary fatty acids, including healthy food sources, as well as an adequate intake of different types of fatty acids is needed to decrease the risk of chronic diseases.
The food sources of dietary fats differ by country as well as by the type of fatty acids. In Western countries, the major food sources of SFA have been reported to be meat, dairy products, and sugary desserts (e.g., cookies, cakes, pies, pastries, and puddings) and PUFA is mainly obtained from vegetable oils [3456]. PUFAs are also consumed from other food sources, such as meat and processed meat, dairy products, cereals, potato chips, margarine, mayonnaise, bread, and cakes [3578]. In Chinese adults, the main fat source was vegetable oil, which contributed about 40% or more to the total fat intake and showed an upward trend in the contribution to total fat over time [9]. In a study of US adults, among the food sources of fat, the consumption of eggs, cheese, ice cream, butter, and processed meat increased, whereas the intake of milk, poultry, and bread decreased from 1991 to 2008 [10].
The Korean adult population has traditionally consumed a high-carbohydrate diet and a lower intake of dietary fats than Western populations. However, significant increasing trends in dietary fat intake among Korean adults have been observed over the past decade [11]. In a previous study, prominent increases in the intake of SFA and monounsaturated fatty acid (MUFA) accompanied by a continuous increase in total fat intake over 2007–2015 were observed in Korean adults, but only tiny changes in PUFA intake [11]. A recent study reported that about 38% of Korean adults consumed more SFA than the dietary guidelines recommend [12]. Furthermore, Korean adolescents also showed increasing trends in dietary fat consumption, particularly in SFA and MUFA [13]. Based on these findings, the dietary fat intake of the entire Korean population can be expected to increase in the future.
The evaluation of food sources by the type of dietary fatty acid may help to identify the eating behaviors and food choices associated with higher fat intake as well as the increased risk of chronic diseases in Korean adults. In addition, monitoring changes in food consumption related to dietary fats can be used to suggest public health policies, such as food-based dietary guidelines for the appropriate amount and sources of dietary fats. However, scant research has identified current trends in the food sources of dietary fats in Korean adults. Therefore, this study examined the changes in the major food sources of dietary fats and the consumption of food sources over 12 yrs using data from the 2007–2018 Korea National Health and Nutrition Examination Surveys (KNHANES).

SUBJECTS AND METHODS

Data and study subjects

The KNHANES is a cross-sectional survey, which is conducted every year by the Korea Disease Control and Prevention Agency to collect information on the nutritional health status of Koreans. The survey participants are recruited from a nationally representative sample of non-institutionalized Korean individuals aged one year or older, employing multistage stratified cluster sampling. This survey consists of a health interview survey, a health examination survey, and a nutrition survey. Detailed information on the survey is described elsewhere [14].
Among the 49,513 Korean adults aged 19–64 yrs who participated in the 2007–2018 KNHANES nutrition survey, those who 1) had a daily energy intake of < 500 kcal or > 5,000 kcal, 2) had no information on household income, and 3) were pregnant or breastfeeding were excluded. Finally, a total of 46,307 adults (19,715 men and 26,592 women) were included in the data analysis. This study was performed in accordance with the Declaration of Helsinki and approved by the Institutional Review Board of the Korea Disease Control and Prevention Agency (2007-02CON-04-P, 2008-04EXP-01-C, 2009-01CON-03-2C, 2010-02CON-21-C, 2011-02CON-06-C, 2012-01EXP-01-2C, 2013-07CON-03-4C, 2013-12 EXP-03-5C, and 2018-01-03-P-A). Written informed consent was obtained from all study subjects.

Dietary assessment

The dietary intake data used in this study were obtained by the use of a 24-h dietary recall method as part of the nutrition survey. To evaluate dietary fatty acid intake and its food sources, a fatty acids database of common Korean foods was used [15]. This database was developed in 2014 to assess the intake of dietary fatty acids in Koreans who participated in the KNHANES and contains the fatty acid content of 5,144 food items based on the values from domestic and foreign sources. The process of developing the database is described in detail elsewhere [15].
For the calculation of fatty acid intakes based on dietary data from the 4th and 5th KNHANES which were conducted prior to the establishment of fatty acids database, the fatty acid contents per 100 g of foods that appeared in the 6th KNHANES dataset were mainly used. Among 3,193 food items (100%) which appeared in the 4th and 5th KNHANES dataset, 2,196 food items (68.8%) were matched to the foods included in the 6th KNAHNES dataset. For 997 food items (31.2%) that were not included in the 6th KNHANES dataset, the fatty acid contents were replaced with calculated or imputed values of the fatty acid contents from similar Korean foods (922 food items, 28.9%) or from the U.S. Department of Agriculture fatty acid database (39 food items, 1.2%). About 1.1% of food items (36 food items) which had very low fat contents and no available data were considered as the fatty acid contents was zero. For foods that was consisted of several food items (e.g., sandwich, pizza, hamburger, or fried rice with shrimp), the fatty acid contents of the main food source for total fat were applied.
To identify changes in the main food sources of dietary fatty acids over time, the 4th (2007–2009) and 7th (2016–2018) KNHANES data were used. In the 4th and 7th survey data, the top 10 food sources of total fat, SFA, MUFA, PUFA, n-3 fatty acid (n-3 FA), and n-6 fatty acid (n-6 FA) were selected by gender. The major food sources were determined by dividing the amount of each fatty acid provided by a food item by the total intake for each fatty acid, and ranked based on the contributing percentage of the food item from the highest to the lowest. Using the 4th, 5th (2010–2012), 6th (2013–2015), and 7th KNHANES data, trends in the consumption of the food items that appeared as major food sources of dietary fatty acids in the 4th and 7th KNHANES data were evaluated by gender. The intake of a food item was calculated as individual consumption (g) per day.

Statistical analyses

All statistical analyses were conducted using SAS version 9.4 (SAS Institute, Cary, NC, USA). All analyses accounted for the multi-stage complex sampling design effect and used appropriate sampling weights using the PROC SURVEY procedures in the SAS software to produce estimates of the entire Korean adult population from the representative survey sample. Dietary fatty acid intake was evaluated in grams per day and the proportion of energy is presented as means and SE across the survey period by gender. The major food sources of dietary fatty acids are expressed as contributing percentages and the cumulative percentage of each food item. The consumption of food sources (g/day) is expressed as means and SE across the survey period. Linear trends in the intakes of fatty acids and food sources across the survey period were compared using the multiple linear regression model after adjusting for gender, age, living area, household income, and total energy intake, where applicable. All P-values of < 0.05 were considered statistically significant.

RESULTS

Trends in dietary fat intake over 2007–2018

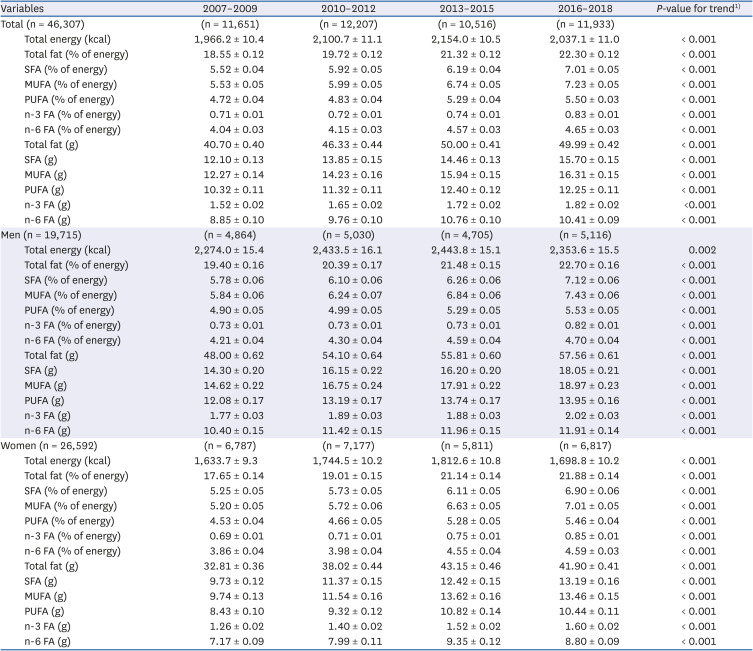
Table 1 shows the intake of energy and dietary fats across the survey periods by gender. The intake of total energy and all types of dietary fatty acids significantly increased across the survey yrs in both men and women. Over 2007–2018, the total fat intake showed an upward trend from 40.7 g (18.6% of energy) to 50.0 g (22.3% of energy) in the total subjects, from 48.0 g (19.4% of energy) to 57.6 g (22.7% of energy) in men and 32.8 g (17.7% of energy) to 41.9 g (21.9% of energy) in women. The percentage of energy from SFA also increased in the total subjects (5.5–7.0% of energy), in men (5.8–7.1% of energy), and in women (5.3–6.9% of energy). The MUFA and PUFA intake evaluated as g/day and the percentage of energy increased in both genders over 2007– 2018 (P < 0.001). The n-3 FA intake in the total subjects increased from 1.5 g to 1.8 g (P < 0.001) from 2007 through 2018, as did the proportion of energy from n-3 FA, which increased from 0.7 to 0.8% of the energy (P < 0.001). The n-6 FA intake increased across the survey periods from 8.9 g (4.0% of energy) to 10.4 g (4.7% of energy) in the total subjects, from 10.4 g (4.2% of energy) to 11.9 g (4.7% of energy) in men, and from 7.2 g (3.9% of energy) to 8.8 g (4.6% of energy) in women.
Table 1

Trends in intake of energy and dietary fatty acids over 12 yrs based on the 2007–2018 KNHANES data by gender

nrp-16-405-i001
Variables 2007–2009 2010–2012 2013–2015 2016–2018 P-value for trend1)
Total (n = 46,307) (n = 11,651) (n = 12,207) (n = 10,516) (n = 11,933)
Total energy (kcal) 1,966.2 ± 10.4 2,100.7 ± 11.1 2,154.0 ± 10.5 2,037.1 ± 11.0 < 0.001
Total fat (% of energy) 18.55 ± 0.12 19.72 ± 0.12 21.32 ± 0.12 22.30 ± 0.12 < 0.001
SFA (% of energy) 5.52 ± 0.04 5.92 ± 0.05 6.19 ± 0.04 7.01 ± 0.05 < 0.001
MUFA (% of energy) 5.53 ± 0.05 5.99 ± 0.05 6.74 ± 0.05 7.23 ± 0.05 < 0.001
PUFA (% of energy) 4.72 ± 0.04 4.83 ± 0.04 5.29 ± 0.04 5.50 ± 0.03 < 0.001
n-3 FA (% of energy) 0.71 ± 0.01 0.72 ± 0.01 0.74 ± 0.01 0.83 ± 0.01 < 0.001
n-6 FA (% of energy) 4.04 ± 0.03 4.15 ± 0.03 4.57 ± 0.03 4.65 ± 0.03 < 0.001
Total fat (g) 40.70 ± 0.40 46.33 ± 0.44 50.00 ± 0.41 49.99 ± 0.42 < 0.001
SFA (g) 12.10 ± 0.13 13.85 ± 0.15 14.46 ± 0.13 15.70 ± 0.15 < 0.001
MUFA (g) 12.27 ± 0.14 14.23 ± 0.16 15.94 ± 0.15 16.31 ± 0.15 < 0.001
PUFA (g) 10.32 ± 0.11 11.32 ± 0.11 12.40 ± 0.12 12.25 ± 0.11 < 0.001
n-3 FA (g) 1.52 ± 0.02 1.65 ± 0.02 1.72 ± 0.02 1.82 ± 0.02 <0.001
n-6 FA (g) 8.85 ± 0.10 9.76 ± 0.10 10.76 ± 0.10 10.41 ± 0.09 < 0.001
Men (n = 19,715) (n = 4,864) (n = 5,030) (n = 4,705) (n = 5,116)
Total energy (kcal) 2,274.0 ± 15.4 2,433.5 ± 16.1 2,443.8 ± 15.1 2,353.6 ± 15.5 0.002
Total fat (% of energy) 19.40 ± 0.16 20.39 ± 0.17 21.48 ± 0.15 22.70 ± 0.16 < 0.001
SFA (% of energy) 5.78 ± 0.06 6.10 ± 0.06 6.26 ± 0.06 7.12 ± 0.06 < 0.001
MUFA (% of energy) 5.84 ± 0.06 6.24 ± 0.07 6.84 ± 0.06 7.43 ± 0.06 < 0.001
PUFA (% of energy) 4.90 ± 0.05 4.99 ± 0.05 5.29 ± 0.05 5.53 ± 0.05 < 0.001
n-3 FA (% of energy) 0.73 ± 0.01 0.73 ± 0.01 0.73 ± 0.01 0.82 ± 0.01 < 0.001
n-6 FA (% of energy) 4.21 ± 0.04 4.30 ± 0.04 4.59 ± 0.04 4.70 ± 0.04 < 0.001
Total fat (g) 48.00 ± 0.62 54.10 ± 0.64 55.81 ± 0.60 57.56 ± 0.61 < 0.001
SFA (g) 14.30 ± 0.20 16.15 ± 0.22 16.20 ± 0.20 18.05 ± 0.21 < 0.001
MUFA (g) 14.62 ± 0.22 16.75 ± 0.24 17.91 ± 0.22 18.97 ± 0.23 < 0.001
PUFA (g) 12.08 ± 0.17 13.19 ± 0.17 13.74 ± 0.17 13.95 ± 0.16 < 0.001
n-3 FA (g) 1.77 ± 0.03 1.89 ± 0.03 1.88 ± 0.03 2.02 ± 0.03 < 0.001
n-6 FA (g) 10.40 ± 0.15 11.42 ± 0.15 11.96 ± 0.15 11.91 ± 0.14 < 0.001
Women (n = 26,592) (n = 6,787) (n = 7,177) (n = 5,811) (n = 6,817)
Total energy (kcal) 1,633.7 ± 9.3 1,744.5 ± 10.2 1,812.6 ± 10.8 1,698.8 ± 10.2 < 0.001
Total fat (% of energy) 17.65 ± 0.14 19.01 ± 0.15 21.14 ± 0.14 21.88 ± 0.14 < 0.001
SFA (% of energy) 5.25 ± 0.05 5.73 ± 0.05 6.11 ± 0.05 6.90 ± 0.06 < 0.001
MUFA (% of energy) 5.20 ± 0.05 5.72 ± 0.06 6.63 ± 0.05 7.01 ± 0.05 < 0.001
PUFA (% of energy) 4.53 ± 0.04 4.66 ± 0.05 5.28 ± 0.05 5.46 ± 0.04 < 0.001
n-3 FA (% of energy) 0.69 ± 0.01 0.71 ± 0.01 0.75 ± 0.01 0.85 ± 0.01 < 0.001
n-6 FA (% of energy) 3.86 ± 0.04 3.98 ± 0.04 4.55 ± 0.04 4.59 ± 0.03 < 0.001
Total fat (g) 32.81 ± 0.36 38.02 ± 0.44 43.15 ± 0.46 41.90 ± 0.41 < 0.001
SFA (g) 9.73 ± 0.12 11.37 ± 0.15 12.42 ± 0.15 13.19 ± 0.16 < 0.001
MUFA (g) 9.74 ± 0.13 11.54 ± 0.16 13.62 ± 0.16 13.46 ± 0.15 < 0.001
PUFA (g) 8.43 ± 0.10 9.32 ± 0.12 10.82 ± 0.14 10.44 ± 0.11 < 0.001
n-3 FA (g) 1.26 ± 0.02 1.40 ± 0.02 1.52 ± 0.02 1.60 ± 0.02 < 0.001
n-6 FA (g) 7.17 ± 0.09 7.99 ± 0.11 9.35 ± 0.12 8.80 ± 0.09 < 0.001
Data are shown as mean ± SE.
All analyses accounted for the multi-stage complex sampling design effect and used appropriate sampling weights using the SURVEY procedures in the SAS software.
KNHANES, Korea National Health and Nutrition Examination Surveys; SFA, saturated fatty acid; MUFA, monounsaturated fatty acid; PUFA, polyunsaturated fatty acid; FA, fatty acid.
1)Linear trends in the intakes of energy and dietary fatty acids across the survey periods were compared using the multiple linear regression model after adjusting for gender, age, living area, household income, and total energy intake, where applicable.

Major food sources of dietary fats in the 4th and 7th KNHANES data

Table 2 presents the percentage of fat contributed by different food sources for each type of fatty acid in the 4th (2007–2009) and 7th (2016–2018) KNHANES dataset. Each type of dietary fatty acid showed different food sources and changes in the food fat sources were observed between the survey yrs in Korean adults. Pork showed the greatest contribution to total fat, SFA, and MUFA in both the 4th and 7th KNHANES data, but the percentage contribution was lower in the 7th survey data than in the 4th survey data. From the 4th to the 7th survey yrs, the contributing percentage of animal food sources, including beef, chicken, and eggs increased for total fat, SFA, and MUFA, whereas milk and plant food sources (e.g., tofu and plant oils) decreased. In the 4th survey data, 24.5% of the SFA came from meat (pork, beef, and chicken) while in the 7th survey data, 30% of the SFA came from meat. Bread, snacks, and mayonnaise also accounted for higher contributions to the total fat, SFA, and MUFA in the 7th survey data compared to the 4th survey data.
Table 2

Contribution of major food sources to dietary fatty acid intake in the 4th (2007–2009) and 7th (2016–2018) KNHANES data1)

nrp-16-405-i002
Rank 4th KNHANES (2007–2009) (n = 11,651) 7th KNHANES (2016–2018) (n = 11,933)
Food % Cumulative % Food % Cumulative %
Total fat
1 Pork 15.6 15.6 Pork 14.0 14.0
2 Soybean oil 9.3 24.9 Beef 9.1 23.0
3 Ramyeon 5.3 30.2 Soybean oil 7.3 30.3
4 Beef 4.8 34.9 Eggs 5.7 36.0
5 Sesame oil 4.5 39.4 Mayonnaise 4.7 40.6
6 Milk 4.3 43.7 Ramyeon 4.2 44.8
7 Eggs 4.3 48.0 Bread 3.6 48.4
8 Tofu 3.5 51.5 Chicken 3.6 52.0
9 Mayonnaise 2.8 54.2 Milk 3.5 55.5
10 Coffee 2.8 57.0 Sesame oil 3.2 58.8
SFA
1 Pork 19.7 19.7 Pork 16.2 16.2
2 Milk 9.8 29.6 Beef 10.8 26.9
3 Ramyeon 7.9 37.5 Milk 7.5 34.4
4 Coffee 5.1 42.6 Ramyeon 6.0 40.3
5 Beef 4.8 47.4 Eggs 5.4 45.8
6 Soybean oil 4.4 51.8 Bread 4.3 50.0
7 Eggs 4.0 55.8 Coffee 3.5 53.5
8 White rice 3.6 59.4 Soybean oil 3.4 56.9
9 Coffee creamer 3.6 63.0 Chicken 3.0 59.9
10 Sesame oil 2.2 65.2 Snacks, biscuits, and cookies 2.9 62.7
MUFA
1 Pork 23.1 23.1 Pork 18.1 18.1
2 Soybean oil 7.2 30.3 Beef 12.0 30.1
3 Beef 6.0 36.4 Eggs 7.0 37.1
4 Ramyeon 5.8 42.2 Soybean oil 5.0 42.1
5 Sesame oil 5.6 47.8 Chicken 4.5 46.6
6 Eggs 5.5 53.2 Ramyeon 4.3 50.9
7 Milk 4.1 57.4 Sesame oil 3.8 54.7
8 Tofu 2.4 59.7 Bread 3.3 58.0
9 Bread 2.2 61.9 Mayonnaise 3.0 61.0
10 Mayonnaise 2.0 63.9 Snacks, biscuits, and cookies 2.7 63.7
PUFA
1 Soybean oil 21.0 21.0 Soybean oil 16.9 16.9
2 Pork 7.9 28.8 Mayonnaise 10.9 27.8
3 Sesame oil 7.5 36.3 Pork 7.1 34.9
4 Tofu 6.8 43.1 Sesame oil 5.6 40.5
5 Soybean 6.2 49.3 Eggs 4.8 45.2
6 Mayonnaise 6.1 55.4 Tofu 4.5 49.8
7 Ramyeon 3.0 58.4 Bread 2.8 52.5
8 Eggs 2.8 61.1 Soybean 2.4 55.0
9 White rice 2.3 63.5 Ramyeon 2.2 57.2
10 Bread 1.9 65.4 Perilla oil 2.2 59.3
n-3 FA
1 Soybean oil 18.4 18.4 Soybean oil 13.5 13.5
2 Mackerel 6.8 25.2 Perilla oil 11.6 25.0
3 Perilla oil 6.3 31.5 Mayonnaise 9.0 34.0
4 Soybean 5.2 36.7 Mackerel 5.6 39.7
5 Mayonnaise 4.8 41.5 Perilla seed 5.1 44.7
6 Tofu 4.7 46.2 Tofu 3.8 48.5
7 Anchovies 4.3 50.5 Pork 3.4 51.9
8 Perilla seed 4.2 54.7 Canola oil 3.4 55.3
9 Soybean paste 3.0 57.7 Eggs 2.7 58.0
10 Saury 2.7 60.4 Soybean 2.2 60.2
n-6 FA
1 Soybean oil 22.0 22.0 Soybean oil 17.7 17.7
2 Pork 9.4 31.3 Mayonnaise 11.3 29.0
3 Sesame oil 8.5 39.8 Pork 8.0 37.1
4 Tofu 7.3 47.2 Sesame oil 6.4 43.5
5 Soybean 6.3 53.5 Eggs 5.0 48.5
6 Mayonnaise 6.3 59.7 Tofu 4.7 53.2
7 Ramyeon 3.4 63.2 Bread 2.9 56.2
8 Eggs 2.7 65.9 Ramyeon 2.5 58.7
9 White rice 2.7 68.6 Soybean 2.5 61.2
10 Sesame seeds 1.9 70.5 Chicken 2.4 63.5
KNHANES, Korea National Health and Nutrition Examination Surveys; SFA, saturated fatty acid; MUFA, monounsaturated fatty acid; PUFA, polyunsaturated fatty acid; FA, fatty acid.
1)In the 4th and 7th survey data, the contribution (%) of major food sources to the intake of total fat, SFA, MUFA, PUFA, n-3 FA, and n-6 FA was determined by the ratio of each fatty acid provided by a food item to the total intake of each fatty acid from all food items. For each fatty acid, the top 10 food items were ranked based on the contribution (%) of the food item from the highest to the lowest.
The main food source of PUFA was soybean oil both in the 4th (21.0%) and 7th (16.9%) survey data. In the 7th survey data, mayonnaise and pork became the second and third main food sources, respectively, for PUFA. As the PUFA sources, mayonnaise, eggs, and bread showed higher contributions, whereas soybean and tofu showed lower contributions in the 7th survey data compared to the 4th survey data. For n-3 FA, the percentage contribution of fish, such as mackerel, anchovies, and saury, as well as bean products, decreased between the 4th and 7th survey data. Perilla oil and canola oil showed higher contributions in the 7th survey data than in the 4th survey data, whereas soybean oil decreased in n-3 FA contribution during the survey yrs. In the 7th survey data, mayonnaise (9.0%), pork (3.4%), and eggs (2.7%) were included in the top 10 food sources of n-3 FA.

Differences in food sources of dietary fatty acid by gender

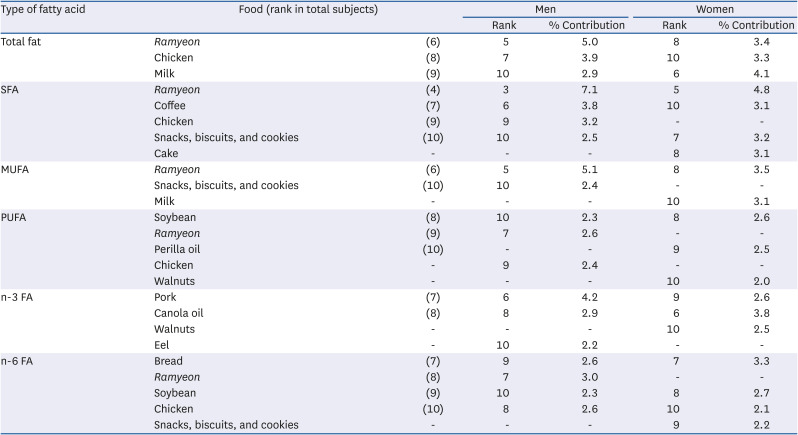
Table 3 presents the food sources showing differences in the contribution to each type of fatty acid intake between men and women based on the 2016–2018 KNHANES data. Among the top 10 food sources for each type of fatty acid intake by gender, the foods showing differences of more than one rank between men and women are presented. The differences between men and women were mainly observed in lower-ranked food sources for most types of fatty acid intake. For SFA, PUFA, and n-6 FA, 5 food sources showed differences of more than one rank between men and women, whereas MUFA had 3 food sources showing differences in ranks by gender. For total fat, SFA, and MUFA, ramyeon (instant noodle), chicken, and coffee had higher contributions and rank for fatty acid intake in men than in women, but women showed higher contributions and rank for milk and cake. In terms of PUFA, including n-3 FA and n-6 FA, ramyeon, chicken, pork, and eel ranked more highly in men than in women whereas soybean, vegetable oils, walnuts, bread, and snacks ranked more highly in women than in men.
Table 3

Food sources showing differences in the contribution to each type of fatty acid intake between men and women based on the 2016–2018 KNHANES data1)

nrp-16-405-i003
Type of fatty acid Food (rank in total subjects) Men Women
Rank % Contribution Rank % Contribution
Total fat Ramyeon (6) 5 5.0 8 3.4
Chicken (8) 7 3.9 10 3.3
Milk (9) 10 2.9 6 4.1
SFA Ramyeon (4) 3 7.1 5 4.8
Coffee (7) 6 3.8 10 3.1
Chicken (9) 9 3.2 - -
Snacks, biscuits, and cookies (10) 10 2.5 7 3.2
Cake - - - 8 3.1
MUFA Ramyeon (6) 5 5.1 8 3.5
Snacks, biscuits, and cookies (10) 10 2.4 - -
Milk - - - 10 3.1
PUFA Soybean (8) 10 2.3 8 2.6
Ramyeon (9) 7 2.6 - -
Perilla oil (10) - - 9 2.5
Chicken - 9 2.4 - -
Walnuts - - - 10 2.0
n-3 FA Pork (7) 6 4.2 9 2.6
Canola oil (8) 8 2.9 6 3.8
Walnuts - - - 10 2.5
Eel - 10 2.2 - -
n-6 FA Bread (7) 9 2.6 7 3.3
Ramyeon (8) 7 3.0 - -
Soybean (9) 10 2.3 8 2.7
Chicken (10) 8 2.6 10 2.1
Snacks, biscuits, and cookies - - - 9 2.2
KNHANES, Korea National Health and Nutrition Examination Surveys; SFA, saturated fatty acid; MUFA, monounsaturated fatty acid; PUFA, polyunsaturated fatty acid; FA, fatty acid.
1)Among the top 10 food sources for each type of fatty acid intake by gender, foods showing a difference of more than one rank between men and women are presented.

Changes in consumption of foods contributing to dietary fatty acid intake over 2007–2018

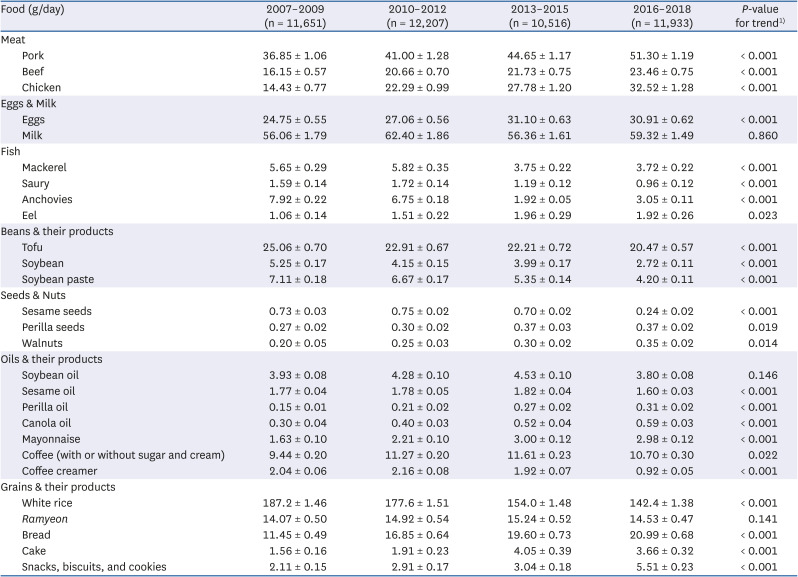
The trends in the consumption of food sources contributing to fatty acid intake over 2007–2018 are shown in Table 4. Between 2007 and 2018 in Korean adults, changes observed in the consumption of food source of fatty acid were significantly increased consumption in meat, eggs, perilla oil, canola oil, mayonnaise, bread, cake, and snacks evaluated by the absolute amount of consumption. In contrast, over 12 yrs, decreases in consumption were seen in mackerel, saury, anchovies, beans and their products, sesame seeds and oil, coffee creamer, and white rice (P < 0.001).
Table 4

Trends in the consumption of foods contributing to dietary fatty acid intake over 12 yrs based on the 2007–2018 KNHANES data

nrp-16-405-i004
Food (g/day) 2007–2009 (n = 11,651) 2010–2012 (n = 12,207) 2013–2015 (n = 10,516) 2016–2018 (n = 11,933) P-value for trend1)
Meat
Pork 36.85 ± 1.06 41.00 ± 1.28 44.65 ± 1.17 51.30 ± 1.19 < 0.001
Beef 16.15 ± 0.57 20.66 ± 0.70 21.73 ± 0.75 23.46 ± 0.75 < 0.001
Chicken 14.43 ± 0.77 22.29 ± 0.99 27.78 ± 1.20 32.52 ± 1.28 < 0.001
Eggs & Milk
Eggs 24.75 ± 0.55 27.06 ± 0.56 31.10 ± 0.63 30.91 ± 0.62 < 0.001
Milk 56.06 ± 1.79 62.40 ± 1.86 56.36 ± 1.61 59.32 ± 1.49 0.860
Fish
Mackerel 5.65 ± 0.29 5.82 ± 0.35 3.75 ± 0.22 3.72 ± 0.22 < 0.001
Saury 1.59 ± 0.14 1.72 ± 0.14 1.19 ± 0.12 0.96 ± 0.12 < 0.001
Anchovies 7.92 ± 0.22 6.75 ± 0.18 1.92 ± 0.05 3.05 ± 0.11 < 0.001
Eel 1.06 ± 0.14 1.51 ± 0.22 1.96 ± 0.29 1.92 ± 0.26 0.023
Beans & their products
Tofu 25.06 ± 0.70 22.91 ± 0.67 22.21 ± 0.72 20.47 ± 0.57 < 0.001
Soybean 5.25 ± 0.17 4.15 ± 0.15 3.99 ± 0.17 2.72 ± 0.11 < 0.001
Soybean paste 7.11 ± 0.18 6.67 ± 0.17 5.35 ± 0.14 4.20 ± 0.11 < 0.001
Seeds & Nuts
Sesame seeds 0.73 ± 0.03 0.75 ± 0.02 0.70 ± 0.02 0.24 ± 0.02 < 0.001
Perilla seeds 0.27 ± 0.02 0.30 ± 0.02 0.37 ± 0.03 0.37 ± 0.02 0.019
Walnuts 0.20 ± 0.05 0.25 ± 0.03 0.30 ± 0.02 0.35 ± 0.02 0.014
Oils & their products
Soybean oil 3.93 ± 0.08 4.28 ± 0.10 4.53 ± 0.10 3.80 ± 0.08 0.146
Sesame oil 1.77 ± 0.04 1.78 ± 0.05 1.82 ± 0.04 1.60 ± 0.03 < 0.001
Perilla oil 0.15 ± 0.01 0.21 ± 0.02 0.27 ± 0.02 0.31 ± 0.02 < 0.001
Canola oil 0.30 ± 0.04 0.40 ± 0.03 0.52 ± 0.04 0.59 ± 0.03 < 0.001
Mayonnaise 1.63 ± 0.10 2.21 ± 0.10 3.00 ± 0.12 2.98 ± 0.12 < 0.001
Coffee (with or without sugar and cream) 9.44 ± 0.20 11.27 ± 0.20 11.61 ± 0.23 10.70 ± 0.30 0.022
Coffee creamer 2.04 ± 0.06 2.16 ± 0.08 1.92 ± 0.07 0.92 ± 0.05 < 0.001
Grains & their products
White rice 187.2 ± 1.46 177.6 ± 1.51 154.0 ± 1.48 142.4 ± 1.38 < 0.001
Ramyeon 14.07 ± 0.50 14.92 ± 0.54 15.24 ± 0.52 14.53 ± 0.47 0.141
Bread 11.45 ± 0.49 16.85 ± 0.64 19.60 ± 0.73 20.99 ± 0.68 < 0.001
Cake 1.56 ± 0.16 1.91 ± 0.23 4.05 ± 0.39 3.66 ± 0.32 < 0.001
Snacks, biscuits, and cookies 2.11 ± 0.15 2.91 ± 0.17 3.04 ± 0.18 5.51 ± 0.23 < 0.001
Data are shown as mean ± SE.
All analyses accounted for the multi-stage complex sampling design effect and used appropriate sampling weights using the SURVEY procedures in the SAS software.
KNHANES, Korea National Health and Nutrition Examination Surveys.
1)Linear trends in the intake of food sources across the survey periods were compared using the multiple linear regression model after adjusting for gender, age, living area, household income, and total energy intake.

Differences in food consumption changes contributing to dietary fatty acid intake by gender

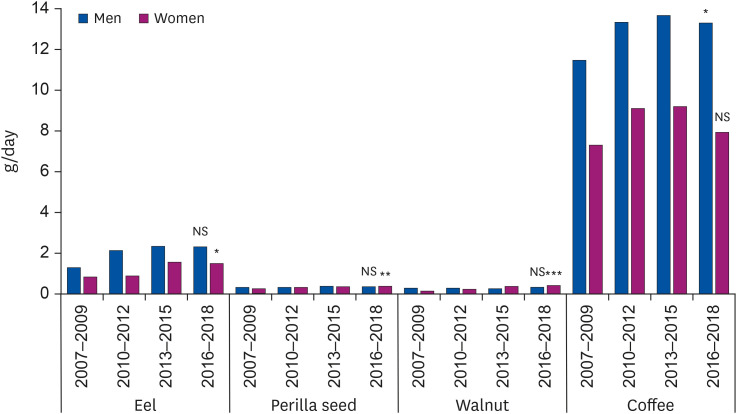
Fig. 1 shows trends in the consumption of foods showing differences in their significance for changes of daily consumption over 2007–2018 between men and women. Men and women showed similar consumption trends in most food sources (data not shown). However, 4 food sources, including eel, perilla seeds, walnuts, and coffee showed differences in the significance of daily consumption changes by gender. The consumption of eel, perilla seeds, and walnuts significantly increased between 2007–2018 in women but was not significantly changed in men. Men showed a significant increasing trend in coffee consumption over 12 yrs, whereas women did not.
Fig. 1

Trends in the consumption of foods showing differences in their significance for changes of daily consumption over 2007–2018 between men and women. All analyses accounted for the multi-stage complex sampling design effect and used appropriate sampling weights using the SURVEY procedures in the SAS software.

Linear trends in the intake of food sources across the survey periods were compared using the multiple linear regression model after adjusting for age, living area, household income, and total energy intake (*P < 0.05, **P < 0.01, ***P < 0.001; NS, not significant).
nrp-16-405-g001

DISCUSSION

In the current study, we examined changes in the food sources of fatty acids and their consumption levels since 2007 in a Korean adult population whose dietary fat intake has been significantly increasing. We found that the major fat sources in this population were pork, soybean oil, beef, eggs, and mayonnaise. From 2007 through 2018, the contribution of animal sources to all types of fatty acids increased as did the consumption of animal foods. In contrast, the intake of beans and their products, as well as fish between 2007 and 2018, showed downward trends, and thus, their contribution to n-3 FA intake decreased over time. Eggs, mayonnaise, bread, and snacks became the major food sources of dietary fats with higher contributions across the survey periods.
Korean adults showed increasing trends in dietary fat intake, particularly in SFA and MUFA, from 2007 to 2018. Currently, the main contributors to SFA and MUFA included animal food sources, such as pork, beef, chicken, and eggs, which together contributed up to 35.4% of the SFA intake and 41.6% of the MUFA intake in this population. As the consumption level of these animal sources increased in this population, their contribution to fat intake also increased. For example, beef became the second main food source for SFA and MUFA, increasing by 6% and 6%, respectively, over 12 yrs. A study of Chinese adults reported that the intake of dietary fats, including SFA, MUFA, and PUFA significantly increased from 1997 to 2011 in absolute amounts as well as the proportion of energy [9]. In terms of food sources, however, meat and animal oils contributed less to fatty acid intake but vegetable oils contributed more over time [9]. Different from Asian countries, the intake of total fat and SFA decreased or did not change over time in Irish [16] and UK adults [17], and were mainly obtained from meat and dairy products in Western countries [31016]. The increasing trend in the consumption of animal foods, as well as SFA intake by Korean adults, should be continually monitored and modified to reduce the risk of chronic diseases.
Of note, the major food sources of fatty acids in Korean adults, mayonnaise, bread, and snacks/biscuits/cookies, provided higher fat intake of all types of fatty acids and showed increasing trends in consumption. For SFA and MUFA, snacks/biscuits/cookies were newly included on the top 10 food source list based on the 2016–2018 KNHANES data. For PUFA, mayonnaise became the second major food source by increasing about 5% of its contribution between the 4th and 7th KNHANES data. This phenomenon might be explained by the increasing availability of processed foods and the adaption of Westernized dietary patterns by Koreans after rapid economic development and food environment changes [18]. However, obtaining SFA from processed foods, especially low nutritive foods, including pastries, cookies, donuts, cakes, and fried foods, was associated with low dietary quality evaluated by the Healthy Eating Index in Canadian adults [4] and an increased risk for CVD among Spanish adults [19]. Since these processed foods are characterized by high SFA and trans fats, as well as high sodium and sugar but low vitamins, minerals, and dietary fiber, healthy food choices for fat sources should be emphasized in Korean adults by suggesting food-based dietary guidelines for fat intake.
In the PUFA sources, plant oils and beans and their products showed lower contributions over time in Korean adults. Instead, mayonnaise and eggs had higher contributions to PUFA intake, ranking second and fifth on the list of major food sources of PUFA, respectively, in the 2016–2018 KNHANES data. Particularly, n-3 FA intake showed considerable changes in terms of its main food sources. The n-3 FA was provided much less from fish, such as mackerel, anchovies, and saury in the 7th survey data compared to the 4th survey data, with only mackerel remaining on the top 10 food list sources for n-3 FA in the 7th survey data. Similar to our findings, Chinese adults showed a decreasing trend in the intake of fish and shellfish over 1997–2011, and thus, they had very low consumption levels of eicosapentaenoic acid and docosahexaenoic acid [9]. Fish and legumes are essential components of healthy dietary patterns (e.g., the Mediterranean diet, DASH diet, and prudent dietary patterns) as these foods contain high amounts of long-chain n-3 FA, vegetable protein, dietary fiber, and antioxidants [202122]. Previous epidemiologic studies consistently reported benefits from the consumption of fish and legumes on health outcomes, such as metabolic syndrome and CVD [232425]. Accordingly, the international dietary recommendations for CVD have emphasized including fish and legumes in a diet for improving overall healthy dietary patterns and cardiovascular risk factors [2627282930].
We also identified differences in the major food sources of dietary fatty acids between Korean men and women. The food sources that showed differences of more than one rank between men and women were found in this study. Among these food items, regardless of the type of fatty acid, the food sources showing higher ranks and contribution in men were mainly animal sources (e.g., chicken and pork), instant noodles (ramyeon), and coffee, whereas women showed higher contribution and ranks from plant sources (e.g., soybean, vegetable oils, and walnuts), milk, bread, and cake. These differences by gender can be explained by the different dietary patterns and food preferences between men and women and thus, need to be considered in designing of dietary guidelines and nutrition education programs.
Adequate amounts of dietary fatty acids have been emphasized for health. In addition, recent studies have shown that the food sources of dietary fats have important associations with health outcomes. de Oliveira Otto et al. [2] revealed that the association between SFA and CVD risk depended upon the food source: meat SFA was associated with greater CVD risk but dairy SFA was associated with a lower risk of CVD in the Multi-Ethnic Study of Atherosclerosis [2]. Similarly, data from the Malmo Diet and Cancer cohort study showed that among the food sources of fat, a high intake of high-fat dairy products was inversely associated with the risk of type 2 diabetes but meat consumption was positively associated [31]. Therefore, food-based dietary guidelines can be effective in suggesting a balanced fat intake in terms of adequate amounts and healthy food sources for the prevention of chronic diseases.
This study had several limitations. Food sources and their intake amount were assessed based on one-day 24-h recall data. However, population-level estimates drawn from the nationally representative and large samples can help to understand changes in food fat sources over the past decade in Korean adults. In addition, because of the lack of a complete database on trans-fatty acid in Korean common foods, we did not evaluate the intake and food sources of trans-fatty acid, which is also highly associated with health outcomes. Despite these limitations, this study provides information on the trends in food sources of dietary fats in the Korean adult population based on the most recent national data.
In conclusion, changes in the food sources of dietary fat intake along with increases in the consumption of dietary fats were observed in Korean adults. Particularly, increases in the contribution of animal sources to dietary fats might be related to the increased risk for chronic diseases in this population. Fat consumption from fish and bean products which are known as healthy sources of PUFA intake and high-quality diets decreased. Therefore, food-based dietary guidelines for improving the quantity and quality fat intake should be established for Korean adults. Future studies should examine the association of consuming different types of fatty acids with health outcomes, such as chronic diseases. In addition, the association of different food sources of dietary fats with health outcomes needs to be investigated to identify the underlying mechanisms between dietary fatty acid intake and health outcomes.

Notes

Funding: This research was supported by grants from the National Research Foundation of Korea funded by the Korean Government (Ministry of Science and ICT) (J.E.S., funding number: 2016R1D1A1B03931820) (S.S., funding number 2017R1C1B5017637 and 2022R1C1C1002905).

Conflict of Interest: The authors declare no potential conflicts of interests.

Author Contributions:

  • Conceptualization: Shim JE.

  • Formal analysis: Song S, Shim JE.

  • Funding acquisition: Song S, Shim JE.

  • Methodology: Song S, Shim JE.

  • Supervision: Shim JE.

  • Writing - original draft: Song S, Shim JE.

  • Writing - review & editing: Song S, Shim JE.

References

1. Food and Agriculture Organization of the United Nations (FAO). Fats and Fatty Acids in Human Nutrition. Report of an Expert Consultation. Rome: FAO;2010.
2. de Oliveira Otto MC, Mozaffarian D, Kromhout D, Bertoni AG, Sibley CT, Jacobs DR Jr, Nettleton JA. Dietary intake of saturated fat by food source and incident cardiovascular disease: the multi-ethnic study of atherosclerosis. Am J Clin Nutr. 2012; 96:397–404. PMID: 22760560.
3. Eilander A, Harika RK, Zock PL. Intake and sources of dietary fatty acids in Europe: are current population intakes of fats aligned with dietary recommendations? Eur J Lipid Sci Technol. 2015; 117:1370–1377. PMID: 26877707.
4. Harrison S, Brassard D, Lemieux S, Lamarche B. Dietary saturated fats from different food sources show variable associations with the 2015 Healthy Eating Index in the Canadian population. J Nutr. 2020; 150:3288–3295. PMID: 33188403.
5. Huth PJ, Fulgoni VL 3rd, Keast DR, Park K, Auestad N. Major food sources of calories, added sugars, and saturated fat and their contribution to essential nutrient intakes in the U.S. diet: data from the National Health and Nutrition Examination Survey (2003–2006). Nutr J. 2013; 12:116. PMID: 23927718.
6. Kirkpatrick SI, Raffoul A, Lee KM, Jones AC. Top dietary sources of energy, sodium, sugars, and saturated fats among Canadians: insights from the 2015 Canadian Community Health Survey. Appl Physiol Nutr Metab. 2019; 44:650–658. PMID: 30951373.
7. Joyce T, Wallace AJ, McCarthy SN, Gibney MJ. Intakes of total fat, saturated, monounsaturated and polyunsaturated fatty acids in Irish children, teenagers and adults. Public Health Nutr. 2009; 12:156–165. PMID: 19026091.
8. Sioen I, Vyncke K, De Maeyer M, Gerichhausen M, De Henauw S. Dietary intake and food sources of total and individual polyunsaturated fatty acids in the Belgian population over 15 years old. Lipids. 2013; 48:729–738. PMID: 23588778.
9. Shen X, Fang A, He J, Liu Z, Guo M, Gao R, Li K. Trends in dietary fat and fatty acid intakes and related food sources among Chinese adults: a longitudinal study from the China Health and Nutrition Survey (1997–2011). Public Health Nutr. 2017; 20:2927–2936. PMID: 28789722.
10. Vadiveloo M, Scott M, Quatromoni P, Jacques P, Parekh N. Trends in dietary fat and high-fat food intakes from 1991 to 2008 in the Framingham Heart Study participants. Br J Nutr. 2014; 111:724–734. PMID: 24047827.
11. Song S, Shim JE, Song WO. Trends in total fat and fatty acid intakes and chronic health conditions in Korean adults over 2007–2015. Public Health Nutr. 2019; 22:1341–1350. PMID: 30767815.
12. Song S, Shim JE. Evaluation of total fat and fatty acids intakes in the Korean adult population using data from the 2016–2017 Korea National Health and Nutrition Examination Surveys. Korean J Community Nutr. 2019; 24:223–231.
13. Song S, Shim JE. Trends in dietary intake of total fat and fatty acids among Korean adolescents from 2007 to 2017. Nutrients. 2019; 11:3073.
14. Kweon S, Kim Y, Jang MJ, Kim Y, Kim K, Choi S, Chun C, Khang YH, Oh K. Data resource profile: the Korea National Health and Nutrition Examination Survey (KNHANES). Int J Epidemiol. 2014; 43:69–77. PMID: 24585853.
15. Yoon MO, Kim K, Hwang JY, Lee HS, Son TY, Moon HK, Shim JE. Development of a fatty acids database using the Korea National Health and Nutrition Examination Survey data. J Nutr Health. 2014; 47:435–442.
16. Li K, McNulty BA, Tiernery AM, Devlin NF, Joyce T, Leite JC, Flynn A, Walton J, Brennan L, Gibney MJ, et al. Dietary fat intakes in Irish adults in 2011: how much has changed in 10 years? Br J Nutr. 2016; 115:1798–1809. PMID: 26996058.
17. Pot GK, Prynne CJ, Roberts C, Olson A, Nicholson SK, Whitton C, Teucher B, Bates B, Henderson H, Pigott S, et al. National Diet and Nutrition Survey: fat and fatty acid intake from the first year of the rolling programme and comparison with previous surveys. Br J Nutr. 2012; 107:405–415. PMID: 21767448.
18. Lee HS, Duffey KJ, Popkin BM. South Korea's entry to the global food economy: shifts in consumption of food between 1998 and 2009. Asia Pac J Clin Nutr. 2012; 21:618–629. PMID: 23017321.
19. Guasch-Ferré M, Babio N, Martínez-González MA, Corella D, Ros E, Martín-Peláez S, Estruch R, Arós F, Gómez-Gracia E, Fiol M, et al. Dietary fat intake and risk of cardiovascular disease and all-cause mortality in a population at high risk of cardiovascular disease. Am J Clin Nutr. 2015; 102:1563–1573. PMID: 26561617.
20. Widmer RJ, Flammer AJ, Lerman LO, Lerman A. The Mediterranean diet, its components, and cardiovascular disease. Am J Med. 2015; 128:229–238. PMID: 25447615.
21. Fung TT, Willett WC, Stampfer MJ, Manson JE, Hu FB. Dietary patterns and the risk of coronary heart disease in women. Arch Intern Med. 2001; 161:1857–1862. PMID: 11493127.
22. Fung TT, Chiuve SE, McCullough ML, Rexrode KM, Logroscino G, Hu FB. Adherence to a DASH-style diet and risk of coronary heart disease and stroke in women. Arch Intern Med. 2008; 168:713–720. PMID: 18413553.
23. Jayedi A, Shab-Bidar S, Eimeri S, Djafarian K. Fish consumption and risk of all-cause and cardiovascular mortality: a dose-response meta-analysis of prospective observational studies. Public Health Nutr. 2018; 21:1297–1306. PMID: 29317009.
24. Kim YS, Xun P, He K. Fish consumption, long-chain omega-3 polyunsaturated fatty acid intake and risk of metabolic syndrome: a meta-analysis. Nutrients. 2015; 7:2085–2100. PMID: 25811108.
25. Marventano S, Izquierdo Pulido M, Sánchez-González C, Godos J, Speciani A, Galvano F, Grosso G. Legume consumption and CVD risk: a systematic review and meta-analysis. Public Health Nutr. 2017; 20:245–254. PMID: 28077199.
26. Anderson TJ, Grégoire J, Pearson GJ, Barry AR, Couture P, Dawes M, Francis GA, Genest J Jr, Grover S, Gupta M, et al. 2016 Canadian Cardiovascular Society guidelines for the management of dyslipidemia for the prevention of cardiovascular disease in the adult. Can J Cardiol. 2016; 32:1263–1282. PMID: 27712954.
27. Rhee EJ, Kim HC, Kim JH, Lee EY, Kim BJ, Kim EM, Song Y, Lim JH, Kim HJ, Choi S, et al. 2018 Guidelines for the management of dyslipidemia. Korean J Intern Med. 2019; 34:723–771. PMID: 31272142.
28. Arnett DK, Blumenthal RS, Albert MA, Buroker AB, Goldberger ZD, Hahn EJ, Himmelfarb CD, Khera A, Lloyd-Jones D, McEvoy JW, et al. 2019 ACC/AHA guideline on the primary prevention of cardiovascular disease: a report of the American College of Cardiology/American Heart Association task force on clinical practice guidelines. Circulation. 2019; 140:e596–e646. PMID: 30879355.
29. Kinoshita M, Yokote K, Arai H, Iida M, Ishigaki Y, Ishibashi S, Umemoto S, Egusa G, Ohmura H, Okamura T, et al. Japan Atherosclerosis Society (JAS) guidelines for prevention of atherosclerotic cardiovascular diseases 2017. J Atheroscler Thromb. 2018; 25:846–984. PMID: 30135334.
30. Mach F, Baigent C, Catapano AL, Koskinas KC, Casula M, Badimon L, Chapman MJ, De Backer GG, Delgado V, Ference BA, et al. 2019 ESC/EAS guidelines for the management of dyslipidaemias: lipid modification to reduce cardiovascular risk. Eur Heart J. 2020; 41:111–188. PMID: 31504418.
31. Ericson U, Hellstrand S, Brunkwall L, Schulz CA, Sonestedt E, Wallström P, Gullberg B, Wirfält E, Orho-Melander M. Food sources of fat may clarify the inconsistent role of dietary fat intake for incidence of type 2 diabetes. Am J Clin Nutr. 2015; 101:1065–1080. PMID: 25832335.
TOOLS
Similar articles