

 PDF
PDF Citation
 Print
Print


INTRODUCTION
Drinking is a leading factor in the global burden of ailments, causing more than 200 diseases and damage [1]. As of 2018, it has been reported that 5.3% of the global mortalities are connected to drinking [2]. Drinking is one of the health-impacting behaviors, affecting various factors such as smoking, physical activity and diet. Despite the widespread perception to avoid excessive drinking, this vice has seen a steady rise in Korea [3]. The Korea National Health and Nutrition Examination Survey (KNHANES) defines binge drinking as the consumption of more than 7 cups alcohol for men and 5 cups alcohol for women [4]. Such drinking at a level that is harmful to health, such as heavy drinking or binge drinking, is called high-risk drinking, especially when binge drinking is more than twice a week [1].
Compared to 2018, the 2019 National Health Statistics declared that the monthly drinking rate for men was 73.4% and the monthly binge drinking rate was 52.6% (up by 1.8%) [45]. Recent reports also indicate increased drinking rates among women. From 2008 to 2017, the monthly drinking rate of men and women decreased by 5.7%, while the monthly drinking rate of women increased by 4.5% [6]. According to a survey conducted by the Ministry of Food and Drug Safety in 2020, 66.9% individuals in their 20s and 70.0% in their 30s have experienced high risk drinking. It further reported that 49.0–50.9% in the 20–30 years age group have experienced bomb shots [7].
Metabolic syndrome (MetS) is a condition in which high blood pressure (BP), high blood glucose, dyslipidemia, and abdominal circumference excesses exist simultaneously in one person [8]. According to a study analyzing the prevalence and changes in MetS in Korean adults, MetS in men was observed to have increased from 24.5% in 2008 to 28.1% in 2017 [9], with increased levels of waist circumference (WC) and fasting blood glucose (FBG) and decreased high density lipoprotein cholesterol (HDL-C). However, although MetS was determined to be stable in women, at 18.7% in 2017, the FBG was determined to have increased from 22.2% in 2008 to 26.7% in 2017 [9]. In terms of age-related MetS prevalence, individuals in their 20s and 30s showed an average 5.7% and 14.7%, respectively, with a sharp increase determined in the 40s [10]. Social beginners have high job stress and innumerable worries about employment and housing shortages. The generation with high job stress were afflicted with abdominal obesity, low-HDL cholesterol, high triglyceride (TG), and MetS [10]. Therefore, people in their 20s and 30s may be vulnerable to MetS [11]. Particularly, previous studies had revealed the relation between drinking and MetS, and established that excessive drinking habits result in increased abdominal obesity and high BP, dyslipidemia and diabetes [1213141516]. The prevalence of MetS among young people is on the rise, reaching up to 25.2% in the 20–30s age group [17]. Thus, preventive efforts related to drinking are required to control MetS in the 20–30-year adults.
Numerous studies have reported the relationship between drinking behaviors and MetS for adults, but very few studies have covered the 20–30 age group. Since adults between 20–30 have a longer life, it is important to strategize healthy living habits, which requires the management of risk factors associated with MetS. The present study was therefore conducted to analyze the association between drinking behavior and components of MetS among drinking adults in their 20s and 30s.
SUBJECTS AND METHODS
Study design and subjects
The KNHANES is a national program designed to assess the health and nutritional status of adults and children in Korea. Since 1998, the KNHANES has collected data obtained by direct physical examination, clinical and laboratory tests, personal interviews, and related measurement procedures. These data are used to estimate the prevalence of chronic disease in the total population, or monitor trends in the prevalence and risk behaviors [18]. Methods employed for examination are dependent on the age of the participants. Personal interviews of an individual's lifestyle are collected, such as smoking habits, alcohol consumption, degree of physical activity, and dietary intakes. Data of approximately 10,000 individuals are collected every year [18].
The current cross-sectional secondary analysis was conducted using data procured from KNHANES, by downloading raw data from the Korea Disease Control and Prevention Agency homepage [19]. Data was analyzed after receiving permission of authorization for exemption from approval by the Pusan National University Institutional Review Board (PNU IRB/2020_70_HR).
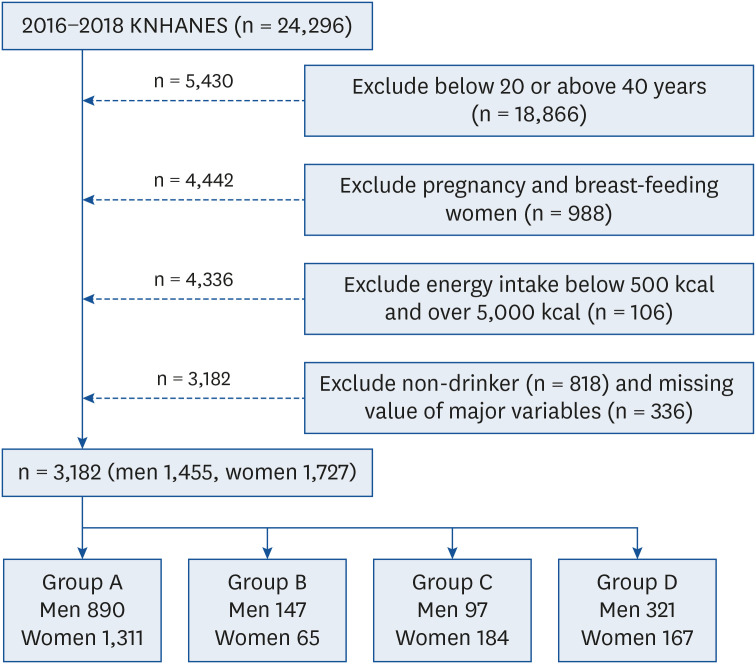
To investigate the association between components of MetS and drinking behaviors in the 20–30 years age group of South Koreans, we analyzed the KNHANES data obtained during a 3 yr period (2016 to 2018), which included 24,296 subjects. Of these, the following 21,114 individuals were excluded from the analysis: 1) non-20–30s people (n = 18,866), 2) pregnant/breast-feeding women (n = 988), 3) extreme nutrient intakes (below 500 kcal and over 5,000 kcal) (n = 106) [20], and 4) non-drinkers for the past year and with missing values in the main variables (n = 1,154). Non-drinkers were excluded from the analysis since the study was targeted to compare the association of MetS due to various drinking behaviors. Thus, a final total of 3,182 subjects were included in this study (1,455 men, 1,727 women) (Fig. 1).
General characteristics
General characteristics include demographic factors such as gender, age, marital status, education level, income level, and type of occupation. Age was presented as the average age, and income levels were divided into lower, lower middle, upper middle, and high levels. The levels of education were classified as middle school, high school and college graduation, and the types of occupations were based on the contents of the survey items (i.e., administrations, office job, sales/service, farmer/fisher/labor, technician, no job). No job included housewives and students.
Health related status and macronutrients intakes status
Health related status included body mass index (BMI), obesity status using BMI, smoking status, and walking hours per week, which are identified as factors related to MetS in previous studies [1121]. Smoking status included smoking experience and the average daily smoking volume in current smokers. Walking hours per week were calculated by converting the walking hours and minutes determined at KNHANES into hours.
This study used the single 24-h recall data from the KNHANES. The intake of carbohydrates, proteins and fats known to be related with MetS was calculated. The amounts of nutrient intakes for carbohydrate (g), protein (g), and fat (g) were analyzed by gender. In addition, the distribution ratio for energy was also calculated. Formulas of carbohydrate, protein, and fat distribution ratio for energy are as follows:
Carbohydrate distribution ratio for energy = (amount of carbohydrate intake (g) × 4)/total intake calories (kcal) × 100
Types of drinking behaviors
Using the KNHANES data, this study analyzed the drinking behaviors during the past year, including frequency of drinking and frequency of binge drinking. The criteria for binge drinking were classified as at least 7 cups (or 5 cans) of beer for men, and 5 cups (or 3 cans) of beer for women [22]. Drinking behaviors in the 20–30s age group were divided into 4 groups: group A, does not frequently drink alcohol (< twice/week) and does not frequently binge drinking (< once/week); group B, does not frequently drink alcohol (< twice/week), has frequent binge drinking (≥ once/week); group C, frequently drinks alcohol (≥ twice/week), does not frequently binge drinking (< once/week); group D, frequently drinks alcohol (≥ twice/week) and has frequent binge drinking (≥ once/week). Subjects were subsequently classified into 4 types, based on their drinking behaviors: 1) group A, good drinking habits, 890 men and 1,311 women; 2) group B, frequent binge drinking but not frequent drinking, 147 men and 65 women; 3) group C, frequent drinking but not frequent binge drinking, 97 men and 184 women; 4) group D, frequent drinking and binge drinking, 321 men and 167 women.
Components of MetS
The following anthropometric and biochemical measurements were assessed from the KNHANES data: WC, blood TG, HDL-C, systolic BP (SBP)/diastolic BP (DBP), and FBG. According to the criteria set by the adult treatment program III of the National Cholesterol Education Program (NCEP ATP III, 2005), abdominal obesity is defined and used by the Korean Society for The Study of Obesity as the standard for WC [23]. MetS risk factors are determined by the above selected 5 components, and are defined as the presence of 3 or more of the following components [24]: WC determines ‘Abdominal obesity’ (over 90 cm for men and 85 cm for women) [23]; TG levels are associated with ‘High TG’ (over 150 mg/dL), and HDL-C is classified as ‘Low HDL-C’ (less than 40 mg/dL for men and 50 mg/dL for women); ‘High BP’ is defined as SBP/DBP greater than 130/85 mmHg; FBG is classified as ‘High FBG’ at values over 100 mg/dL.
Statistical analysis
All data in this study were analyzed using the IBM SPSS Statistics 25.0 program (SPSS Inc., Chicago, IL, USA). The KNHANES data were extracted by the stratification multiple sampling, involving weightings, stratification (KSTRATA), and clusters (PSU). The chi-square test (categorical variables) and general linear model (continuous variables) were used to analyze the general characteristics, health related status, macronutrients intakes status, distribution ratio for energy, and components of MetS. The association between components of MetS and drinking behaviors were performed by applying multiple logistic regression analysis to estimate the odds ratios (ORs) with 95% confidence intervals (CIs). Model 1 is unadjusted; model 2 is adjusted for variables that include general characteristics, health related status, macronutrients intakes status, and distribution ratio for energy. To determine the independence of the association between drinking behaviors and components of MetS, related variables identified as risk factors of MetS were included in the analysis. Variables of general characteristics (gender, age, marital status, income level, education), health related status (BMI, obesity status, smoking status, walking hours), and macronutrients intakes status have previously been identified as risk factors for MetS, and were included in the analysis [24]. These variables were analyzed as covariates in model 2, using variables with proven significance for each drinking behavior (Tables 1, 2, 3). Categorical variables are presented as n (weighted percentages), and continuous variables are expressed as mean ± standard error. Differences are considered statistically significant at P < 0.05.
Table 1
General characteristics by drinking behaviors
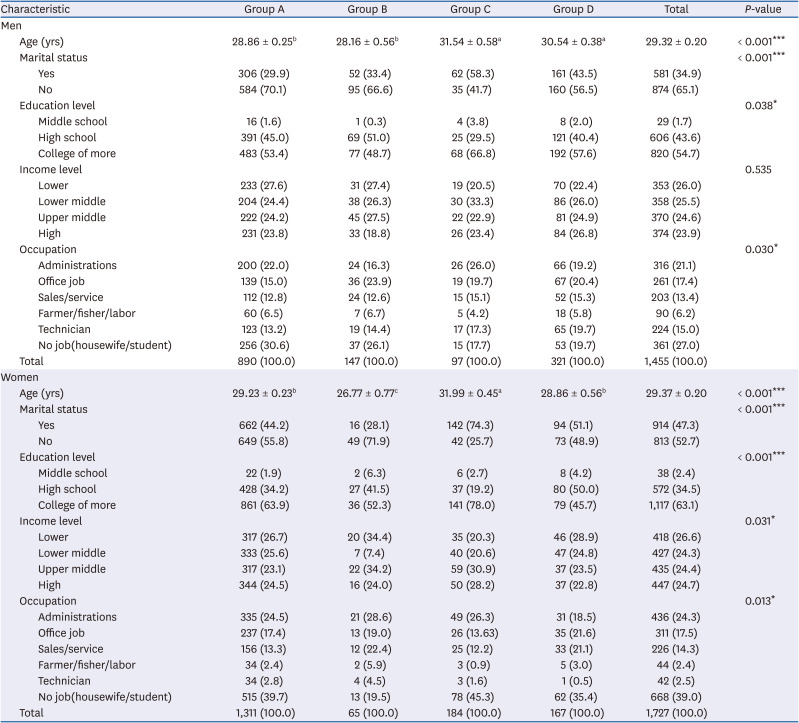
Values are presented as mean ± SE or number (weighted %).
P-value was obtained from the complex samples for general linear model for continuous variables (Bonferroni's post hoc test, a > b) and χ2 test for categorical variables.
Group A: does not drink alcohol frequently (< 2 times/week) and has a low frequency of binge drinking (< 1 time/week); group B: does not drink alcohol frequently (< 2 times/week), but has frequent at binge drinking (≥ 1 time/week); group C: frequently drinks (≥ 2 times/week), but has a low frequency of binge drinking (< 1 time/week); group D: frequently drinks (≥ 2 times/week) and has frequent at binge drinking (≥ 1 time/week).
*P < 0.05, ***P < 0.001.
Table 2
Health related status by drinking behaviors
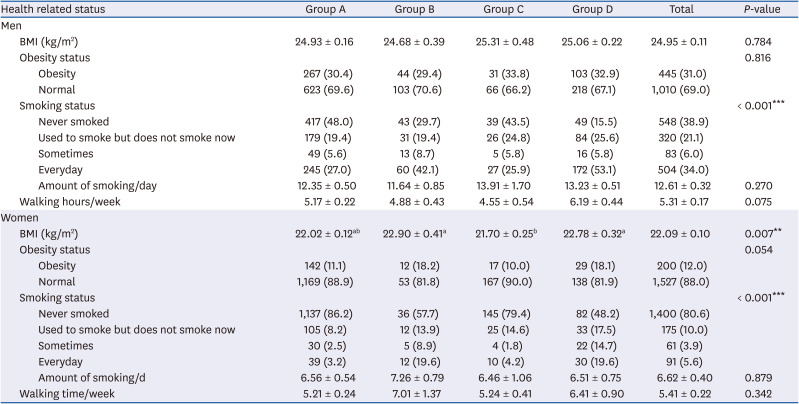
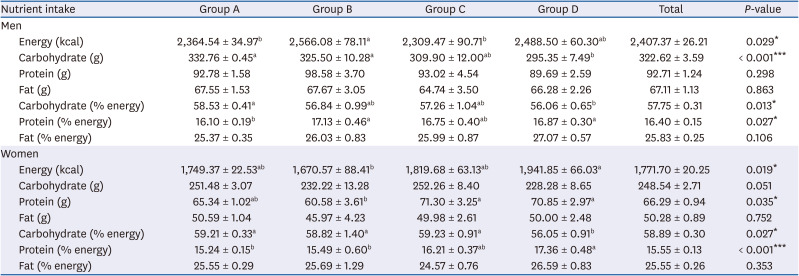
Table 3
Macronutrient intake status and distribution ratio for energy
RESULTS
General characteristics by drinking behaviors
Socio-demographics of the subjects by drinking behaviors are presented in Table 1. The total of 3,182 subjects included 1,455 men and 1,727 women. The age (P < 0.001), marital status (P < 0.001), education level (P < 0.05), and occupation (P < 0.05) differed significantly according to drinking behaviors of men. For women, age (P < 0.001), marital status (P < 0.001), education level (P < 0.001), income level (P < 0.05), and occupation (P < 0.05) differed significantly by drinking behaviors.
Health related status by drinking behaviors
Table 2 shows the BMI, obesity status, smoking status, and walking hours of the subjects. In case of men, the smoking behavior differed significantly depending on drinking behaviors, with 42.1% and 53.1% of groups B and D smoking daily, respectively. Group A (48.0%) were non-smokers, as compared to other groups (P < 0.001). Compared to other groups, groups B and D among women showed significant differences in the BMI and smoking status. On an average, BMI was all within normal range depending on drinking behaviors, but was significantly higher in groups B and D (P < 0.01). A significantly higher smoking rate was obtained in groups B and D women than in other groups (P < 0.001).
Macronutrient intakes status and distribution ratio for energy by drinking behaviors
The nutrient intakes status of the subjects by drinking behaviors is presented in Table 3. For men, energy intakes were significantly higher in group B, as compared to groups A and C (P < 0.05). Carbohydrates and carbohydrate (% energy) were higher in group A than in group D, respectively, (P < 0.001, P < 0.05). Protein (% energy) in groups B and D was significantly higher compared to group A (P < 0.05). Amongst women, energy, protein intakes, and protein (% energy) were significantly higher in group D, as compared to group B (P < 0.05, P < 0.001). Carbohydrate (% energy) was significantly lower in group D than in other groups (P < 0.05).
Components of MetS by drinking behaviors
Table 4 shows the components of MetS by drinking behaviors. A higher prevalence of MetS was determined in men (18.5%) than in women (5.6%). Compared to other groups, groups C and D in men showed a significantly higher prevalence of MetS (P < 0.01), with significantly increased levels of TG (P < 0.001), BP (P < 0.001), and FBG (P < 0.05). Depending on the drinking behaviors, low HDL-C (P < 0.01) levels were significantly different amongst women, with highest MetS prevalence (9.1%) obtained in group D. Similar to men, women who indulged in frequent drinking and binge drinking showed a significantly higher prevalence of MetS than other groups.
Table 4
Components of MetS by drinking behaviors
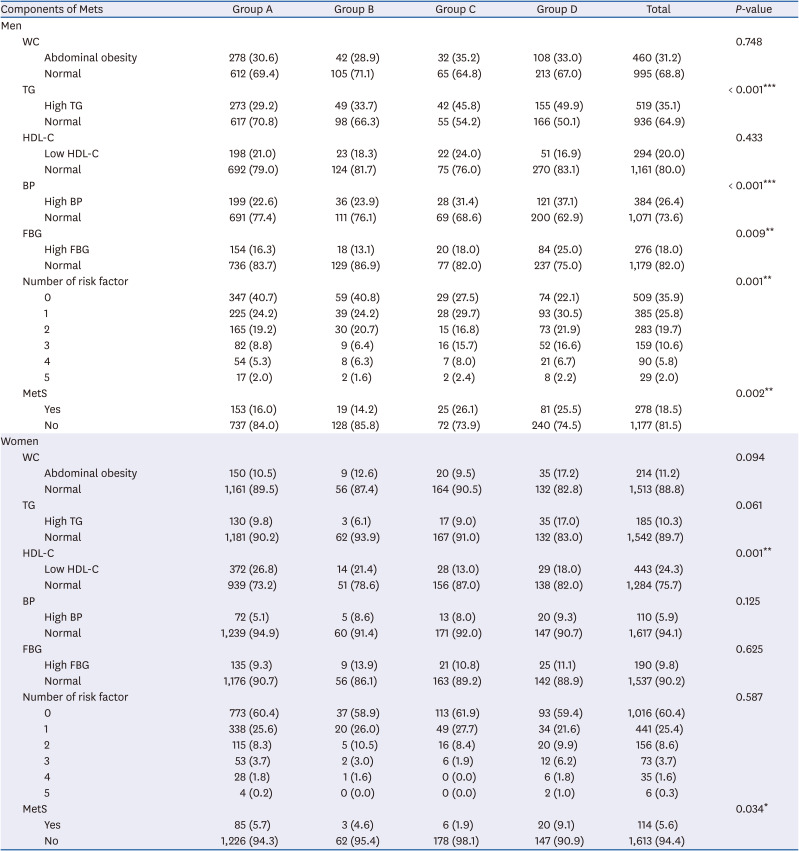
Values are presented in number (weighted %). P-value was obtained from the complex samples for χ2 test for categorical variables.
MetS, metabolic syndrome; WC, waist circumference; TG, triglyceride; HDL-C, high density lipoprotein cholesterol; BP, blood pressure; FBG, fasting blood glucose.
*P < 0.05, **P < 0.01, ***P < 0.001.
Association between components of MetS by drinking behaviors
Table 5 shows the OR and 95% CIs of components of MetS by drinking behaviors. In men, it was adjusted for age, marital status, education level, occupation, smoking status, energy intake, carbohydrate intake, and protein distribution ratio for energy in model 2. The prevalence risk of high TG was increased 2.051-fold (95% CI, 1.211–3.474) in Group C and 1.965-fold (95% CI,1.458–2.647) in Group D, as compared to group A. In group D compared to group A, the increased prevalence risks obtained for various factors were low HDL-C (0.668-fold; 95% CI, 0.447–0.997), high BP (2.147-fold; 95% CI,1.557–2.961), and MetS (1.567-fold; 95% CI,1.087–2.258). In women, it adjusted for age, marital status, education level, income level, occupation, BMI, smoking status, energy intake, carbohydrate distribution ration for energy, and protein distribution ration for energy in model 2. We determined the following fold-increase for prevalence risks in group C, as compared to group A: low HDL-C (0.353-fold; 95% CI, 0.209–0.598) and MetS (3.438-fold; 95% CI, 1.132–10.441). Moreover, the increased prevalence risk of abdominal obesity was 2.959-fold (95% CI,1.344–6.517), high TG 1.824-fold (95% CI,1.091–3.050), and low HDL-C 0.424-fold (95% CI, 0.258–0.696) in group D, as compared to group A.
Table 5
Association between components of MetS and drinking behaviors
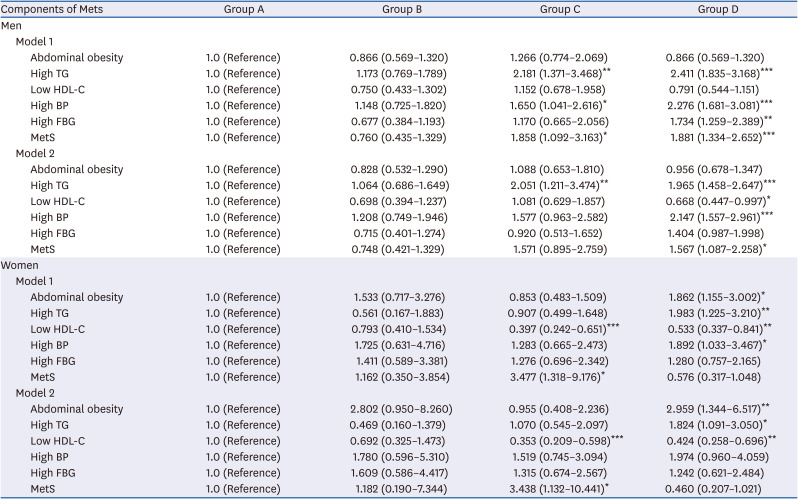
Odds ratios and 95% confidence intervals for components of MetS in drinking behaviors for men.
P-value was obtained from the multiple logistic regression analysis.
Data are presented as below: model 1: unadjusted; model 2: adjusted for model 1 plus age, marital status, education level, occupation, smoking status, energy intake, carbohydrate intake, protein distribution ration for energy (men), adjusted for model 1 plus age, marital status, education level, income level, occupation, body mass index, smoking status, energy intake, carbohydrate distribution ration for energy, protein distribution ration for energy (women); abdominal obesity (90 cm ≤ : men, 85 cm ≤ : women); high TG (150 mg/dL ≤); low HDL-C (≤ 40 mg/dL : men, ≤ 50 mg/dL : women); high BP (130/85 mmHg ≤); high FBG (100 mg/dL ≤).
MetS, metabolic syndrome; TG, triglyceride; HDL-C, high density lipoprotein-cholesterol; BP, blood pressure; FBG, fasting blood glucose.
*P < 0.05, **P < 0.01, ***P < 0.001.
DISCUSSION
Our study was undertaken to determine the association between components of MetS and drinking behaviors in subjects in their 20s and 30s, for preventive management of MetS in Korea. The age-selected group had different gender-specific risk factors for MetS associated with drinking behaviors. In men, frequent drinking resulted in increased risk of high TG, whereas frequent drinking and binge drinking increased the risk of high TG, low HDL-C, high BP, and prevalence of MetS. In women, frequent drinking without binge drinking increased the risk of low HDL-C and MetS, whereas frequent drinking and binge drinking increased the risk of abdominal obesity, high TG, and low HDL-C.
Although the pathological cause of MetS remains unclear, it is known to be associated with the relation between genetic and lifestyle-related environmental risk factors [24]. Previous studies have shown that various socio-demographics, such as gender, age, marital status, education level, income level, and occupation, are related to factors that affect drinking [325]. Traditionally, Korean drinking problems have been limited to adult men. Recently, however, drinking problems among women have intensified due to the increase in socioeconomic activities and factors such as stress relief and human relationships [3]. In this study, married men and women were often reported to drink alcohol, but not indulge in frequent binge drinking. Among the different occupations examined, administrative women did not drink often, but frequently indulged in binge drinking, whereas men drank frequently but not binge drinking. Women who graduated high school disclosed frequent drinking and binge drinking. Considering the income levels, no difference was obtained for men and their drinking behaviors, but women of lower income level often indulged in binge drinking, regardless of the frequency of drinking.
The drinking behavior of men exerted no difference on the BMI or obesity status; conversely, regardless of the frequency of drinking, women who partook frequent binge drinking particularly had a high BMI status. Moreover, the rate of men and women smoking every day was high in groups who often consumed drinks and binge drinking. Considering a previous study which reported that factors affecting MetS in the age group 20-30 years include obesity and smoking [11], frequent binge drinking groups along with high-rate BMI and excessive daily smoking is dangerous. Considering the increased prevalence of MetS with increasing age [11], it is imperative that a negative lifestyle of people in their 20s and 30s needs to be improved.
A previous study reported that increased alcohol intake increases the number of calories, protein, and lipids, which increases the possibility of developing diseases, such as abdominal obesity [26]. It was demonstrated that limited intake of energy and saturated fat induces a positive change in the components of MetS [827]. In this study, we analyzed the rate of energy and macronutrients intake by subjects according to various drinking behaviors. Men who did not drink frequently but frequently indulged in binge drinking had higher intakes of carbohydrate and protein (% energy) than other groups. Men who drank frequently but not frequent binge drinking consumed lower intakes of energy. Men with frequent drinking and binge drinking had lower intakes of carbohydrate and carbohydrate (% energy), and higher intakes of protein (% energy), as compared to other groups. Among women, not drinking frequently but frequently binge drinking had lower intakes of energy, protein, and protein (% energy) than other groups, whereas frequent drinking but not binge drinking had higher intakes of protein and carbohydrate (% energy). Women who frequently indulged in drinking and binge drinking had higher intakes of energy, protein, and protein (% energy), but lower intakes of carbohydrate (% energy), as compared to other groups.
MetS is a cluster of risk factors including cardiovascular disease and diabetes, and is characterized by abdominal obesity, high FBG, high TG, low HDL-C, and high BP [2428]. Each MetS component is a known risk factor for increased blood vessel occlusion, and incidence and mortality due to diabetes, cardiovascular disease, and stroke [28]. Risk factors for MetS are known to contribute to socioeconomic factors, lack of physical activity, and excessive energy intake, alcohol drinking status, etc. Kim and Cho [29] reported that higher the drinking level (AUDIT scores > 20), greater is the WC, indicating abdominal obesity. Generally, alcohol is known that it makes to increase the risk of abdominal obesity [14]. This is because alcohol itself adds to the accumulation of fat in the body in various ways, rather than being converted into fat [14]. A study for adults over the age of 30 compared to this study, it showed that abdominal obesity increased when both men and women have excessive drinking [29]. In this study, women who indulged in frequent drinking and binge drinking had a 2.959-fold higher prevalence risk of abdominal obesity. However, the prevalence risk of abdominal obesity showed no association with the drinking behaviors for men.
In another study, drinkers regardless drink amount was associated with low HDL-C in both men and women [28]. In this study, it showed similar results for HDL-C, when compared to the previous study. And both men and women who drank frequently and indulged in frequent binge drinking had an increased prevalence risk for low HDL-C (0.668- and 0.424-fold, respectively). Amongst women who drank frequently but did not binge drink, the risk prevalence of low HDL-C increased to 0.353-fold. However, the risk prevalence of raised FBG showed no significant association with the prevalence of MetS.
According to the association analysis between the drinking volume of men with TG and BP, the risk prevalence of high TG and BP increased with increasing drinking volume [28]. Contrarily, in the current study, the risk prevalence of high TG increased by 2.051- and 1.965-fold in men who drank frequently but did not binge drinking, and those who indulged in frequent drinking and binge drinking, respectively. The risk prevalence of high BP increased 2.147-fold in men who partook frequent drinking and binge drinking. The risk prevalence of high BP showed no association with the drinking behaviors of women. However, the risk prevalence of high TG increased 1.824-fold in women who were frequent drinkers and did binge drinking.
This study is a secondary analysis study by using the KNHANES data, which includes a large representative sample of the general adults in the age group 20-30 years in Korea. However, this is a cross-sectional study, where the cause and effect could not be identified. This can be a limitation related to the study. Previous studies were focused on the effects of binge drinking or high-risk drinking on MetS [1313], but this study analyzed MetS and the association with various drinking behaviors.
In conclusion, our data indicate that in men, frequent drinking increases the risk of high TG, whereas frequent drinking and binge drinking increase the risk of high TG, low HDL-C, high BP, and the prevalence of MetS. In women, frequent drinking without binge drinking increases the risk of low HDL-C and MetS, whereas frequent drinking and binge drinking also increase the risk of abdominal obesity, high TG, and low HDL-C. Based on the results of this study, it is possible to manage the components of MetS in the 20s and 30s; moreover, this study provides basic data to change drinking behaviors among the young adults. Improvements in drinking behaviors can therefore help reduce the prevalence of MetS. Further studies examining the association between various factors and MetS are required in the future.
 XML Download