

 PDF
PDF Citation
 Print
Print


INTRODUCTION
Uganda is experiencing malnutrition in both the adult and under-five-year old populations. The prevalences of overweight and obesity are also rapidly increasing, with a large sex disparity. According to the 2016 non-communicable disease (NCD) collaboration report, 30.9% of women were overweight and 8.6% were obese, compared with 13.7% and 1.8% of men [1]. There is a strong link between NCDs, and overweight and obesity. Obesity and overweight increase the risk of cardiovascular diseases, type 2 diabetes, kidney disease, certain types of cancer, and musculoskeletal disorders [23].
Dietary intake is an important predictor of high body mass index (BMI). As observed in other East African countries, a shift in dietary patterns from indigenous and traditional dietary habits-termed as the nutrition transition could partly explain the obesity epidemic in Uganda. In 2014, Steyn and colleagues predicted that among other factors, increase in energy, fat, and sugar intake in the next years would strongly be associated with overweight and obesity in Sub-Saharan Africa (SSA) [2]. Furthermore, available evidence suggests that a shift from a traditional diet high in carbohydrates and fiber and low in fat and sugar to a Western diet high in energy, saturated fat, sodium, and sugar; and low in fiber, increases the risk of obesity and other NCDs [4].
Eating away from home (EAFH) is one of the dietary behaviors associated with the consumption of diets high in energy, fat, sugar, and salt; and low in fruits and vegetables. Also, available evidence suggests that EAFH contributes to obesity [5]. EAFH is becoming increasingly popular in Uganda due to changing demographic trends. In particular, the working class now prefer EAFH to eating at home [6]. The prevalence of EAFH has been reported to be 39.2% in Uganda, and reportedly, 69.5% of men and 30.5% of women eat ≥ 3 meals away from home per week [7], which underscores the importance of this eating behavior in Uganda.
EAFH includes all meals (breakfast, lunch, or dinner) that were prepared and eaten outside the consumer’s home. In Uganda, non-home prepared foods include street foods, foods eaten at full-service restaurants, hotels, kiosks, and workplace canteens. In this paper, we examined EAFH regardless of the type of establishment. The contribution of EAFH to dietary intake in Uganda has not been extensively studied, but reports indicate that street foods contribute 49.1% to daily fat intake, 38.4% to daily sodium intake, and little to vitamin A intake in urban areas [8]. These results indicate that street foods comprise excess fat and salt, but little fruits and vegetables, and may predispose individuals to the development of NCDs.
Given the trend towards EAFH and the recognized impact of EAFH on BMI, research on the influence of this dietary behavior on obesity and overweight is warranted. Identifying the influence of EAFH on overweight and obesity would facilitate the development of nutritional and lifestyle interventions targeting obesity prevention. Researchers elsewhere have reported on the associations between EAFH and overweight and obesity. Some reported positive associations [9101112], while others reported no significant associations [13], or positive associations in men, but negative associations in women [9].
Nonetheless, no study has examined the relationships between EAFH and overweight or obesity in Uganda. In this study, we used nationally representative data from the 2014 Uganda NCD risk factor baseline survey to examine the associations between EAFH and overweight and obesity among Ugandan adults, and to determine whether these associations differ by sex and age.
Go to : 
SUBJECTS AND METHODS
Study design and sampling
This cross-sectional study was based on data from the Uganda national NCD risk factor baseline survey conducted between March and July 2014. The detailed study methodology has been published elsewhere [141516] and is briefly described here. The standard World Health Organization (WHO) STEPS tool for NCD risk factor surveillance was used to collect data for this national survey [17]. STEPS involves a sequential process that starts with the gathering of information on key risk factors using a questionnaire (STEP 1), followed by simple physical measurements (STEP 2) and the collection of blood samples for biochemical assessment (STEP 3). A multi-stage sampling design was used to select a nationally representative sample of participants. The first stage involved the selection of a random sample of enumeration areas (EAs) based on the 2014 Uganda bureau of statistics (UBOS) master sampling frame of EAs that were demarcated for the 2014 population and housing census. Each EA included 150–200 households, and 350 of 78,950 EAs were selected using probability proportional to the number of households in the EAs. The EAs were stratified across the four geographical regions of Uganda- namely Central, Eastern, Northern, and Western regions. In the second stage, a random sample of 14 households was selected from each of the 350 EAs. A household was defined as a group of individuals that usually shared meals and had a household head who usually made major decisions for the household. In the final stage, trained research assistants enumerated eligible household members and recorded them using personal digital assistants, which were then used to select a random member of each household aged 18–69 years who had resided in the household for at least six months before the interview. Finally, 4,900 individuals were sampled.
Study participants
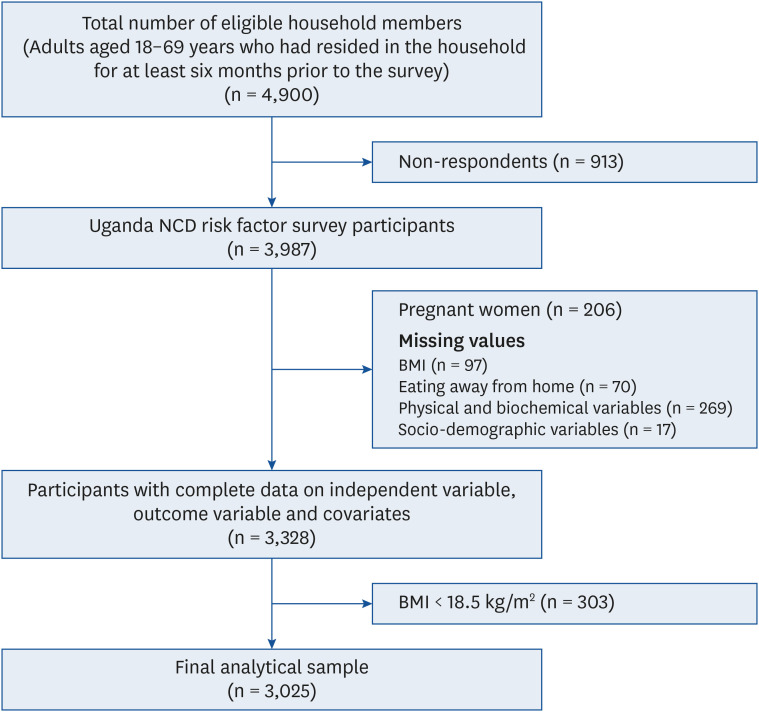
Out of the 4,900 individuals sampled, 3,987 participated in the survey. We excluded pregnant women (n = 206), and those with missing data on BMI (n = 97), frequency of EAFH (n = 70), physical and biochemical variables (n = 269), and sociodemographic and lifestyle characteristics (n = 17). In addition, we excluded underweight individuals (n = 303). Thus, the final sample comprised 3,025 participants, of whom 1,240 were men and 1,785 were women (Fig. 1).
Measurements
BMI
Weight and height were measured in STEP 2 of the survey. Weight was measured using a pre-calibrated, compact, digital weighing scale (SECA 877) with participants in light clothing and without footwear. Standing height was measured using a laser stadiometer incorporated in the SECA 877 scale or manually with a subject barefooted and his/her back and head against a wall. A mark was made on the wall and a tape measure was used to measure height. Height and weight were measured to the nearest 0.1 cm and 0.1 kg, respectively. BMI was calculated by dividing weight (kg) by squared height (m).
Other physical and biochemical measurements
Blood pressure was measured using a battery-powered digital blood pressure machine (Bosch & Sohn Medicus Uno®; BOSCH + SOHN GmbH u. Co. KG, Jungingen, Germany) on the left arm with the participant seated. Three readings were taken 3–5 min apart. The average of the last two readings were used for analysis. Hypertension was defined as an average systolic blood pressure of ≥ 140 mmHg or diastolic blood pressure of ≥ 90 mmHg or being on regular antihypertensive medicine. Finger prick blood samples were collected in the morning after the participant had fasted overnight for 8 hours without exercising or smoking. High-density lipoprotein cholesterol (HDL-c) and fasting plasma glucose were measured using a CardioChek® PA meter.
Dietary behaviors
Frequency of EAFH
Respondents were asked to report the number of meals eaten (breakfast, lunch, and dinner) per week that were not prepared at a home. The frequency of EAFH was evaluated as follows: less than once/week, 1–2 times/week, or ≥ 3 times/week.
Fruit and vegetable consumption
Fruit and vegetable intake were assessed by asking participants the number of days in a typical week when they ate fruits and/or vegetables, and the number of servings of fruit or vegetables eaten on one of those days. Nutrition cards were used to illustrate serving sizes. The reported number of servings for each item were summed together to compute the average fruit and/or vegetable servings per person. Individuals were classified according to whether they consumed ≥ 5 servings of fruits and/or vegetables per week based on WHO recommendations [18].
Socio-demographic and behavioral characteristics
Data regarding the highest educational level attained, marital status, current work status, tobacco use, alcohol use, and physical activity were collected in STEP 1 of the survey. For descriptive purposes, educational level was categorized as no formal education, primary, secondary, or ≥ university. Regarding alcohol use, participants were categorized as current users or past/never users. Current alcohol use was defined as the consumption of any type of alcohol during the 30 days preceding the survey. For tobacco use, participants were categorized as current users or past/never users.
Assessment of physical activity
The short version of the WHO Global Physical Activity Questionnaire (GPAQ) v2.0 was used to assess physical activity [19]. In brief, participants were asked to report the intensity (vigorous, moderate, or walking/cycling); frequency (days/week); and duration (min/day) of physical activity. Three physical activity domains were assessed: physical activity at work, during recreation or leisure time, and walking/cycling to and from work. Based on the protocol described in the GPAQ, physical activity for each domain was calculated by multiplying the frequency, duration and metabolic equivalent of task (MET) values assigned according to activity intensities. The MET values for vigorous, moderate, and walking/cycling are 8.0, 4.0, and 4.0, respectively. Total physical activity (MET-min/week) was expressed as the sum of the physical activities of individual domains. The frequency, duration and MET-min/week were used to categorize participants into low, moderate, and high physical activity groups. High physical activity was defined as vigorous-intensity activity on at least 3 days achieving a minimum total physical activity of at least 1500 MET-min/week or 7 or more days of any combination of walking, moderate-intensity, or vigorous-intensity activities achieving a minimum total physical activity of at least 3000 MET-min/week. Moderate physical activity was defined as 3 or more days of vigorous-intensity activity of at least 20 min per day or 5 or more days of moderate-intensity activity and/or walking of at least 30 min per day or 5 or more days of any combination of walking, moderate-intensity, or vigorous-intensity activities achieving a minimum total physical activity of at least 600 MET-min/week. Low physical activity was defined as not meeting any of the above criteria.
Outcome measures
The health outcome measures were overweight and obesity. Participants were classified according to the WHO classification as follows: BMI ≥ 18.5 to < 25.0 kg/m2 as normal body weight, ≥ 25 to < 30 kg/m2 as overweight, and ≥ 30 kg/m2 as obese [20].
Statistical analysis
Data were analyzed using SAS version 9.4 (SAS Institute, Cary, NC, USA). Frequencies were weighted, and sample design effects were considered in the analyses. Results were summarized as means and SEM for continuous variables, and frequencies and percentages for categorical variables. To examine bivariable associations between participant characteristics and bodyweight categories, and EAFH frequencies, we used general linear models for continuous variables and the χ2 test for categorical variables. Multinomial logistic regression models were used to calculate crude and adjusted odds ratios (ORs) and 95% confidence intervals (CIs) for the associations between EAFH and overweight and obesity. Overweight and obesity categories were compared with the normal body weight category. Initially, we calculated crude estimates (model 1), then adjusted the model for age and sex (model 2), and finally adjusted for educational level, marital status, current work status, tobacco use, alcohol use, physical activity, and fruit and/or vegetable intake (model 3). In addition, we stratified our analyses by sex and age to test whether the associations between EAFH and overweight and obesity were modified by sex or age. Age was categorized as 18–30, 31–50, and 51 years and above according to daily nutritional goals for age-sex groups [21]. Statistical significance was tested using P-values < 0.05.
Ethical considerations
The conduct of the Uganda national NCD survey was approved by the Institutional Review and Ethics Committee of St. Francis Hospital, Nsambya, Kampala, Uganda (approval number: IRC/PRJ/11/13/031).
Go to :
RESULTS
General characteristics of the study participants are presented in Table 1. In total, 3,025 study participants (1,785 women and 1,240 men) with a mean age of 34.1 years and mean BMI of 23.1 kg/m2 were studied. Women accounted for 70.1%, 79.5%, and 46.1% of participants in the overweight, obese, and normal body weight groups respectively (P < 0.001). For participants aged 31–50 years, 35.7% had a normal body weight, and 45.6% and 52.4% were overweight and obese respectively (P < 0.001). The respective percentages of normal, overweight, and obese for each characteristic are as follows: had a university degree and above 7.4%, 12.8%, and 16.4% (P = 0.001), employed 7.1%, 10.5%, and 12.6% (P = 0.003), married or cohabiting 65.6%, 68.4%, and 73.3% (P < 0.001), tobacco past/never users 88.9%, 94.9%, and 96.1% (P < 0.001). The percentages of obese and normal weight participants with low physical activity were 14.9% and 6.4%, respectively (P = 0.008). Among those who always ate processed foods high in salt, 7.1% were overweight and 9.6% were obese compared with 4.3% of those with a normal body weight (P = 0.002). The prevalence of hypertension was 21.9%, 31.8%, and 47.1%, (P < 0.001), and the mean BMI was 21.5 ± 0.04, 27.1 ± 0.07 and 34.8 ± 0.41 kg/m2 in the normal body weight, overweight, and obese groups, respectively. The mean fasting blood sugar was significantly higher in the overweight (4.1 ± 0.06 mmol/L) and obese (4.6 ± 0.2 mmol/L) groups than in the normal body weight group (3.9 ± 0.5 mmol/L) (P < 0.001).
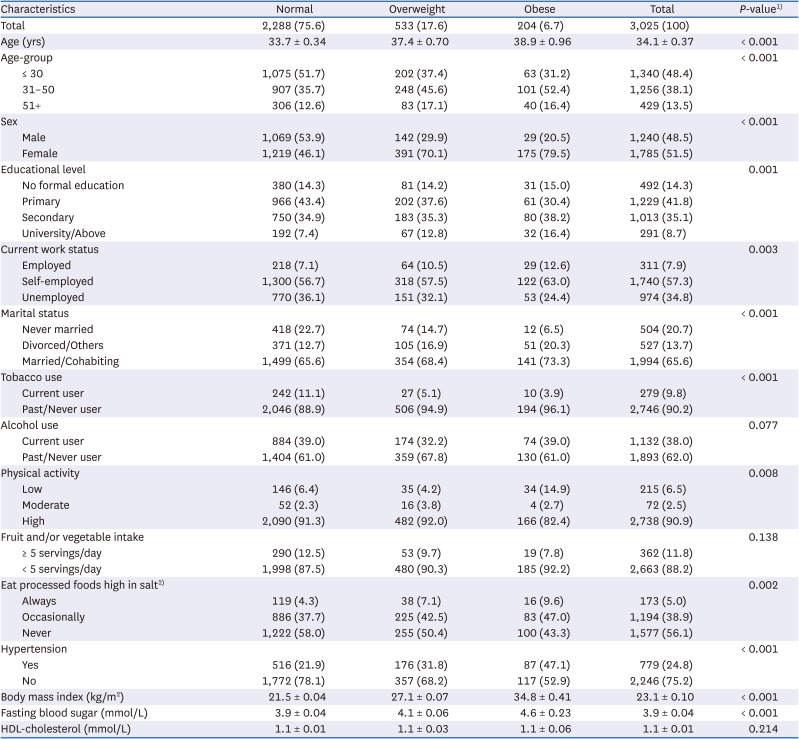
Table 1
Characteristics of study participants according to body weight status
Data are mean (SEM) and frequency (%).
HDL, high-density lipoprotein.
1)χ2 test for categorical variables or GLM for continuous variables; 2)Total = 2,944.
![]()
Table 2 presents the frequencies of EAFH and characteristics of the study participants. Most of the participants that ate away from home ≥ 3 times/week were men (70.1%, P < 0.001). Among those who ate away from home ≥ 3 times/week, 18.5% had at least a university degree compared with 5.6% of those that ate away from home less than once/week (P < 0.001). The respective percentages of participants that ate away from home ≥ 3 times/week and less than once/week were distributed as follows: married 59.3% and 68.6% (P < 0.001); employed 18.5% and 5.1% (P < 0.001); current tobacco users 14.2% and 9.0% (P < 0.05); current alcohol users 48.0% and 34.0% (P < 0.001); and always ate processed foods high in salt 9.8% and 2.7%, respectively (P < 0.001).
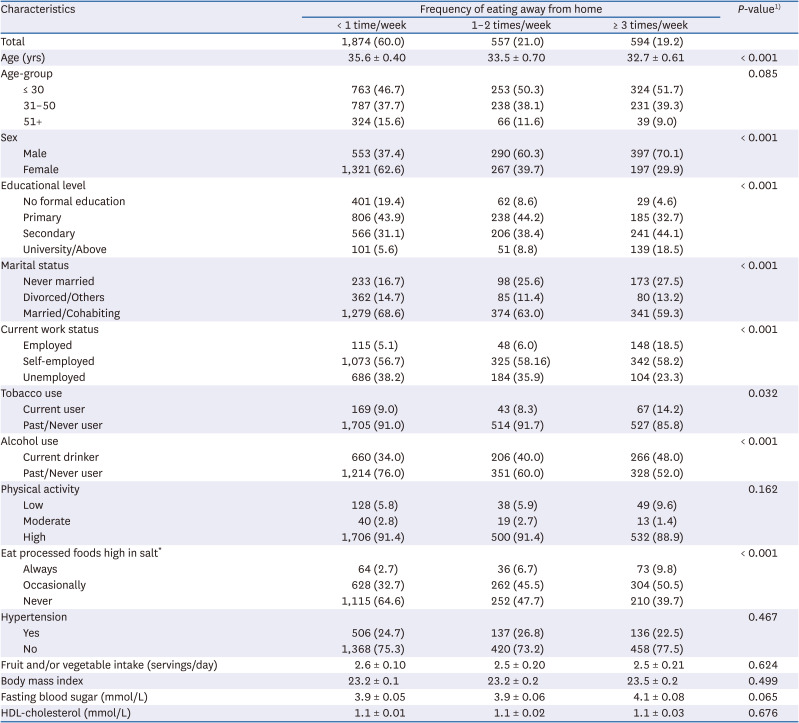
Table 2
Characteristics of study participants according to the frequency of eating away from home
Data are mean (SEM) and frequency (%).
HDL, high density lipoprotein.
1)χ2 test for categorical variables or ANOVA for continuous variables; 2)Total = 2,944.
![]()
The ORs and 95% CIs of the associations between EAFH and obesity and overweight are presented in Table 3. EAFH ≥ 3 times/week was positively associated with obesity but not overweight. In the age and sex-adjusted model (model 2), those who ate away from home ≥ 3 times/week were 2.13 times more likely to be obese (OR, 2.13; 95% CI, 1.28–3.54) than those that ate away from home less than once/week. In the fully adjusted model, the odds of being obese were 2.17 times greater in those who ate away from home ≥ 3 times/week than those that ate away from home less than once/week (OR, 2.17; 95% CI, 1.28–3.65). However, stratified analyses (Table 4) showed that women that ate away from home ≥ 3 times/week were 42% less likely to be overweight than those that ate away from home less than once/week (OR, 0.58; 95% CI, 0.36–0.94). In contrast, EAFH ≥ 3 times/week was positively associated with overweight and obesity in men. Men that ate away from home ≥ 3 times/week were 2.23 and 3.89 times more likely to be overweight and obese, respectively, than those that ate away from home less than once/week (OR, 2.23; 95% CI, 1.42–3.51 and OR, 3.89; 95% CI, 1.50–10.09, respectively) (Table 4). Age-stratified analyses showed that EAFH ≥ 3 times a week was positively associated with obesity among participants aged 31–50 years. Those that ate away from home ≥ 3 times a week were 3.53 times more likely to be obese than those that ate away from home less than once/week (OR, 3.53; 95% CI, 1.69–7.37).
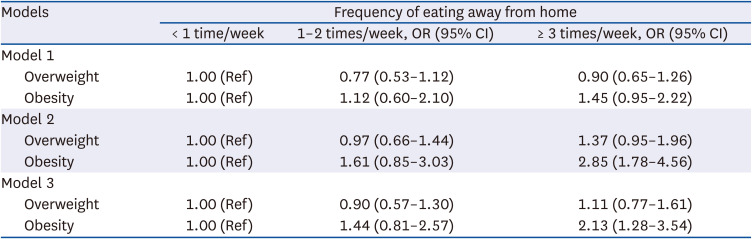
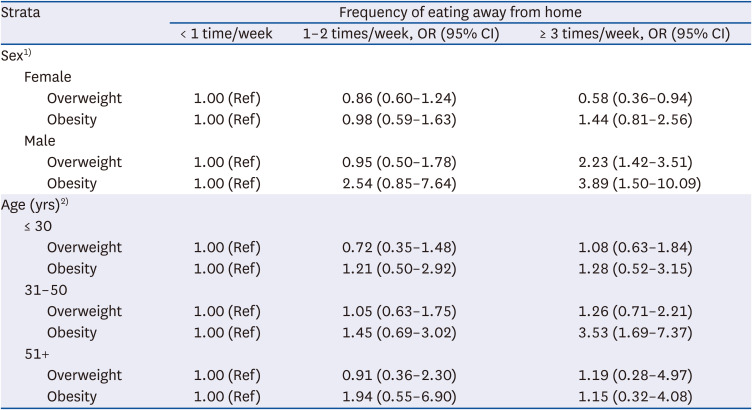
Table 3
Associations between eating away from home and overweight and obesity
Model 1: Unadjusted; Model 2: Adjusted for age and sex; Model 3: Adjusted for age, sex, educational level, marital status, current work status, physical activity, tobacco use, alcohol use, and fruit and/or vegetable intake.
![]()
Table 4
Associations between eating away from home and obesity and overweight stratified by sex and age
1)Adjusted for age, educational level, marital status, current work status, physical activity, tobacco use, alcohol use, and fruit and/or vegetable intake.
2)Adjusted for sex, educational level, marital status, current work status, physical activity, tobacco use, alcohol use, and fruit and/or vegetable intake.
![]()
Go to :
DISCUSSION
We examined the associations between EAFH and overweight and obesity in a nationally representative sample of Ugandan adults. In this population, we found a positive association between EAFH and obesity. However, this association was modified by sex and age. Frequent EAFH was positively associated with overweight and obesity in men, and obesity among the 31–50-year-olds, but negatively associated with overweight in women.
The positive associations between EAFH and overweight and obesity suggest that away-from-home food restaurants are offering unhealthy dietary options. No previous study has examined the relationships between EAFH and overweight and obesity in Uganda, but these relationships have been examined in other countries. EAFH was positively associated with obesity and overweight among Brazilian men [9]. In another study, EAFH was associated with higher BMI among adults [22], and in a review study, researchers concluded that EAFH was positively associated with bodyweight [10]. Furthermore, recent studies also concluded that EAFH was associated with obesity [1112]. Although other mechanisms such as decreased energy expenditure evidently contribute, obesity results from a positive energy balance secondary to excessive food consumption, and specifically, the consumption of large portion sizes of energy-dense foods [232425].
The dietary and nutrient compositions of meals eaten away from home could explain the positive associations between EAFH and overweight and obesity. EAFH is associated with the consumption of foods that are high in energy, fat, sugar, and salt, but low in fruits, vegetables, and micronutrients [5826]. Orfanous and colleagues reported that EAFH was associated with excessive energy intake and lower physical activity, which are both risk factors of weight gain [13]. Eating more fast foods was linked to excessive calorie intake and subsequent risk of weight gain [27]. In Uganda, street foods, one of the most popular types of foods eaten away from home, contribute more energy and carbohydrates, but less micronutrients than home-prepared foods [28] suggesting a low dietary quality of these foods and their potential contribution to obesity.
The positive associations between EAFH and obesity, and overweight in men is consistent with previous reports [9]. Our findings suggest that when EAFH, men choose dietary items that predispose to excess weight gain. We also found that men ate away from home more frequently than women. Culturally, this can be explained by the fact that women are responsible for food preparation in Uganda. Previous studies have reported that in urban areas of Uganda, more men eat at street food establishments than women [8], which suggests that men are more susceptible than women to the dietary deficiencies and/or excesses of away-from-home foods. In one recent Ugandan study, men consumed more energy and fat from street foods than women [8], which concurs with the findings of a Kenyan study [29]. Although street foods and kiosks are the most popular sources of away-from-home foods, further research is needed to determine the differential and independent contributions of various types of away-from-home meals to overall dietary and nutrient intake among Ugandan men. Furthermore, public health campaigns targeting men could encourage them to choose home-prepared meals. However, whether home-prepared meals in Uganda differ from away-from-home meals in terms of energy, macronutrient, and micronutrient compositions is not known and warrants further investigations. Nevertheless, preparing meals at home is associated with consumption of a healthier diet [30], and young adults that prepared their food more frequently consumed fewer fast-foods and had a better diet quality [31].
We found a negative association between EAFH and overweight in women, which is consistent with previous findings [9]. Specifically, eating meals at sit-down restaurants was inversely associated with obesity in women [9], and the authors of that study suggested that women select healthier options when EAFH. In Korea, middle-aged housewives consider the health benefits of away-from-home meals more important than not EAFH per se, and eating out frequency was related to frequent fruit intake in this sub-population [32]. In contrast, take-away foods were positively associated with increased BMI [11], and fast-food restaurants were associated with higher energy and fat intake and increased body weight in women [33]. Observed differences between study findings could reflect different study designs, populations, and different methods of evaluating EAFH.
Urbanization, changing socioeconomic status, women empowerment, and increasing educational attainment in Uganda could be drivers of away-from-home eating. In the present study, frequent consumers of away-from-home meals tended to be more educated, employed or self-employed, and younger than rare consumers, which is consistent with previous studies [3234]. Socio-demographic factors also influence consumers’ choices of the type of away-from-home food establishments. For example, street foods are considered an important source of diet by the urban and rural poor in Uganda, as is the case in other developing countries [828]. In Kenya, street foods are frequently consumed in low-income slum areas and by individuals without a regular income because of their convenience and affordability [35]. When socioeconomic levels increase, kiosks provide the main source of away-from-home foods [36]. On the other hand, fast food establishments like Nando’s, Domino’s pizza, and Steers are mostly preferred by the working class in Uganda [6].
The influence of EAFH on dietary intake and body weight differs according to the type of food establishment frequented, but we were unable to interrogate this topic due to limitations of the data used. It was reported in a 2014 review that, unlike restaurants, eating at fast-food restaurants greatly predicted an increase in body weight and waist circumference [11]. Larson and others reported that frequent use of burger and French fry-restaurants was associated with a high risk of overweight and obesity, and excessive intake of energy, fat, and sugar-sweetened beverages, whereas frequent use of full-service restaurants was related to a higher vegetable intake [37]. Studies are required to determine how socioeconomic status affects the choice of away-from-home food establishments, the contributions of different establishments to dietary and nutrient intake, and the influence of eating at different establishments on body weight in the Ugandan population.
This study has several limitations. First, respondents were asked to report the number of meals, including lunch, breakfast, and dinner, eaten per week that were not prepared at a home. Self-reported data has been frequently questioned in nutritional epidemiology because of its reliance on memory. For example, memory lapses could have resulted in over- or under-estimation of the number of meals consumed away from home in the present study. Nevertheless, we provide, for the first time, a broad view of the relationships between EAFH and overweight and obesity in the Ugandan population. Second, the cross-sectional nature of this study precludes the evaluation of causal relationships between EAFH and overweight and obesity. However, our study has some strengths. First, we used data obtained from a nationwide survey that included diverse tribal and socio-economic groups, and a wide age-range. Thus, the conclusions drawn can be generalized to the entire Ugandan population. Second, the study reveals sex and age-specific associations between EAFH and overweight and obesity that could be used to devise future interventions that target specific population sub-groups. Lastly, this study is the first in Uganda, and among a few in SSA, that investigated the relationships between EAFH and overweight and obesity in Uganda.
In conclusion, EAFH was positively associated with overweight and obesity, and these associations were modified by sex and age. A positive association was found between EAFH and overweight and obesity in men, and obesity in young/middle-aged adults, whereas a negative association was found between EAFH and overweight in women. Future studies should examine the influence of away-from-home food consumption at different establishments on body weight, their contribution to dietary intake, and the factors that influence the choice of eating at different establishments. Results from such studies would guide the design of systematic and effective interventions to modify the food environment and inform consumers about choosing healthy foods when dining out. In brief, our findings imply that nutritional interventions for obesity reduction in Uganda should target away-from-home eating, and that these interventions should specifically target men, young and middle-aged adults.
Go to :
 XML Download