

 PDF
PDF Citation
 Print
Print


INTRODUCTION
Sodium is an essential element for life that is involved in water balance, osmotic pressure, nerve stimulation, regulation of muscle stimulation, and absorption of nutrients such as glucose and amino acids [1]. However, excessive sodium intake has been reported to be a risk factor for causing or exacerbating noncommunicable diseases (NCDs), such as cardiovascular diseases, cerebrovascular diseases and kidney diseases as well as osteoporosis and gastric cancer [2345].
The World Health Organization (WHO) recognized in 2013 that reducing salt intake was one of the most effective and feasible approaches to prevent NCDs and emphasized that one of the 9 goals of the ‘Global Action Plan for the Prevention and Control of NCDs’ is to reduce salt intake by 30% by 2025 [6]. The Korea Food and Drug Administration also conducted a sodium reduction project aimed at reducing sodium intake by 20% by 2006. The ‘National Sodium Reduction Campaign Headquarters’ was launched in 2012 and expanded projects to reduce sodium intake such as improving the environment of sodium reduction and education and voluntary practice on sodium reduction by targeting consumers [7]. However, according to the Korea National Health and Nutrition Examination Survey (KNHANES) in 2019, the average daily sodium intake per person was 3,287 mg (3,851 mg for men and 2,699 mg for women), which was still higher than the WHO recommended daily sodium intake and the goal intake of 2,000 mg or the 2,300 mg of chronic disease risk reduction intake for Koreans [89]. In addition, the proportion of the population consuming more than the goal intake was 75.6%, corresponding to 4 out of 5 people [10]. In this situation, the sodium intake by individuals and populations needs to be continuously assessed for sodium reduction.
Currently, sodium intake is estimated using 24-h urine or spot urine samples, and dietary intake assessment methods such as 24-h dietary recalls, dietary records, and food frequency questionnaires [11]. Estimation of sodium intake using 24-h urine collection is considered to be the most reliable method for sodium intake assessment [12], but it has disadvantages in terms of time, cost, and burden on the participants. Various equations suggested by Kawasaki et al. [13], Tanaka et al. [14], Brown et al. [15] and Rhee et al. [16] have been used to estimate the daily sodium intake using sodium excretion in spot urine. Despite the development of these equations, 24-h dietary recalls, dietary records, and food frequency questionnaires are still commonly used because of their limited cost and low burden on participants. To our knowledge, most methods for estimating sodium intake are hard to use in large populations. However, to prevent various diseases induced by excess sodium intake, it is necessary to estimate and assess sodium intake easily and quickly.
The purpose of this study was to develop a simple tool for sodium intake estimation that can be used to monitor the sodium intake of individuals and populations without collecting urine and to screen for sodium high-risk populations. Therefore, we developed a sodium index that can estimate the sodium intake of individuals or populations using a questionnaire consisting of questions related to eating habit and dietary behaviors regarding sodium intake. In addition, we assessed the sodium intake status of Koreans using the sodium index developed.
Go to : 
SUBJECTS AND METHODS
In this study, the sodium index was defined as a tool for estimating and assessing the sodium intake levels of individuals or groups using a simple checklist questionnaire with verified validity and reliability. This study was conducted in 3 steps. The first step was to develop the estimation equation of 24-h sodium intake. The second step was to verify the validity and reliability of the equation developed in step 1. The third step was to develop a sodium index to easily assess sodium intake estimated by the equation and to apply it in the assessment of sodium intake by the population. This study was approved by the Institutional Review Board (IRB) of Kyungpook National University (IRB 2014-0053), and all of the subjects provided written informed consent.
Step 1. Development of the estimation equation of 24-h sodium intake
Study subjects
A total of 640 healthy men and women living in 4 provinces (Seoul, Chungcheong, Gyeongsang, and Jeolla) of Korea participated in this study and were classified into 19–29, 30–39, 40–49, 50–59, and 60–69 age groups. The subjects were recruited from city halls, health centers, universities, and senior welfare facilities of each province through off-site and on-site advertisements. To assess their eligibility as study subjects, a self-report questionnaire survey was conducted for applicants. The exclusion criteria were applicants who had been diagnosed with hypertension, heart failure, diabetes, renal disease, or cancer; were under medication or diet control; or were pregnant or lactating.
Questionnaire survey
Demographic characteristics and lifestyle factors of the subjects were collected by an interviewer-administered questionnaire. General characteristics included physical activity level, smoking status, income and education level, and occupation. Eating habits and the preference for salty foods were also included in the questionnaire. Variables of dietary behavior were eating behaviors related to sodium and potassium intake, frequency of eating out, frequently consumed eating out foods, and consideration factors for eating out. The entire questionnaire used in this study has been described previously [17].
Anthropometric measurements
Anthropometric measurements were obtained by well-trained interviewers and included body weight, height, waist circumference (WC), and blood pressure. Body weight and height were measured to the nearest 0.1 kg and 0.1 cm, respectively, using a weight and height measurement device (HM-201; Panix, Seoul, Korea), while the subjects were barefoot and wearing light indoor clothing. Body mass index (BMI) was calculated by dividing the body weight (kg) by the square of height (m2). WC was measured parallel at the midline between the lowest border of the rib cage and iliac crest at the end of a normal expiration while the participants were in a standing position with their feet 25 to 30 cm apart. Blood pressure was measured using an automatic electronic sphygmomanometer (Microlife WatchBP Home 3MX1-1; Microlife AG, Widnau, Switzerland) after sitting for 10 min, and for smokers it was measured 30 min after not smoking. When the first measurements were above 140 mmHg systolic or 90 mmHg diastolic, the blood pressure was measured again. When outside the normal range of blood pressure, the subjects were excluded.
The 24-h urine collection and analysis
The 24-h urine of the subject was collected twice. The subjects were asked to collect urine in a 500 mL measuring beaker, to measure and record the urine volume on the record sheet and to pool the samples in a urine bag over 24 h. Urine collection was started between 6:00 am and 9:00 am on the day of the 24-h urine collection, and all of the urine was collected for 24 h until the start urination on the next day. The first urine sample was discarded at the start of urine collection, and the final urine sample was collected at the end of urine collection. Compliance with 24-h urine collections was confirmed when the value of [collected urine volume/(weight × 21)] was over 0.7. When the value was lower than 0.7 and the creatinine concentration of the 24-h urine was lower than the reference value [18], the data were excluded from the statistical analyses. Sodium and creatinine levels in the urine samples were analyzed by the indirect ion-selective electrode (ISE) method and by a kinetic colorimetry assay, respectively, using ISE modular analytics (Hitachi, Tokyo, Japan).
Step 2. Validity and reliability of the estimation equation of 24-h sodium intake
Study subjects
A total of 200 adults (100 men and 100 women) were recruited from 4 provinces of South Korea, 50 from each province (metropolitan area, Chungcheong, Gyeongsang, and Jeolla). The recruitment method and the exclusion criteria of the subjects were the same as those in Step 1.
The 24-h urine collection and questionnaire survey
To verify the validity of the estimation equation of 24-h sodium intake, 24-h urine collection and questionnaire surveys were conducted using the same methods as in Step 1. Two 24-h sodium intakes of each subject were calculated using urine analysis as a standard value and using the developed equation with the questionnaire data. Additionally, for the reliability verification of the estimation equation of 24-h sodium intake, the same questionnaire survey was conducted again 3 days later.
Step 3. Development and application of the sodium index
Development of the sodium index
The sodium index and its classification criteria for sodium intake calculated from the validated and reliable equation for the estimation of 24-h sodium intake, was developed. The sodium index was determined based on an adequate sodium intake of 1,500 mg and a goal intake of 2,000 mg [8]. The sodium index and its classification criteria were finalized after 2 consultations about their conformity and expressions by 33 experts (doctors, dieticians, and professors) using Delphi method.
Application of the sodium index
The applicability of the sodium index was tested among 1,600 adults aged 20 to 69 yrs in the metropolitan area, Chungcheong, Gyeongsang, and Jeolla of Korea (200 men and 200 women per province). Sex, age, BMI, eating habit, and dietary behaviors of the subjects were surveyed and sodium intake was estimated using the equation developed in this study, and the sodium index was finally determined.
Statistical analysis
Statistical analysis was performed using Statistical Package Social Science (SPSS Version 22; SPSS Inc., Chicago, IL, USA) and Statistical Analysis System (SAS Version 9.3; SAS Institute Inc., Cary, NC, USA) programs. In step 1, the estimation equation of sodium intake was developed through multiple linear regression analysis using sodium intake calculated from 24-h urinary sodium excretion and all survey data, such as anthropometric measurements, sodium-related eating habits, and dietary behaviors. The estimate of sodium intake was confirmed to be 85% of 24-h urinary sodium excretion [1920]. The process of selecting meaningful candidate variables was based on the following 3 criteria: significant (P < 0.2) factors from the univariate models, important variables found in previous study regardless of their significance [21], and variables with a < 2.0 variance inflation factor indicating minimal collinearity. Then, stepwise selection with the exclusion criterion at P ≥ 0.15 was performed to determine the estimation equation of sodium intake [17]. In step 2, the validity of the equation was tested using Student's t-test to assess the difference between 24-h sodium intake from the equation and 24-h urinary excretion as a reference value in the same subjects. Joint classification analysis was performed to describe the agreement between the estimated and measured 24-h sodium intake, and the mean bias between them was visualized in a Bland-Altman plot with 95% limits of agreement [22]. The sensitivity and specificity of the equation were tested, and receiver operating characteristic (ROC) curves were also used to evaluate its accuracy. A reliability test of the equation was performed by comparing the mean difference between the first and second sodium intakes calculated from the equation in the same subjects and by Spearman's correlation coefficient between them, and joint classification analysis and kappa values were used as indicators. In step 3, the sodium index of 1,600 subjects was calculated to assess 24-h sodium intake. The difference in the sodium index of the subjects according to sex, region, and age was analyzed by Student's t-test, analysis of variance, and Duncan's multiple range test. All statistical significance was tested at P < 0.05.
Go to :
RESULTS
General characteristics of the subjects
The subjects participating in the 3 steps were equally distributed according to gender, age (19–29, 30–39, 40–49, 50–59, 60–69 yrs), and region (metropolitan area, Chungcheong, Gyeongsang, and Jeolla). As shown Table 1, the general characteristics of the subjects participating in steps 1 and 2 have been described previously [17]. In step 3, average age, height, weight, BMI, WC, and blood pressure of the subjects were 44.2 yrs, 172.6 cm, 73.1 kg, 24.5 kg/m2, 85.5 cm, 129.1/82.8 mmHg for men and 44.2 yrs, 159.5 cm, 56.4 kg, 22.1 kg/m2, 74.8 cm, 120.8/77.1 mmHg for women, respectively, with significant differences except for age (P < 0.001).
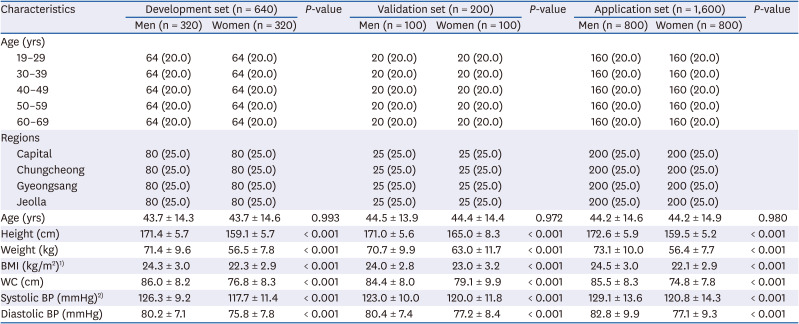
Table 1
Characteristics of the subjects
Values are presented as number (%) or mean ± SD.
BMI, body mass index; WC, waist circumference; BP, blood pressure.
![]()
Development of the estimation equation of 24-h sodium intake
Table 2 shows the equation for the estimation of 24-h sodium intake developed using 24-h urinary sodium excretion as a reference value of 640 subjects. Based on stepwise multiple regression analysis, the equation was developed and the variables included in the equation were sex, age, BMI, eating habit, and dietary behaviors in both men and women. The sex was given 1 for men and 2 for women, and the age was 1 for aged 19–29, 2 for aged 30–39, 3 for aged 40–49, 4 for aged 50–59, and 5 for aged 60–69. The questions and score calculation of eating habit and dietary behaviors related to sodium intake are shown in Table 3. Eating habit was calculated as 10 points for eating without salt, 20 points for eating not salty, 30 points for eating normally, 40 points for eating slightly salty, and 50 points for eating salty. The dietary behaviors can be scored from 20 to 100 points by summing the points corresponding to the responses to the 10 questions.
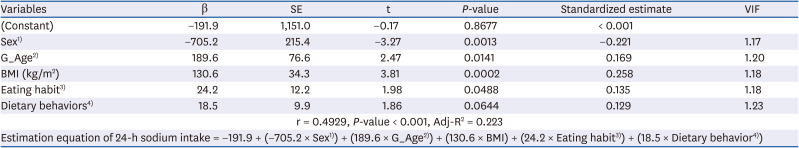
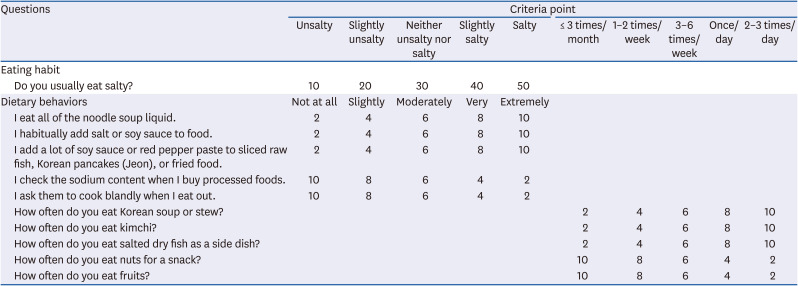
Table 2
Equation for estimation of 24-h sodium intake, developed using the β-coefficient estimates in multiple linear regression
BMI, body mass index; VIF, variance inflation factor.
1)1 = men, 2 = women; 2)1 = 19–29, 2 = 30–39, 3 = 40–49, 4 = 50–59, 5 = 60–69; 3)10 = unsalty, 20 = slightly unsalty, 30 = neither unsalty nor salty, 40 = slightly salty, 50 = salty; 4)20–100 of a total of 10 items.
![]()
Table 3
Questions of eating habit and dietary behavior used in the estimation equation of 24-h sodium intake
![]()
Validity and reliability of the estimation equation of 24-h sodium intake
Validity of the equation
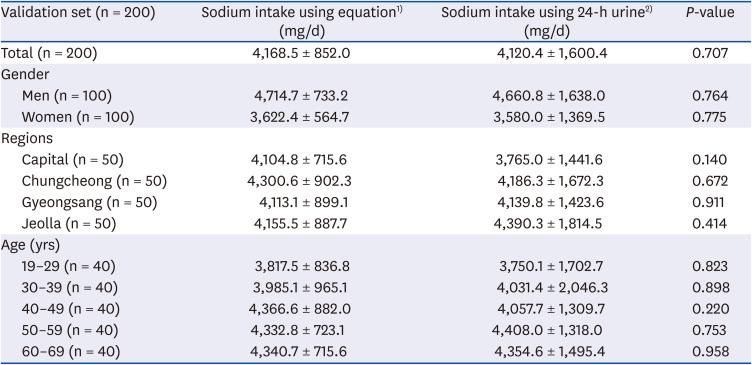
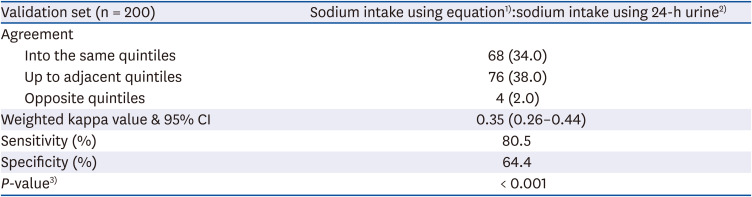
Table 4 shows the difference between the 24-h sodium intake calculated using the equation and that from the 24-h urine analysis of 200 subjects. There was no significant difference between the 2 sodium intake estimates of the subjects according to sex, region, and age. Table 5 shows the 5-decade concordance rate, sensitivity, and specificity of sodium intake using the equation or when using the 24-h urine analysis. The concordance rate, which was judged to be the same quintile, was 34%, the concordance rate of the adjacent quintile was 38%, and the percentage to be judged to be the opposite was 2%. The sensitivity and specificity of the equation for the estimation of sodium intake were 80.5% and 64.4%, respectively. In the Bland-Altman plots presenting the difference between the sodium intakes using 24-h urine analysis and using the equation, the mean value was −1.5 mg/day and the difference was approximately 0.03% of the mean value (Fig. 1). In the ROC curve, which is an index to evaluate the usefulness or accuracy of the test method, the area under the ROC curve (AUC) was 0.76 (Fig. 2).
 | Fig. 1Bland-Altman plots of measured 24-h urinary sodium intake and estimated 24-h sodium intake (validation set, n = 200).
|
 | Fig. 2Receiver operating characteristic curve for validation of the equation to estimate sodium intake (validation set, n = 200).AUC, area under the receiver operating characteristic curve.
|
Table 4
Sodium intake estimated using the equation and using 24-h urine analysis
1)Estimated 24-h sodium intake using the equation; 2)Estimated 24-h sodium intake using 24-h urine (measured 24-h urinary sodium excretion/0.85).
![]()
Table 5
Estimation accuracy between sodium intake using the equation and sodium intake using 24-h urine
Values are presented as number (%).
CI, confidence interval.
1)Estimated 24-h sodium intake using 24-h urine (mg/d); 2)Estimated 24-h sodium intake using the equation (mg/d); 3)Joint classification analysis.
![]()
Reliability of the equation
In the reliability verification of the equation, there was no significant difference between the first and second sodium intakes calculated using the equations and Spearman's correlation coefficient between the 2 sodium intakes was 0.98 (Table 6).
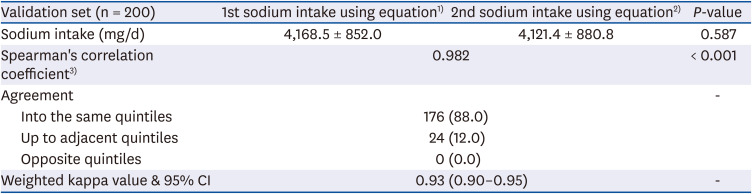
Table 6
Correlation coefficient and agreement between the estimated first and second sodium intakes using the equation
Values are presented as number (%).
CI, confidence interval.
1)First estimated 24-h sodium intake using the equation; 2)Second estimated 24-h sodium intake using the equation; 3)Spearman's correlation coefficient between the first and second estimated 24-h sodium intakes using the equation.
![]()
Development of the sodium index for sodium intake assessment
The sodium index and its assessment criteria of sodium intake are shown in Table 7. A sodium intake of 1,500 to 2,000 mg estimated by the equation was set to 75 to 100 points on the sodium index, which means ‘very moderate’. In addition, it was set 100–150 points meaning ‘moderate’ for 2,000–3,000 mg, less than 75 points or 150–250 points meaning ‘careful’ for less than 1,500 mg or 3,000–5,000 mg, and 250 points or more meaning ‘severe’ for 5,000 mg or more.
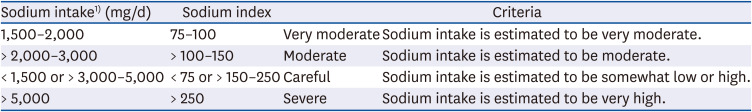
Table 7
Criteria of the sodium index for assessing sodium intake
![]()
Sodium intake assessment using the sodium index
Table 8 shows the sodium intake assessment using the sodium index according to sex, region, and age. The average sodium index was 245.1 for men and 182.6 for women, with a significant difference (P < 0.001). The sodium index was assessed to be ‘careful’ for both men and women. Approximately 49% and 47.2% of men were assessed to be ‘careful’ and ’severe’, respectively, while 59.9% of women were ‘careful’ and their ‘severe’ rate was very low at 1.4%. Gyeongsang Province scored the lowest at 208.0, and Jeolla Province scored the highest at 219.0 (P < 0.01). All of the sodium index in the 4 regions were assessed to be ‘careful’. In particular, the percentage of ‘severe’ cases in Jeolla Province was 29.7%, which was higher than those in other regions. In the comparison of the sodium index according to age, the 20s scored the lowest at 195.8, and the 60's scored the highest at 225.1 (P < 0.001). All of the sodium index in the age groups were assessed as ‘careful’. The percentage of ‘severe’ was 10.0% for the 20s, 24.1% for the 30s, 27.8% for the 40s, 28.4% for the 50s, and 31.3% for the 60s, which was significantly higher with the increment of age (P < 0.001).
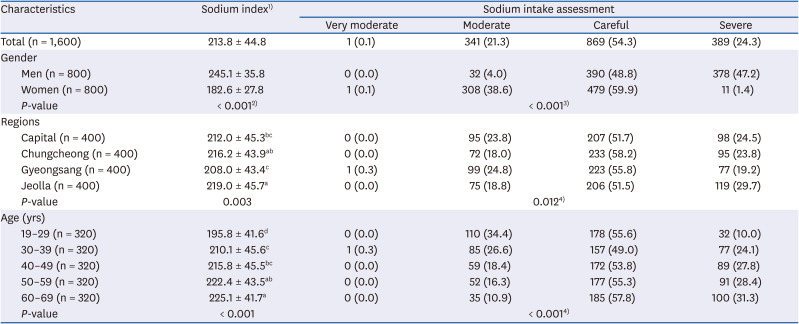
Table 8
Sodium intake assessment using the sodium index of the subjects according to gender, region and age
Values are presented as number (%).
1)Very moderate (75–100), moderate (> 100–150), careful (< 75, > 150–250), severe (> 250); 2)P-value by analysis of variance test; 3)P-value by Fisher's exact test; 4)P-value by χ2 test.
Different letters indicate significant difference determined by Duncan's multiple-range test at α = 0.05.
![]()
Go to :
DISCUSSION
Although 24-h urine analysis is the best method for assessing individual sodium intake, it is difficult to conduct large-scale surveys or obtain results quickly because of the cost of the analysis and the need for trained professionals. In this study, the sodium index was developed using an equation for estimation of the 24-h sodium intake through a questionnaire reflecting the dietary characteristics of Koreans without the need for 24-h urine collection or applying the 24-h recall method. The applicability of the sodium index was evaluated. It can be used monitoring the sodium intake level and as a screening tool for high-risk sodium groups.
The sodium index was developed as a tool for estimating and assessing the sodium intake of individuals or populations using a simple questionnaire. The sodium index was applied to calculate sodium intake by applying a questionnaire checklist, converting it into an index and finally assessing the sodium intake status. The first step was to calculate the 24-h sodium intake by applying the values collected by the questionnaire to the equation. The equation for the estimation of 24-h sodium intake, which consists of a simple questionnaire including the 5 variables of sex, age, BMI, eating habit (1 question) and dietary behaviors (10 questions), was developed using data from 640 healthy participants.
The validity and reliability of this equation were verified using sodium intake from 24-h urine of 200 participants as a reference value. In the validity test of the equation for estimation of 24-h sodium intake, there was no significant difference between the sodium intake using the equation and the actual sodium intake from 24-h urine analysis. The mean value difference between the sodium intakes using the equation and 24-h urine analysis was only −1.5 mg/day by the Bland-Altman plot, which is a graph showing the difference between the 2 methods for the same subjects. Rhee et al. [23] reported that the sodium excretions calculated from the Kawasaki equation, Tanaka equation, and INTRSALT equation using single-time spot urine were significantly different from the sodium excretion using 24-h urine analysis, and the mean differences were 554.3 mg, −328.9 mg, and 800.4 mg, respectively. The mean excretion of sodium calculated from the equation using multiple spot urine was not significantly different from that of the 24-h urine analysis but, the mean difference was still high at 667 mg.
In this study, the sensitivity of the equation for sodium intake estimation was 80.5%, and the specificity was 64.4%, which indicates that the validity of the equation is relatively good. Sensitivity refers to the rate at which a person with a disease is accurately judged as a person with a disease. Specificity means the rate at which a person without a disease is correctly judged as a person without a disease [24]. Ji et al. [25] reported that the sensitivity and specificity were 95–100% and 0–9%, respectively, in a validity test of Tanaka's equation using spot urine from 915 subjects of various ethnicities (White, Black, and South Asian). The sensitivity found in the present study was lower than that of Ji et al. [25], but the specificity was high. Son et al. [26] reported a sensitivity of 73.8% and a specificity of 84.0% for the DFQ25 in a validity study of a semiquestionnaire to estimate sodium intake. The ROC curve is used to determine the accuracy of a test method. The ROC curve is evaluated by the AUC, and the larger the AUC area is, the more accurate the test method. An AUC of 0.9–1 is excellent, 0.8–0.9 is good, 0.7–0.8 is fair, 0.6–0.7 is poor, and 0.5–0.6 is failed [27]. The AUC of the equation developed in this study was 0.76, which is more accurate than the AUC of 0.52–0.62 reported by Ji et al. [25].
In the reliability assessment of the equation developed in this study, there was no significant difference between the mean values of the first and second sodium intake using the equation for the same subjects, and the Spearman correlation coefficient was high at 0.98. Han and Bae [28] reported a correlation coefficient of 0.44 in a reliability test of a food intake frequency questionnaire. Compared to this, the results of the equation developed in this study showed a higher correlation, which means that the reliability of the equation developed in the present study is high. The method of estimating sodium intake through the equation using spot urine, even though it is easier than 24-h urine collection, is highly affected by various factors, such as the collection time of the spot urine, the number of urine samples, and the race, age, and diseases of the participants, so the range and variation of its estimation accuracy is very large [23252930]. The equation for estimating sodium intake developed in this study using sex, age, BMI, eating habit, and dietary behaviors could be used to easily assess sodium intake by healthy adults.
After estimating the 24-h sodium intake using the equation, sodium intake can be assessed by switching to the sodium index. Sodium intake of 1,500 to 2,000 mg estimated by the equation was set to 75 to 100 points on the sodium index. Therefore, the sodium index is calculated by dividing the 24-h sodium intake estimated from the equation by 20. The sodium index is intended to make the assessment of sodium intake easier and faster in populations than in individuals. When the sodium intake status of 1,600 healthy adults was assessed by applying the sodium index developed in this study, 96% of men and 61.3% of women were assessed as ‘careful’ and ‘severe’. The sodium index was the highest at 219.0 in Jeolla Province, followed by Chungcheong, Capital, and Kyungsang Province, and all of the sodium indices corresponded to ‘careful’. In a study by Park and Chung [31] using the KNHANES from 2010–2012, 93.7% of men and 81.9% of women consumed more sodium than the goal intake of 2,000 mg/day, with a significant gender difference. However, the percentages according to region, 88.2% in the capital area, 88.5% in Chungcheong Province, 87.0% in Gyeongsang Province, and 85.6% in Jeolla Province, did not show significant differences. The results of the sodium index assessment in this study; showed that the higher the sodium index was, the higher the age, BMI, eating habit and dietary behaviors related sodium intake (data not shown). Because sodium intake is correlated with energy intake, an increased BMI may be associated with increased energy intake in the high the sodium index group. In addition, there was a significant positive correlation between self-preference for salty tastes and dietary behaviors related to salt intake [32]. A higher intake of sodium due to dietary behaviors may lead to thirst, which may increase the intake of beverages and increase the BMI [333435]. As such, the sodium index can easily monitor and assess the sodium intake status of individuals and populations and be used to find relationships with various factors to achieve salt intake reductions.
This study is not without limitations. The sodium index, including the equation for the estimation of 24-h sodium intake, was developed for the Korean population, and cannot be generalized to other populations. The second is possible selection bias, as the subjects, all volunteers, might be more interested in their health than randomly sampled subjects. Despite these limitations, this study has strengths. The sodium index developed in this study is a tool that can be easily assessed according to the degree of sodium intake through questionnaires without 24-h recall or 24-h urine analysis. Therefore, this tool can be used for customized education of individuals with ‘careful’ and ‘severe’ sodium intake and for the identification of high risk groups for sodium intake. By assessment of the sodium index, using BMI, eating habit, and dietary behaviors, improvements can be confirmed, so the assessment itself can have an effect of education. In addition to monitoring the individual sodium intake status, it can be used to monitor the sodium intake status of the population in public health centers, food service centers, schools, local governments, and at the national level.
Go to :
 XML Download