

 PDF
PDF Citation
 Print
Print


INTRODUCTION
Biotin is a water-soluble vitamin classified within the B-group of vitamins. Biotin is associated with fatty acid synthesis, gluconeogenesis, odd-chain fatty acid metabolism, and branched-chain amino acid catabolism. The vitamin functions as a coenzyme for the following 4 carboxylases: acetyl-CoA carboxylase (ACC), pyruvate carboxylase (PC), propionyl-CoA carboxylase (PCC), and methylcrotonyl-CoA carboxylase (MCC). A biotin deficiency is not observed among individuals who live a normal lifestyle. On the other hand, biotin deficiencies have been reported in infants who receive specialized infant formulas [1], patients with chronic alcoholism, or those using antiepileptics, such as carbamazepine, phenytoin, and phenobarbital [2345], and patients with multiple carboxylases or biotinidase deficiencies [6]. Biotin deficiency manifests as dermatitis or alopecia. Other indicators of biotin deficiency (low levels of biotin in the blood and urine) have been observed among specific biotin-deficient populations. A previous study reported potential biotin deficient (BD) mouse oocyte-induced meiosis failure characterized by spindle defects and chromosome misalignment [7]. In addition, abnormal meiosis was not repaired even when biotin was replenished in the diet for 21 days [7]. The detailed relationship between a biotin deficiency and oocyte meiosis is unclear.
Lipid droplets are organelles that contain a neutral lipid core and are composed primarily of triglyceride (TG), cholesterol esters, phospholipids, and various proteins. Recently, it was reported that oocyte lipid droplets are particularly important for oocyte meiotic and early embryonic development [89]. Furthermore, oocyte lipid droplets are used as an energy source for oocyte meiosis [1011]. Energy defects can induce abnormal meiosis, leading to problems, such as spindle defects and chromosomal misalignment. Abnormal meiosis can induce infertility, abortion, and chromosome abnormalities [1213].
ACC regulates fatty acid synthesis. A biotin deficiency suppresses the ACC messenger RNA (mRNA) expression levels and increases the phosphorylation of the ACC protein [141516]. As a result, the ACC enzymatic activity is reduced, suppressing lipogenesis [1617]. The amount of lipid droplets has been reported to decrease in human adipocytes cultured under low biotin conditions [18]. On the other hand, it is unclear if a biotin deficiency affects the lipid metabolism in oocytes.
The mitochondria also play a crucial role in oocyte meiosis [19]. Meiotic spindles are comprised of the tubulin protein. Because tubulin is rapidly turned over, a large amount of energy is required to complete normal meiosis [20]. Malfunctioning mitochondria can induce abnormal meiosis due to an ATP deficiency [21]. Interestingly, it was reported that the mitochondria expand in human cells under low biotin conditions and in the livers of biotin-deficient rats [1821].
This study examined the following effects of a biotin deficiency and subsequent biotin replenishment on mice: 1) oocyte lipid droplet levels, 2) oocyte mitochondrial function, and 3) ovary lipid and energy metabolism. Furthermore, this study tested whether long-term replenishment of biotin (42 days) restored the abnormal meiosis.
Go to : 
MATERIALS AND METHODS
Chemicals
Egg-white solids were purchased from CLEA Japan (Tokyo, Japan). Corn oil, sucrose, choline bitartrate, biotin, and Nile Red were obtained from FUJIFILM Wako Pure Chemical Corporation (Osaka, Japan). A mineral mixture (AIN-93-G-MX) [22], dextrin, and cellulose were supplied by Oriental Yeast Co., Ltd. (Tokyo, Japan). A biotin-free vitamin mixture (AIN-93) [22] was prepared by mixing 4 fat-soluble vitamins and eleven water-soluble vitamins, excluding biotin and ascorbic acid.
Mice and diets
Female Cr1:CD1 mice (3-weeks-old) were obtained from Charles River Laboratories (Tokyo, Japan). Cr1:CD1 mice were chosen because the mouse strain was used in a previous report [7]. The mice were divided immediately into 3 groups (control group, n = 23; BD group, n = 13, recovery group, n = 13) and housed in metabolic cages (LC-0335; CLEA Japan) to collect the 24-h urine samples and prevent biotin from feces. The dietary components are described elsewhere [7]. Fig. 1 outlines the experimental design. The control mice were fed a 30% egg-white diet (biotin, 0.004 g/kg diet) as the control diet throughout the experiment. The BD mice were fed a BD diet throughout the experiment. The biotin concentration in the diet was determined according to the report by Báez-Saldaña et al. [23]. The recovery mice were fed a BD diet until day 21, which was changed to the control diet on day 22. The animals were allowed free access to food and water, and their body weight was measured every 2 days. The food intake of the mice was measured daily. The temperature was maintained at approximately 20°C with 60% humidity and a 12-h light/dark cycle (lights on at 07:00 and off at 19:00). The care and treatment of the experimental animals conformed to the guidelines for the ethical treatment of laboratory animals set out by Nara Women's University (Nara, Japan) (approval No. 18-03).
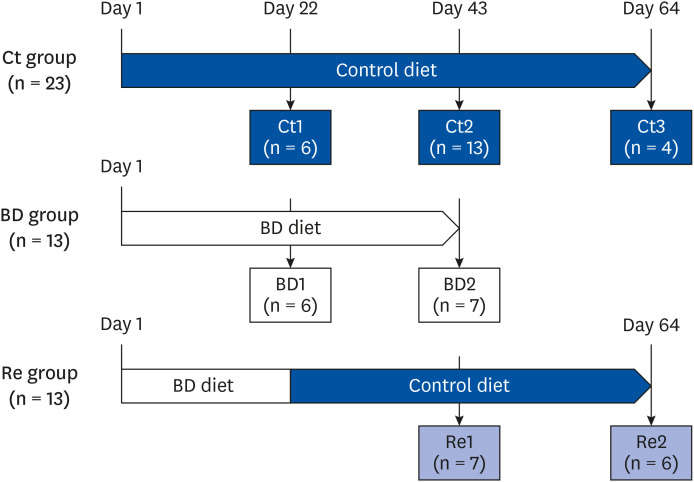 | Fig. 1Experimental design. The mice were divided into 3 groups: Ct group, BD group, Re group. The BD group mice were fed a BD diet. The recovery group mice were fed a BD diet until day 21 and a biotin-containing diet from day 22 to day 64. Some mice from each group were euthanized on days 22, 43, or 64.Ct group, control group; BD group, biotin deficient group; Re group, recovery group.
|
Tissue and plasma collection
On day 22, a subgroup of mice was selected randomly from the control and BD groups and euthanized (control group 1 [Ct1], n = 6; BD group 1 [BD1], n = 6). On day 43, the remaining mice in the BD group and some further randomly selected mice from the control and recovery groups were also euthanized (control group 2 [Ct2], n = 13; recovery group 1 [Re1], n = 7; BD group 2 [BD2], n = 7). On day 64, the remaining mice in the control and recovery groups were euthanized (control group 3 [Ct3], n = 4; recovery group 2 [Re2], n = 6). Oocytes, blood, liver, uterus, and ovaries were collected from each mouse. The ovaries, uterus, and liver were removed and weighed. Blood samples were collected from the heart in EDTA-2Na tubes (Terumo Co., Ltd., Tokyo, Japan). These whole blood samples were centrifuged at 1,700 × g for 30 min at 4°C to obtain the plasma. The samples were stored at −80°C until analyzed.
Oocyte collection
The oocytes were collected by injecting 5-IU pregnant mare serum gonadotrophin (PMSG; product No. L816A; ASUKA Pharmaceutical Co., Ltd., Tokyo, Japan) into the peritoneal cavity of the mice [7]. The mice were then injected with 5-IU human chorionic gonadotrophin (hCG; product No. L239A; ASUKA Pharmaceutical Co., Ltd.), 48 h after PMSG-priming. The oocyte-cumulus cell complexes were collected from the oviducts in EmbryoMAX® FHM HEPES buffer medium (FHM; Millipore Corp., Billerica, MA, USA), 18 h after hCG injection. The oocyte-cumulus cell complexes were incubated with 5% hyaluronidase (Sigma-Aldrich Inc., Tokyo, Japan) for 10 min at room temperature to remove the cumulus cells. All oocytes were counted, and their morphology was classified as a normal or abnormal morphology (dead oocyte) using a Hoffman light microscope. Fragment and lysis oocytes were judged to be morphologically abnormal [24].
Nile red staining of lipid droplets in oocytes
We referred to the report of Genicot et al. [25] for the Nile Red staining method. The oocytes were fixed in 4% paraformaldehyde for 15 min at room temperature. The oocytes were then washed 3 times with PBST (0.05% Tween 20, PBS) before being stained with 10 µg/mL Nile Red for 6 h. After washing 3 times with PBST, the oocytes were mounted using PermaFluor aqueous mounting medium (Thermo Fisher Scientific, Yokohama, Japan) and examined by confocal fluorescence microscopy (C2; Nikon Instech, Co., Ltd., Tokyo, Japan). Lipid droplets in oocytes were detected at an excitation (Ex) and emission (Em) wavelength of 561 nm and 593/40 nm, respectively, and calculated using ImageJ software.
Mitochondrial membrane-potential assay
The mitochondrial membrane potential [24] was detected by placing the oocytes in FHM medium containing JC-1 (Enzo Life Science, Inc., Farmingdale, NY, USA) at 4.4 µmol/L and incubating them at 37°C in 5% CO2 for 40 min. The mitochondrial membrane potential of the mitochondria in the oocytes was determined using a Floid™ cell imaging station (Thermo Fisher Scientific, Waltham, MA, USA) and calculated as the ratio of red fluorescence, corresponding to active mitochondria (Ex 586/15 nm, Em 646/68 nm) to green fluorescence, corresponding to less active mitochondria (Ex 482/18 nm, Em 532/59 nm). The fluorescence intensities in the control group were set arbitrarily to 1, and the intensities of fluorescence detected in the experimental groups were measured and expressed relative to those of the control group.
Immunofluorescence
The immunofluorescence method is described in a previous report [7]. Forty-two and 51 oocytes were collected from the Ct3 group and Re2 group, respectively, on day 64 (mice: n = 3 or 4/group). The spindles and chromosomes in oocytes were stained with the anti-tubulin antibody (Cell Signaling Technology, Inc., Danvers, MA, USA), goat anti-mouse immunoglobulin G (IgG) with Alexa Fluor-499, and 0.1 mg/mL propidium iodide solution to discriminate between normal and abnormal oocytes. The oocytes were observed by confocal fluorescence microscopy. The method used to classify oocytes as normal or abnormal is described elsewhere [26].
Expression of genes in ovaries
The removed ovaries were stored at -80°C until analysis. The total RNA was isolated from the ovary samples using RNAiso Plus (Takara Bio Inc., Shiga, Japan). The isolated total RNA concentrations were calculated by measuring the absorbance at 260 nm. Reverse transcription was performed on 0.5 μg RNA using ReverTra Ace® quantitative polymerase chain reaction (qPCR) RT Master Mix (TOYOBO Co. Ltd., Tokyo, Japan). The analysis was performed by real-time reverse-transcriptase polymerase chain reaction (RT-PCR) on a Light cycler® Nano (Roche Diagnostics K.K., Tokyo, Japan) using Thunderbird SYBR qPCR Mix (TOYOBO Co. Ltd.). The expression of each target mRNA was calculated and normalized to glyceraldehyde 3-phosphate dehydrogenase (Gapdh) using the 2−ΔΔCT method. Real-time RT-PCR was carried out with the primers listed in Table 1. Each primer except Gapdh was designed using nucleotide BLAST in NCBI. The primers for Gapdh are reported elsewhere [26].
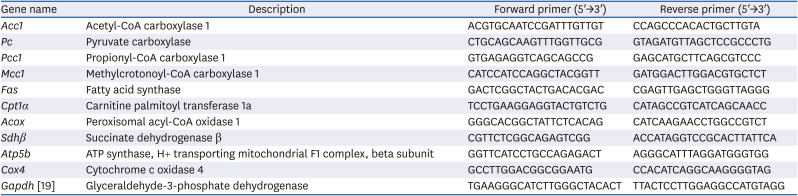
Table 1
List of primers
| Gene name | Description | Forward primer (5′→3′) | Reverse primer (5′→3′) |
|---|---|---|---|
| Acc1 | Acetyl-CoA carboxylase 1 | ACGTGCAATCCGATTTGTTGT | CCAGCCCACACTGCTTGTA |
| Pc | Pyruvate carboxylase | CTGCAGCAAGTTTGGTTGCG | GTAGATGTTAGCTCCGCCCTG |
| Pcc1 | Propionyl-CoA carboxylase 1 | GTGAGAGGTCAGCAGCCG | GAGCATGCTTCAGCGTCCC |
| Mcc1 | Methylcrotonoyl-CoA carboxylase 1 | CATCCATCCAGGCTACGGTT | GATGGACTTGGACGTGCTCT |
| Fas | Fatty acid synthase | GACTCGGCTACTGACACGAC | CGAGTTGAGCTGGGTTAGGG |
| Cpt1α | Carnitine palmitoyl transferase 1a | TCCTGAAGGAGGTACTGTCTG | CATAGCCGTCATCAGCAACC |
| Acox | Peroxisomal acyl-CoA oxidase 1 | GGGCACGGCTATTCTCACAG | CATCAAGAACCTGGCCGTCT |
| Sdhβ | Succinate dehydrogenase β | CGTTCTCGGCAGAGTCGG | ACCATAGGTCCGCACTTATTCA |
| Atp5b | ATP synthase, H+ transporting mitochondrial F1 complex, beta subunit | GGTTCATCCTGCCAGAGACT | AGGGCATTTAGGATGGGTGG |
| Cox4 | Cytochrome c oxidase 4 | GCCTTGGACGGCGGAATG | CCACATCAGGCAAGGGGTAG |
| Gapdh [19] | Glyceraldehyde-3-phosphate dehydrogenase | TGAAGGGCATCTTGGGCTACACT | TTACTCCTTGGAGGCCATGTAGG |
![]()
Western blotting
The collected ovaries (mice: n = 3 or 4/group) were homogenized in RIPA buffer containing 10 mmol/L sodium fluoride and 1 mmol/L phenylmethylsulfonyl fluoride as the phosphatase and protease inhibitors, respectively. The homogenates were centrifuged at 15,000 × g for 10 min at 4°C to obtain the supernatants. The supernatants were subjected to sodium dodecyl-sulfate polyacrylamide gel electrophoresis and analyzed by Western blotting using the primary and secondary antibodies (anti-pACC [Ser79] Cat#11818; anti-ACC Cat#3676; anti-rabbit IgG HRP-linked antibody Cat#7074 from Cell Signaling Technology (Beverly, CA, USA); Anti-GAPDH Cat. 015-25473 from Wako Pure Chemical Corporation). Immunoreactive bands were visualized using a Luminescence Reagent Set (Wako Pure Chemical Corporation) and detected with Image Quant LAS500 (GE Healthcare Japan, Tokyo, Japan). The intensity of the detected bands was calculated using ImageJ software.
Measurement of biotin in urine and liver samples
Urine samples (24-h urine) were collected on days 18, 38, and 60 in amber bottles containing 1 mL 0.1 mol/L HCl. The urine samples were stored at −20°C until analysis. The biotin in the urine and liver samples was measured using a microbiological method with Lactobacillus plantarum ACTT 8014 [27].
Serum TG analyses
The TG concentrations were determined using a TG E-test Wako kit according to the manufacturer's instructions (FUJIFILM Wako Pure Chemical Corporation).
Statistical analyses
All data are reported as the means ± SEM. The data on days 22 and 64 were analyzed using a Student's t-test, and the data on day 43 were analyzed by 1-way analysis of variance, followed by Tukey's multiple comparison test. The frequency of abnormal oocytes was analyzed using a χ2 test. A P-value < 0.05 was considered significant. All statistical analyses were conducted using GraphPad Prism version 5.0 (GraphPad Software, Inc., San Diego, CA, USA).
Go to :
RESULTS
Bodyweight, food intake, tissue weight, and biotin nutritional status
BD and biotin re-feeding had no effect on the body weight, total food intake, liver weight, or ovary weight of mice throughout this experiment (Table 2). Only the uterus weight in the BD2 group was lower than in the Ct2 group and Re1 group.
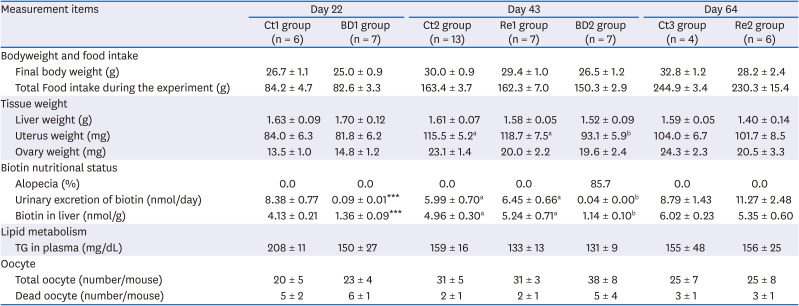
Table 2
Effect of biotin-deficiency and biotin re-feeding on the food intake, tissue weight, oocyte ovulation, and biotin nutritional status
Values are the means ± SE. Data on day 22 and day 64 were analyzed using the Student's t-test. The data on day 43 were analyzed by 1-way analysis of variance, followed by Tukey's multiple comparison test. Significantly differences are indicated by different lower-case letters, at P < 0.05.
Ct group, control group; BD group, biotin deficient group; Re group, recovery group.
***P < 0.001.
![]()
Alopecia has previously been used as an index and a physical sign of biotin deficiency in animal experiments [2328]. On day 22, no mice in the BD1 group exhibited alopecia. The mice first began to show alopecia on day 23. Finally, alopecia was observed in 6 out of 7 mice in the BD2 group on day 43. By contrast, no alopecia was observed in Re1 and Re2 groups. The urinary excretion of biotin and biotin concentration in the liver was markedly lower in the BD1 and 2 groups than in the Ct 1 and 2 groups (Table 2). The urinary excretion of biotin and biotin concentration in the liver of the recovery groups was restored to the same level as the control groups on days 43 and 64 (Table 2).
Effect of biotin deficiency and re-feeding on the TG level of plasma
The effects of biotin deficiency and biotin re-feeding on the TG levels in plasma were examined. Table 2 lists the TG concentrations. TG levels tend to be lower in the BD1 and 2 groups and Re1 group on days 22 and 43, albeit not significantly. The TG levels in the Re2 group were restored compared to the levels in the Ct3 group on day 64.
Effect of biotin deficiency and re-feeding on the number of ovulated oocytes
Table 2 lists the number of oocytes. Condensed or fragmented oocytes were defined as dead oocytes. Biotin deficiency and biotin re-feeding did not affect the total number of ovulated oocytes or dead oocytes.
Effect of biotin deficiency and re-feeding on the lipid droplets in oocytes
Fig. 2 shows the intensity of lipid droplets in oocytes on days 22, 43, and 64. The intensity of lipid droplets in oocytes in BD1 and 2 groups was 65.2% and 46.9% compared to the Ct1 and 2 groups, respectively (Fig. 2A and B). The quantity of lipid droplets in the BD2 group, which had been fed the BD diet for 43 days, decreased to less than half that of the Ct2 group.
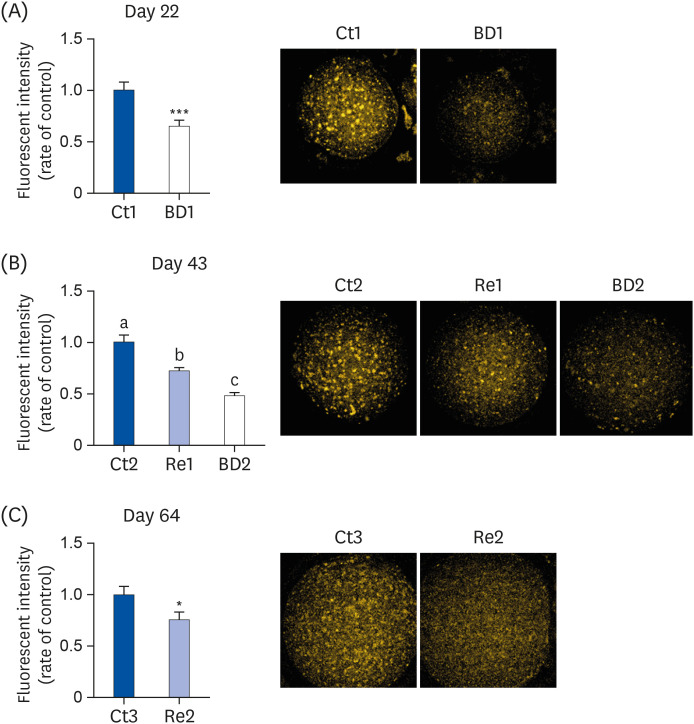 | Fig. 2Lipid droplet levels in oocytes on days 22, 43, and 64. The oocytes were stained with Nile Red, and the lipid droplets in oocytes were detected using confocal fluorescence microscopy on days 22 (A), 43 (B), and 64 (C). Dots of orange are lipid droplets in the oocyte (right panels). The bar graphs show the fluorescence intensity of oocytes in the Ct group (blue bar), the BD group (white bar), and the Re group (light blue bar). Ct1, 2 and 3 group, n = 32, 82, and 16, on days 22, 43, and 64, respectively; BD1 and 2 group, n = 39 and 57 on days 22 and 43, respectively; Re1 and 2 group, n = 62 and 27 on days 43 and 64, respectively. Values are means ± SE. The data on days 22 and 64 were analyzed using the Student's t-test. The data on day 43 were analyzed by 1-way analysis of variance. A different letter means a significant difference at P < 0.05.Ct group, control group; BD group, biotin deficient group; Re group, recovery group.
*P < 0.05, ***P < 0.001.
|
The intensity of lipid droplets in the oocytes in the Re1 and 2 groups was 71.3% and 75.7% of the Ct2 and 3 groups, respectively (Fig. 2B and C). The intensity of lipid droplets in oocytes in the Re1 group was higher than the BD2 group but lower than the Ct2 group. Although the Re2 group was fed the control diet for 42 days, the intensity of lipid droplets in the oocytes of the Re2 group had not recovered completely by day 64.
Effect of a biotin deficiency and re-feeding on the mitochondrial function in oocytes
JC-1 staining is used widely in apoptosis studies to monitor mitochondrial health. Fig. 3 shows the mitochondrial membrane potential in oocytes on days 22, 43, and 64. A decrease in the red/green fluorescence ratio indicates mitochondrial depolarization. The red/green fluorescence ratio was significantly lower in the oocytes of the BD1 and 2 groups on days 22 and 43 than the Ct groups (Fig. 3B and C).
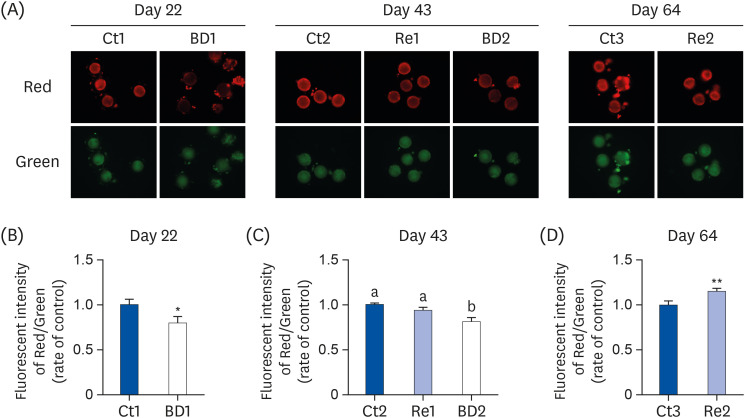 | Fig. 3Mitochondrial membrane potential in oocytes on days 22, 43, and 64. The oocytes from each group were stained with JC-1 (A). The mitochondrial membrane potential was calculated as the ratio of red fluorescence (corresponding to active mitochondria) to green fluorescence (corresponding to mitochondria with lower activity), on days 22 (B), 43 (C), and 64 (D). The bar graphs show the fluorescence intensity of oocytes in the Ct group (blue bar), the BD group (white bar), and the Re group (light blue bar). C1,2 and 3group, n = 19, 67, and 13 on days 22, 43, 64, respectively; BD1 and 2 group, n = 28 and 36 on days 22 and 43, respectively; Re 11 and 2 group, n = 33 and 25 on days 43 and 64, respectively. The values are the means ± SE. The data on days 22 and 64 were analyzed using the Student's t-test. The data on day 43 were analyzed by 1-way analysis of variance. A different letter means a significant difference at P < 0.05.Ct group, control group; BD group, biotin deficient group; Re group, recovery group.
*P < 0.05, **P < 0.01.
|
The red/green fluorescence intensities were similar in the Ct2 and Re1 group on day 43 (Fig. 3C). This suggests that the mitochondrial membrane potential in the oocytes was restored by re-feeding biotin for 21 days. On day 64, the red/green fluorescence intensity was increased 1.15-times in the Re2 group compared with that in the Ct3 group (Fig. 3D).
Effect of a biotin deficiency and re-feeding on the phosphorylation of ACC in ovaries
Fig. 4 shows the phosphorylated ACC (p-ACC)/ACC rates on days 22, 43, and 64. The level of p-ACC was 1.8- to 1.9-fold higher in the BD1 and BD2 groups than the Ct1 and Ct2 groups on days 22 and 43, but these differences were not significant. The p-ACC/ACC rates in the Re1 and 2 groups were restored to the same level as the Ct2 and 3 groups on days 43 and 64.
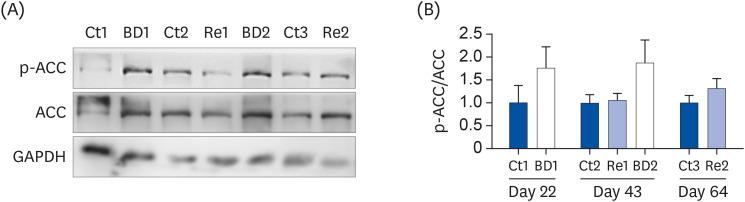 | Fig. 4p-ACC levels in ovaries. ACC, p-ACC, and GAPDH protein expression in the ovaries were analyzed by Western blotting (A). The data intensity of each band was quantified using ImageJ software, and the level of expression of p-ACC was normalized to the ACC level (B). The bar graphs show the p-ACC/ACC rate in the ovaries of mice in the Ct group (blue bar), the BD group (white bar), and the Re group (light blue bar). The values are the means ± SE, n = 3 to 4/group. The data on days 22 and 64 were analyzed using the Student's t-test. The data on day 43 were analyzed using 1-way analysis of variance. A different letter means a significant difference at P < 0.05.p-ACC, phosphorylated ACC; ACC, acetyl CoA carboxylase; GAPDH, glyceraldehyde-3-phosphate dehydrogenase; Ct group, control group; BD group, biotin deficient group; Re group, recovery group.
|
Effect on biotin coenzyme gene expression in ovaries
Biotin is associated as a coenzyme with ACC, PC, PCC, and MCC. The expression of the Acc1 and Pcc1 genes was decreased in the BD1 group (Fig. 5A and C). The Acc1 gene expression levels tended to increase in the Re1 group, but the gene expression levels were still lower than in the Ct2 group. On day 64, the Acc1 and Pcc1 gene expression levels were restored completely in the Re2 group compared to the level in the Ct3 group. The Pc and Mcc1 expression levels in the BD1 group were unchanged on day 22; however, Pc gene expression levels were increased in the BD2 group, and the Mcc1 gene expression levels were decreased (Fig. 5B and D).
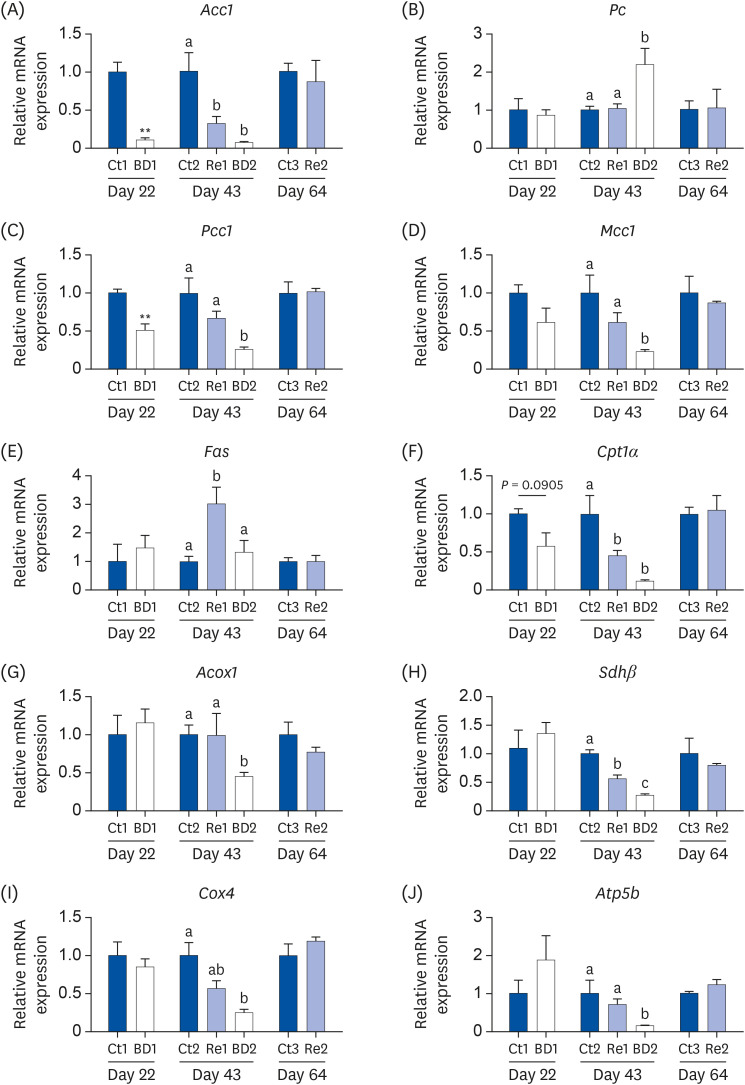 | Fig. 5Gene expression related to biotin-dependent enzymes, lipogenesis metabolism, and energy metabolism in the ovaries on days 22, 43, and 64. The mRNA levels of Acc1, Pc, Pcc1, and Mcc1 (A-D) were analyzed as the biotin-dependent enzymes, mRNAs of Fas (E) as a marker for lipogenesis, of Cpt1α (F) and Acox1 (G) for fatty acid β-oxidation, and Shdβ, Cox4, and Atp5b (H-J) for the energy metabolism. The bar graphs show the gene expression levels in the ovaries of the mice in the Ct group (blue bar), the BD group (white bar), and the Re group (light blue bar). The values are the means ± SE, n = 3 to 4/group. The data on days 22 and 64 were analyzed using the Student's t-test. The data on day 43 were analyzed by 1-way analysis of variance. A different letter means a significant difference at P < 0.05.mRNA, messenger RNA; Acc1, acetyl-CoA carboxylase 1; Pc, pyruvate carboxylase; Pcc1, propionyl-CoA carboxylase 1; Mcc1, β-methylcrotonyl-CoA carboxylase 1; Fas, fatty acid synthase; Cpt1α, carnitine palmitoyl transferase 1α; Acox1, peroxisomal acyl-CoA oxidase 1; Sdhβ, succinate dehydrogenase β; Cox4, cytochrome c oxidase 4; Ct group, control group; BD group, biotin deficient group; Re group, recovery group.
**P < 0.01.
|
Effect on lipid metabolism gene expression in the ovaries
FAS, CPT1α, and ACOX are associated with the lipid metabolism. FAS is a marker of lipogenesis. A biotin deficiency did not affect the Fas expression level, but its expression level was increased by biotin re-feeding on day 43 (Fig. 5E). CPT1α and ACOX are markers of fatty acid β-oxidation. The Cpt1α expression level decreased in the BD1 group on day 22, but this decrease was not significant (P = 0.0905 vs. Ct1 group, Fig. 5F). Cpt1α expression was significantly lower in the Re1 and BD2 groups than in the Ct2 group on day 43; its expression in the recovery group was restored by day 64. The Acox1 expression levels were only decreased in the BD2 group (Fig. 5G).
Effect on energy metabolism gene expression in ovaries
SDHβ, COX4, and ATP5B are associated with the energy metabolism. SDHβ is an enzyme that metabolizes succinate to fumarate. This metabolic pathway forms part of the tricarboxylic acid (TCA) cycle. COX4 is part of the mitochondrial complex and the main oxygen-metabolizing enzyme. The expression of the COX4 protein was decreased in human lung fibroblasts treated for a biotin deficiency [29]. The expression of Sdhβ, Cox4, and Atp5b was decreased in the BD2 group compared to the Ct2 group on day 43 (Fig. 5H, I, and J). The Sdhβ and Cox4 expression levels were lower in the Re1 group than in the Ct2 group. On the other hand, the Sdhβ expression levels tended to recover. By day 64, the Cox4 and Atp5 expression levels had been restored.
Effect of long-term re-feeding of biotin on oocyte quality
The frequency of abnormal oocytes was examined on day 64 to reveal the long-term effect of biotin re-feeding on oocyte quality. Oocytes with spindle defects, chromosomal misalignment, or immature oocytes (GV stage oocytes) were observed frequently in the Re2 group (Fig. 6A). The percentage of abnormal oocytes to total oocytes was significantly higher in the Re2 group than in the Ct3 group (Fig. 6B, Ct3 group; 28.5%, Re2 group; 58.8, P < 0.001).
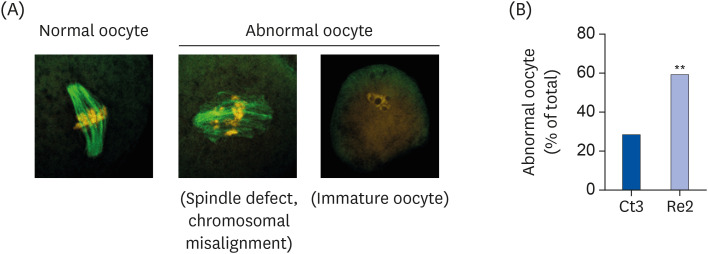 | Fig. 6Frequency of abnormal oocytes on day 64. Tubulin and chromosomes were stained using an immunofluorescence stain and propidium iodide. The oocytes were classified as normal oocytes or abnormal oocytes (the latter includes those oocytes with spindle defects, chromosomal misalignments, or were immature) (A). The percentage of abnormal oocytes was calculated by division (number of abnormal oocytes/number of total oocytes × 100) (B). The bar graphs show the percentage of abnormal oocytes in mice of the Ct group (blue bar) and the Re group (light blue bar). Ct3 group, n = 42; Re2 group, n = 51. The oocytes were collected from 3 to 4 mice in each group. Data were analyzed using the χ2 test.Ct group, control group; Re group, recovery group.
**P < 0.01.
|
Go to :
DISCUSSION
Biotin is involved in fatty acid synthesis, gluconeogenesis, odd-chain fatty acid metabolism, and branched-chain amino acid catabolism. Biotin functions as a coenzyme for the following 4 carboxylases: ACC, PC, PCC, and MCC. Biotin has a wide range of effects on systemic processes, such as metabolism, embryo development [3031], growth [32], and immunity [33]. The estrous cycle becomes arrested, and the number of follicles decreases in mice fed biotin-deficient diets for 8 weeks [23]. A biotin deficiency during pregnancy induces fetal body weight loss and an increase in teratogenesis in animals [3134]. The biotin nutrient status affects the reproductive system in female animals.
Alopecia is a well-known sign of biotin deficiency. In the present study, no animals exhibited alopecia by day 22. On the other hand, the biotin concentration in the liver was markedly lower in the BD mice than the control mice at this stage. This suggested that on day 22, the nutritional status of the BD1 mice was “potential biotin deficiency.” By contrast, on day 43, alopecia was observed in almost all mice in the BD2 group. This suggested that on day 43, the nutritional status of the BD2 mice was “manifest biotin deficiency.” Germ-free rats fed a biotin-free diet began to lose weight and present with the clinical symptoms of biotin deficiency starting at 3 months, including alopecia, spectacle eyes, and open ulcers on the shoulders, head, and ears, and the rats died at 5 months [35]. In the present study, alopecia was observed in the BD mice on day 29. The concern was that the BD mice would die if allowed to continue on a biotin-free diet to day 64. Therefore, a BD3 group was not assessed out of consideration for animal welfare and lack of necessity.
Oocyte fatty acids are obtained by intracellular synthesis and transportation from the extracellular environment across the cell membrane [10]. Fatty acid synthesis is inhibited by increasing the p-ACC levels in the liver via the 5′-adenosine monophosphate-activated protein kinase (AMPK) signaling pathway [1636]. The biotin concentrations in the liver decreased markedly in the BD1 and BD2 groups compared to each respective control group. A decrease in ACC activity due to a biotin deficiency leads to a decrease in the malonyl-CoA levels in the liver. Malonyl-CoA regulates the CPT1α activity, and the CPT1α activity is increased in the BD mice in response to a decrease in malonyl-CoA [1437], which promotes TG degradation and fatty acid oxidation. The plasma TG concentrations decreased in the biotin-deficient animals, and the p-ACC and p-AMPK levels increased in the liver [14]. A decrease in oocyte lipid droplets and TG plasma levels results in an increase in p-ACC levels in potential BD mice (BD1 group). These results suggest that lipid synthesis was suppressed by the increased phosphorylation observed for the AMPK/ACC pathway in the liver, ovaries, and oocytes. The supply of extracellular TGs and intracellular oocyte fatty acid synthesis are both reduced during potential biotin deficiency. As a result, the levels of lipid droplets in oocytes were decreased. On the other hand, this study did not measure p-ACC expression in oocytes directly, which is one of the limitations of the study.
Many reports have described the effects of a biotin deficiency on the metabolism, pregnancy, and embryo development in animals. On the other hand, few studies examined the effects of replenishing biotin to BD animals. The effects of the biotin nutrient status (i.e., urinary excretion of biotin and liver concentration of biotin) were ameliorated in the Re2 mice. The quantity of lipid droplets in oocytes increased in the Re1 group compared to the BD group. On the other hand, after biotin replenishment, the levels of lipid droplets were not restored completely compared to the Ct mice. In addition, the plasma TG concentration tended to be lower in the Re1 mice than the control mice. Fatty acid synthesis was increased, and β-oxidation was suppressed in the ovaries from the Re1 mice. These results suggest that a temporary gap exists between the restitution of the biotin nutritional status and the functional biotin nutrient status (i.e., regulation of biotin-dependent gene expression and fatty acid metabolism).
This study examined the changes in gene expression related to biotin-dependent enzymes, as well as fatty acid and energy metabolism, to clarify the molecular effects of biotin nutritional status. In human cells, the expression of the Acc1 and Pcc1 mRNAs and COX4 protein was reported to be suppressed by biotin deficiency [1529]. To the best of the authors' knowledge, there are no reports on the effects of a biotin deficiency on Sdhβ, Acox1, Cox4, and Atp5b gene expression. A decrease in Acc1, Pcc1, and Cox4 gene expression was also observed in BD mice. Furthermore, the gene expression levels of Cpt1α, Acox1, Sdhβ, Cox4, and Atp5b, which are all related to the β-oxidation and energy metabolism, were all markedly lower in the mice with a manifest biotin deficiency (BD2 group), but not the potential biotin deficiency (BD1 group). Aggravation of a biotin deficiency also manifested itself as changes in gene expression associated with β-oxidation and the energy metabolism.
The Cpt1α mRNA level was increased in the BD animals [14]. Interestingly, ovarian Cpt1α gene expression was significantly lower (or showed a lower tendency) in the BD1, BD2, and Re1 groups than the control group. Follicle-stimulating hormone (FSH) increases Cpt1α mRNA expression [38]. PMSG and hCG were injected into the peritoneal cavity of mice to collect oocytes. PMSG and hCG act as FSH for ovaries. Thus, Cpt1α expression in Ct mice might be elevated by hormone stimulation. The concentration of ketone bodies increased in both liver and plasma in BD mice [39]. The increased expression of Cpt1α mRNA in the BD groups was inhibited by ketone bodies because Cpt1α mRNA expression is suppressed in severe ketosis animals [40]. ACC synthesizes malonyl-CoA from acetyl-CoA to produce fatty acids. In Re1 mice, the Malonyl-CoA level was increased in the ovaries by the replenishment of biotin because Cpt1α mRNA expression is suppressed by malonyl-CoA [35].
A previous study reported that the number of oocytes containing spindle defects increased in BD mice [7]. The oocyte damage was not repaired in the BD mice when their diet was replenished with biotin for 20 days [7]. The detailed mechanism of oocyte meiosis failure induced by a biotin deficiency is unclear. This study tested whether increasing the biotin replenishment period to 42 days repaired the oocyte damage induced by a biotin deficiency. Furthermore, oocyte meiosis failure induced by a biotin deficiency was not restored, even though the biotin administration period was extended. Oocyte meiosis failure is induced by various factors, such as oxidative stress, mitochondrial dysfunction, and energy defects [19]. For oocyte maturation and embryo development, lipid and β-oxidation play an important role, e.g., as an energy source [41] and signaling for the resumption of meiosis [8]. Energy deficiency and mitochondrial dysfunction can result in abnormal meiosis, such as spindle defects [19]. Biotin is a coenzyme for ACC and regulates ACC expression [15]. ACC metabolizes acetyl-CoA to malonyl-CoA, which is a fatty acid component. Fatty acids, in turn, are components of TG. Lipid droplets contain TG, cholesterol esters, and other lipid macromolecules [9]. Biotin is essential for lipid droplet synthesis, and the low biotin concentration decreases lipid droplet formation within the cells [184243]. Furthermore, a biotin deficiency impairs the TCA cycle because biotin is a coenzyme for PC, which metabolizes pyruvic acid to oxaloacetic acid [44]. The inhibition of fatty acid synthesis, β-oxidation, and metabolic energy confusion contributes to oocyte meiosis failure in BD mice. Biotin may play a role in energy accumulation as lipid droplets and the smooth provision of energy to complete normal oocyte meiosis. On the other hand, the data did not show directly that changes in the lipid droplet levels were linked mechanistically to oocyte abnormalities. Further studies will be needed to understand the relationship between biotin and oocyte meiosis better.
Elevation of the reactive oxygen species (ROS) levels and a reduced mitochondrial membrane potential are observed frequently in oocytes exhibiting abnormal meiosis [1945]. In mice exposed to oxidative stress by eating a high-fat diet, the oxidative stress-induced oocyte spindle defects and reduction in mitochondrial membrane potential reportedly were irreversible, despite the reversal of the metabolic parameters by changing to a normal diet [46]. In the present study, the mitochondrial membrane potential was recovered in the Re2 mice, and the oocyte ROS levels were not elevated (data not shown). Therefore, the contribution of oxidative stress to oocyte meiosis failure induced by a biotin deficiency may be minimal.
A biotin deficiency had long-term effects on lipid droplets and meiosis in oocytes. Lipid droplet products are derived from the endoplasmic reticulum [47]. Lipid droplet proteins, various types of phospholipids found on the lipid droplet membrane, the phosphatidylcholine/TG ratio, and the types of fatty acid in lipid droplets help regulate the lipid droplet size [484950]. The components of saturated and unsaturated fatty acids change, and the palmitate concentrations are increased in biotin-deficient chicks [51]. Palmitate increases the phosphatidylcholine contents in the lipid droplet membrane [50]. Lipid droplets fuse and became more prone to enlargement when the phosphatidylcholine/TG ratio decreases [49]. The inhibition of lipogenesis caused by a biotin deficiency may affect regulatory mechanisms or phospholipid compositions irreversibly. As a result, oocytes exposed to a biotin deficiency cannot accumulate TGs into the lipid droplets. The observed reduction in lipid droplets was associated with oocyte meiosis failure caused by a biotin deficiency. In addition, the biotinylation of K16 in histone H4 plays roles in DNA repair in human cells and Drosophila melanogaster [5152]. DNA damage in oocytes induces oocyte meiotic failure. Further research will be needed to elucidate the role of biotin in lipid droplets and oocyte meiosis.
Go to :
 XML Download