

 PDF
PDF Citation
 Print
Print


INTRODUCTION
Apoptosis, a type of programmed cell death, can mechanistically be divided into the intrinsic and extrinsic pathways [12]. The intrinsic pathway occurs as a consequence of increased mitochondrial permeability, via activation of caspase-9 subsequent to the cytosolic release of apoptosis-inducing proteins (including cytochrome c) present in the space between the outer and inner mitochondrial membranes. The extrinsic pathway involves the activation of caspase-8 following the binding of death ligands to death receptors (DRs) present on the cell membrane surface [23]. Activated caspase-9 and caspase-8, function as intrinsic and extrinsic initiator caspases, respectively, and induce the activation of downstream caspases (such as caspase-7 and caspase-3), ultimately leading to apoptosis through degradation of cell matrix proteins. In addition, the intrinsic pathway is strictly regulated by the Bcl-2 protein family proteins that contribute to the regulation of mitochondrial integrity [45].
Apoptosis is also exquisitely regulated by multiple intracellular signaling pathways. Among these, the phosphoinositide 3-kinase (PI3K)/Akt pathway is precisely involved in several processes including cell proliferation, differentiation, and apoptosis [678]. Moreover, reactive oxygen species (ROS) play important roles as intracellular signaling molecules under normal conditions, but aberrant accumulation of excessive ROS induces oxidative stress in cells and promotes apoptosis [910]. Numerous earlier studies have reported that inactivation of the PI3K/Akt signaling pathway is associated with excessive ROS production [111213]. Therefore, these observations indicate that blocking the PI3K/Akt signaling pathway while promoting ROS production may be an attractive approach to induce apoptosis in cancer cells.
Zanthoxylum schinifolium Sieb. et Zucc. belongs to the genus Zanthoxylum. It is a widely used seasoning in East Asian countries, including Korea. Z. schinifolium is also prescribed as a herbal medicine in traditional practice to treat several symptoms [141516]. To corroborate these applications, a number of pharmacological activities of the plant have been reported, which include anti-viral, anti-obesity, antioxidant, immunostimulatory, and anti-inflammatory effects [1517181920212223]. Although recent studies show that Z. schinifolium exerts antitumor effects on human cancer cells [24252627], the underlying mechanisms have not been clearly elucidated. Therefore, the current study was undertaken to investigate the effect of ethanol extracts of Z. schinifolium (EEZS) leaves on apoptosis in human bladder cancer T24 cells.
Go to : 
MATERIALS AND METHODS
Preparation of EEZS
EEZS was extracted as described previously [19]. Briefly, 80 g finely powdered dried leaves of Z. schinifolium were soaked in 1,500 mL 100% ethanol for 48 h. The liquid extract was then filtered using filter paper (Whatman No. 4, Whatman International Ltd., Maidstone, UK) to remove debris, concentrated with a rotary evaporator (N-1000S-W, EYELA, Bohemia, NY, USA), freeze-dried, and stored at −80°C until use in experiments. The lyophilized ethanol extract powder (EEZS) was dissolved in dimethyl sulfoxide (DMSO; Thermo Fisher Scientific, Waltham, MA, USA) to prepare a stock solution (200 mg/mL), and diluted to the appropriate concentrations with culture medium before adding to cells.
Cell culture
T24 cells (HTB-4™), a cell line established from a human urinary bladder cancer patient, were obtained from the American Type Culture Collection (Manassas, VA, USA) and maintained in RPMI 1640 medium supplemented with 10% fetal bovine serum and antibiotics (WelGENE Inc., Gyeongsan, Korea), at 37°C in a humidified 5% CO2 atmosphere.
Cell viability assay
Cell viability was determined by performing the 3-(4,5-dimethylthiazol-2-yl)-2,5-diphenyltetra-zolium bromide (MTT) assay. Briefly, T24 cells were seeded at a density of 1.5 × 10⁵ cells per well in 6-well plates. After 24 h incubation, cells were treated with different concentrations of EEZS for 48 h, in the presence or absence of necrostain-1 (NEC; Sigma-Aldrich Chemical Co., St. Louis, MO, USA), carbobenzoxy-valyl-alanyl-aspartyl-[O-methyl]-fluoromethylketone (z-VAD-fmk; Cell Signaling Technology, Danvers, MA, USA), LY294002 (Cell Signaling Technology), or N-acetyl-L-cysteine (NAC, Sigma-Aldrich Chemical Co.). The treated cells were subsequently incubated in a medium containing 50 μg/mL MTT solution (Thermo Fisher Scientific), as described previously [28]. After 2 h incubation, the medium was discarded and DMSO was added, followed by gentle shaking for 10 min at room temperature (RT). The dissolved formazan was transferred to 96-well plates, and the absorbance was compared at 540 nm using a microplate reader (Beckman Coulter Inc., Brea, CA, USA). Changes in cell morphology were simultaneously observed by phase-contrast microscopy (Carl Zeiss, Oberkochen, Germany). The final DMSO concentration was maintained at non-toxic levels of < 0.05%.
Observation of apoptotic morphological changes
Morphological changes of the nucleus were investigated by applying the 4',6'-diamidino-2-phenylindole (DAPI) staining [28]. Briefly, T24 cells cultured in normal medium or medium containing 300 μg/mL of EEZS for 48 h were washed with phosphate buffered saline (PBS), followed by fixation with 4.0% paraformaldehyde (Sigma-Aldrich Chemical Co.) for 10 min at RT. The fixed cells were then stained with 1 μg/mL DAPI solution (Sigma-Aldrich Chemical Co.) in the dark for 10 min, and subsequently washed with PBS, after which the nuclear fluorescence was observed by fluorescence microscopy (Carl Zeiss).
Assessment of apoptosis by flow cytometer
To analyze the degree of apoptosis, the cells treated with EEZS in the presence or absence of NEC, LY294002 or NAC for 48 h, were washed with PBS and then double-stained with fluorescein isothiocyanate (FITC)-conjugated annexin V and propidium iodine (PI) (Becton Dickinson, San Jose, CA, USA) for 20 min, according to the manufacturer’s protocol. Subsequently, the stained cells were measured using a Muse® Cell Analyzer (Merck Millipore, Darmstadt, Germany) at the Core-Facility Center for Tissue Regeneration, Dong-eui University (Busan, Korea). The apoptosis rate (%) was determined as the ratio of number of annexin V positive cells to the total number of cells observed, as previously described [29].
Protein extraction and Western blot analysis
For Western blot analysis, total protein was extracted from cells cultured under various conditions, following a previously described protocol [30]. Cytoplasmic and mitochondrial proteins were simultaneously extracted using a mitochondrial isolation kit purchased from Active Motif (Carlsbad, CA, USA), according to the manufacturer’s protocol. Equal amounts of proteins from individual lysates were separated by electrophoresis using sodium-dodecyl sulfate polyacrylamide gels, and subsequently transferred to polyvinylidene difluoride membranes (Schleicher & Schuell, Keene, NH, USA). After blocking the membrane with 3% bovine serum albumin for 30 min at RT, primary antibodies (Cell Signaling Technology, Inc., Danvers, MA, USA and Santa Cruz Biotechnology, Inc., Santa Cruz, CA, USA) were added to the membranes, incubated overnight at 4°C, and subsequently probed with horseradish peroxidase-conjugated secondary antibodies (sc2004, goat anti-rabbit immunoglobulin [Ig] G; sc2005, goat anti-mouse IgG; Santa Cruz Biotechnology, Inc.) for 2 h at RT. Finally, enhanced chemiluminescent reagent (Amersham Biosciences Corp., Amersham, UK) was used to visualize the proteins of interest. The primary antibodies against DR4 (sc-8411), DR5 (sc-57086), tumor necrosis factor-related apoptosis-inducing ligand (TRAIL, sc-6079), Fas (sc-715), Fas-ligand (FasL, sc-957), caspase-8 (sc-56070), caspase-9 (sc-7885), caspase-3 (sc-7148), poly (ADP-ribose) polymerase (PARP, sc-8007), Bax (sc-7480), Bcl-2 (sc-7382), Bid (sc-514622), cytochrome c (sc-7159), cytochrome oxidase subunit 4 (COX IV, sc-23,986), phosphorylated Akt (p-Akt, sc-101629), Akt (sc-8312), and actin (sc-7210) were purchased from Santa Cruz Biotechnology, Inc. (Santa Cruz, CA, USA). Anti-p-PI3K (4228S) and PI3K (4292S) were procured from Cell Signaling Technology.
Assay of caspase activity
Proteolytic cleavage of fluorescent substrates was measured to detect the activity of caspases, using the caspase colorimetric assay kits purchased from R&D Systems (Minneapolis, MN, USA). Briefly, cells were treated with the indicated concentrations of EEZS in the presence or absence of z-VAD-fmk for 48 h. Treated cells were subsequently lysed using the provided lysis buffer, and the resultant supernatants were reacted with the supplied reaction buffer for 2 h at 37°C. Optical density values of the reaction mixtures of each sample were then detected at 405 nm using a microplate reader, and are presented as relative values [31].
Measurement of mitochondrial membrane potential (MMP)
To measure the MMP, 5,5′,6,6′-tetrachloro-1,1′,3,3′-tetramethyl-imidacarbocyanine iodide (JC-1) staining was performed. Briefly, cells exposed to various concentrations of EEZS were stained with 10 μM JC-1 (Invitrogen, Carlsbad, CA, USA) for 30 min at 37°C, according to the manufacturer’s protocol. After washing the cells with PBS, MMP values were determined at 488/575 nm by flow cytometry [32]. Subsequent to JC-1 staining, cells were subjected to DAPI for staining the nuclei. MMP depletion was also observed under a fluorescence microscope.
Determination of ROS generation
The amount of ROS produced in the cells was measured by applying the 2′,7′-dichlorofluorescin-diacetate (DCF-DA) reagent, as previously described [33]. Cells treated with EEZS in the presence or absence of ROS scavenger (NAC) were reacted with 10 μM DCF-DA (Invitrogen) for 20 min. Immediately after the reaction, the levels of ROS production in each sample were analyzed by flow cytometry at 480/520 nm. DCF-DA-stained cells were also observed by fluorescence microscopy (Carl Zeiss).
Statistical analysis
GraphPad Prism 5.03 statistical software (GraphPad Software, Inc., La Jolla, CA, USA) was applied for statistical analysis. All experimental values are presented as mean ± SD. Statistical analysis examined differences between groups through a one-way analysis of variance followed by Tukey’s post-test, and P-values < 0.05 are considered to represent a statistically significant difference.
Go to :
RESULTS
Effect of EEZS on cell viability of T24 cells
To assess the cytotoxicity of EEZS, we measured the cell viability of T24 cells treated with various concentrations of EEZS for 48 h by applying the MTT assay. As presented in Fig. 1A, treatment concentrations less than 50 μg/mL showed no effect on the cell viability, whereas treatment with EEZS over 100 μg/mL significantly reduced the cell viability, as compared to the control group. Cells exposed to 200 μg/mL and 300 μg/mL EEZS showed inhibition of cell viability by more than 30% and 50%, respectively. In addition, increasing concentrations of EEZS showed further reduction in the cell density, as well as increasing numbers of irregularly outlined cells and isolated cells. As an example, comparative images of cells treated with 300 μg/mL EEZS and the control group are presented in Fig. 1B.
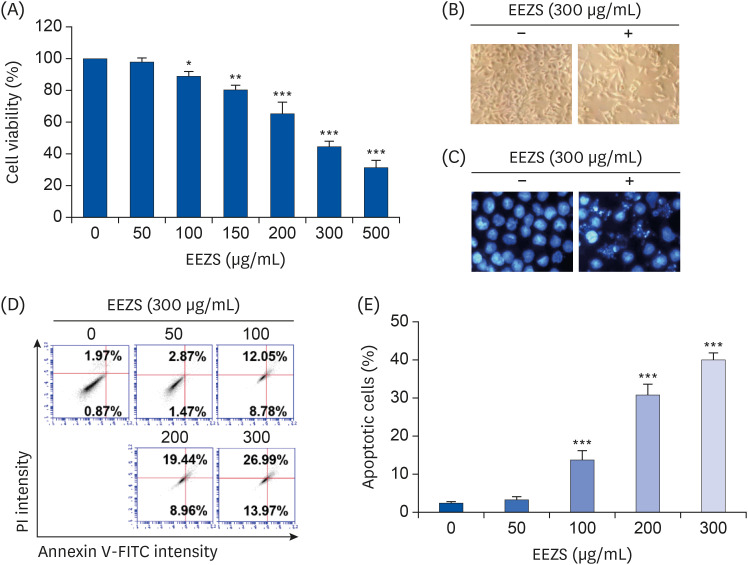 | Fig. 1Inhibition of cell survival and induction of apoptosis by EEZS in T24 cells. Cells were cultured for 48 h in medium containing the indicated concentrations of EEZS. (A) Cell viability was measured by MTT assay. (B) Morphological changes were observed with a phase-contrast microscope. (C) Nuclear morphological changes were observed under a fluorescence microscope using DAPI staining. (D) Flow cytometry analysis using annexin V/PI double staining was applied to measure the degree of apoptosis in T24 cells after EEZS treatment. (E) Statistical analysis of apoptotic cell population. The percentage of cells undergoing apoptosis is expressed as the percentage of the number of annexin V-positive cells using a flow cytometer. Data are expressed as the mean ± SD.EEZS, ethanol extracts of Z. schinifolium leaves; FITC, fluorescein isothiocyanate; PI, propidium iodine; MTT, 3-(4,5-dimethylthiazol-2-yl)-2,5-diphenyltetra-zolium bromide; DAPI, 4′,6′-diamidino-2-phenylindole.
*P < 0.05, **P < 0.01 and ***P < 0.001 vs. untreated cells.
|
EEZs induces apoptosis in T24 cells
We next examined whether EEZS-induced T24 cell growth inhibition is associated with the induction of apoptosis. DAPI stained EEZS-treated cells showed condensed and markedly fragmented nuclei in a concentration-dependent manner (Fig. 1C). Similarly, the annexin V/PI double staining also indicates that exposure to EEZS concentration-dependently increases the frequency of apoptosis-induced cells (Fig. 1D and E). Next, to determine whether necrosis is involved in the cytotoxicity of EEZS, T24 cells were pre-treated with or without 200 μM NEC for 1 h, and subsequently exposed to 300 μg/mL of EEZS (which inhibits cell viability by about 50%) for 48 h. As shown in Fig. 2, pretreatment with NEC, an inhibitor of necrosis, does not diminish the EEZS-mediated cell viability reduction and apoptosis induction, thereby indicating that exposure to EEZS induces apoptosis, but not necrosis.
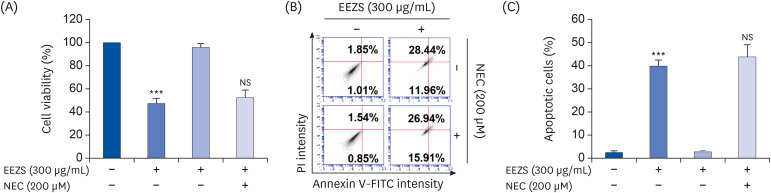 | Fig. 2Effect of necrostain-1, an inhibitor of necrosis, on decreased cell viability and increased apoptosis by EEZS in T24 cells. Cells were pre-treated with 200 μM NEC for 1 h, after which they were exposed to 300 μg/mL EEZS for 48 h. MTT assay (A) and flow cytometry analysis (B and C) were subsequently conducted. Data are expressed as the mean ± SD (n = 3).EEZS, ethanol extracts of Z. schinifolium leaves; NEC, necrostain-1; FITC, fluorescein isothiocyanate; PI, propidium iodine; MTT, 3-(4,5-dimethylthiazol-2-yl)-2,5-diphenyltetra-zolium bromide.
***P < 0.001 vs. untreated cells; NS, not significant vs. 300 μg/mL EEZS-treated cells.
|
Effect of EEZS on the expression of DR-mediated proteins and activity of caspases in T24 cells
We next examined whether the DR-related family proteins are involved in EEZS-induced apoptosis, and found that the expressions of Fas and Fas ligand (FasL) were concentration-dependently upregulated in response to EEZS treatment. However, the expressions of DRs and TRAIL were not altered significantly, as compared to the controls (Fig. 3A). We also determined that EEZS induces expressions of the active forms of caspase-3, -8 and -9, and results in cleavage of PARP, a substrate protein degraded by the activated effector caspases (Fig. 3B). Consistent with the results of Western blot analysis, the activities of caspases were also concentration-dependently and significantly increased after EEZS exposure (Fig. 3C). To further investigate whether EEZS-induced apoptosis is caspase-dependent, cells were pre-treated to a pan-caspase inhibitor, z-VAD-fmk. As presented in Fig. 3D, pre-treatment with z-VAD-fmk significantly rescues the cell viability in EEZS-treated cells.
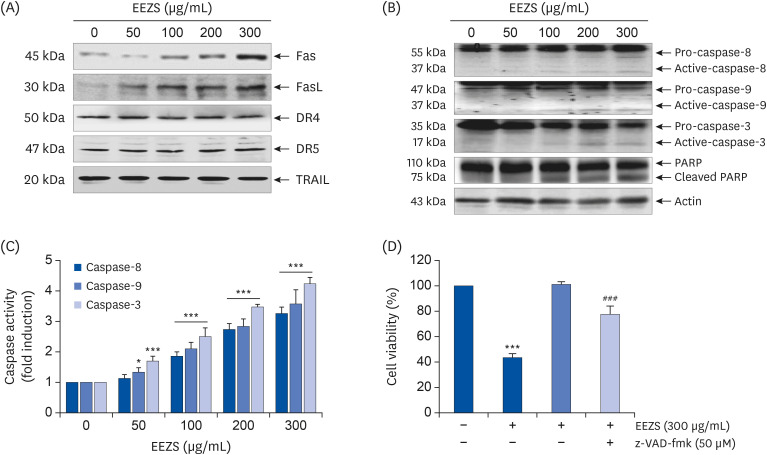 | Fig. 3Induction of Fas and FasL expression, and activation of caspases by EEZS in T24 cells. (A-C) Cells were cultured in media containing various concentrations of EEZS for 48 h. (A and B) Western blot analysis of indicated proteins. Actin was used as a control for protein loading. (C) The caspase activities in each sample were measured using caspase assay kits. (D) Cells were treated with 300 μg/mL EEZS for 48 h, with or without 50 μM z-VAD-fmk for 1 h. Cell viability was measured by the MTT assay. (C and D) Data are expressed as the mean ± SD.EEZS, ethanol extracts of Z. schinifolium leaves; FasL, Fas ligand; DR, death receptor; TRAIL, tumor necrosis factor-related apoptosis-inducing ligand; PARP, poly (ADP-ribose) polymerase; z-VAD-fmk, carbobenzoxy-valyl-alanyl-aspartyl-[O-methyl]-fluoromethylketone; MTT, 3-(4,5-dimethylthiazol-2-yl)-2,5-diphenyltetra-zolium bromide.
*P < 0.05 and ***P < 0.001 vs. untreated cells. ###P < 0.001 vs. 300 μg/mL EEZS-treated cells.
|
EEZS regulates the levels of Bcl-2 family protein and increase mitochondrial dysfunction in T24 cells
We further investigated the MMP and mitochondrial pathway-related proteins in EEZS-treated cells. As shown in Fig. 4A, EEZS treatment downregulates the expression of anti-apoptotic Bcl-2 protein, but upregulates the expression of the apoptosis-promoting Bax protein. In addition, increased expressions of the truncated form of Bid (tBid) and cytochrome c in the cytoplasm were promoted in EEZS-stimulated cells (Fig. 4B). Furthermore, EEZS triggered a concentration-dependent loss of MMP in comparison to untreated controls (Fig. 4C). In good agreement with the results of flow cytometry, the results of fluorescence microscopy revealed that EEZS-treated T24 cells display markedly reduced MMP as compared to untreated cells, as evidenced by decreased and increased red and green JC-1 fluorescence, respectively (Fig. 4D).
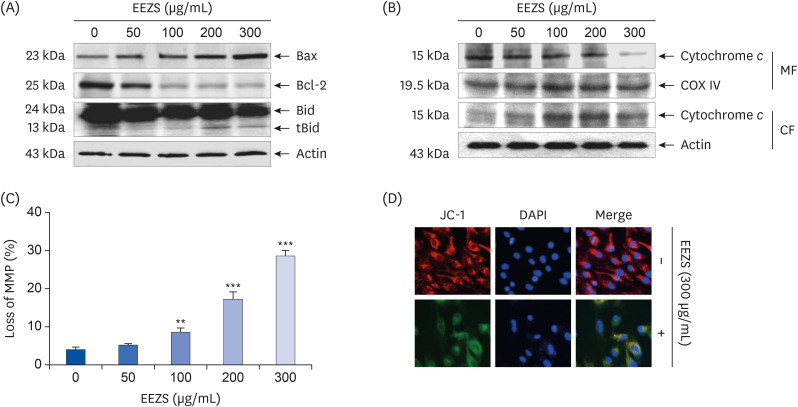 | Fig. 4Regulation of expression of Bcl-2 family proteins, cytosolic release of cytochrome c, and loss of MMP after EEZS exposure in T24 cells. Cells were cultured for 48 h in medium containing the indicated concentrations of EEZS. (A) Western blot analysis of Bcl-2 family proteins. Actin was used as a control for protein loading. (B) Mitochondrial and cytosolic fractions were extracted from cells, and cytochrome c expression was analyzed by Western blot analysis. The expression of COX VI and actin in each protein extract was used as a control for protein loading. (C) JC-1-stained cells were analyzed by flow cytometry for the extent of loss of MMP. Data are expressed as the mean ± SD. (D) Representative fluorescent images of T24 cells stained with JC-1 after 300 μg/mL EEZS treatment. Red color indicates healthy cells with high MMP, while green color indicates low MMP. DAPI was used to counterstain the nuclei (blue).EEZS, ethanol extracts of Z. schinifolium leaves; tBid, truncated Bid; COX VI, cytochrome oxidase subunit VI; MMP, mitochondrial membrane potential; MF, mitochondrial fraction; CF, cytosolic fraction; JC-1, 5,5′,6,6′-tetrachloro-1,1′,3,3′-tetramethyl-imidacarbocyanine iodide; DAPI, 4',6'-diamidino-2-phenylindole.
**P < 0.01 and ***P < 0.001 vs. untreated cells.
|
EEZS inactivates the PI3K/Akt signaling pathway in T24 cells
To evaluate the effect of EEZS on PI3K/Akt signaling in T24 cells, we investigated whether EEZS inhibits the phosphorylation of PI3K and its downstream regulator Akt. As presented in Fig. 5A, cells exposed to EEZS show a gradual and a concentration-dependent decrease in the expression levels of p-PI3K (Tyr 458) well as p-Akt (Ser 473) with no alterations in the overall expression of PI3K and Akt, thereby suggesting that the PI3K/Akt signaling activity is inhibited by EEZS stimulation. Therefore, to determine the role of this pathway in EEZS-induced apoptosis, T24 cells were co-treated with EEZS and a PI3K inhibitor, LY294002. We observed markedly increased apoptosis and further decrease in cell viability in cells treated with both compounds, as compared to EEZS alone (Fig. 5B-D).
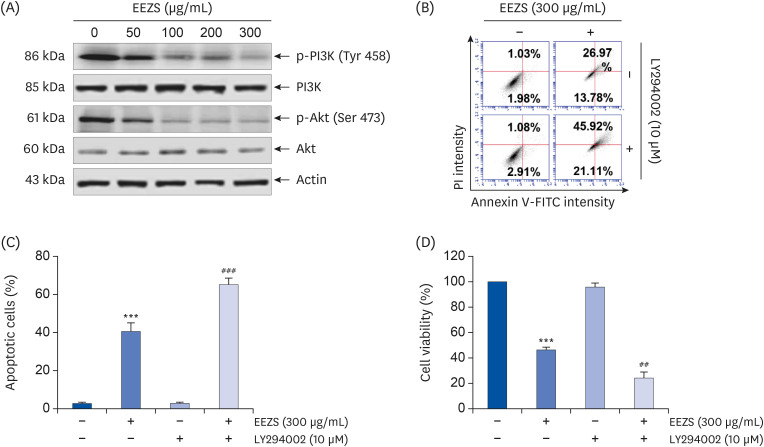 | Fig. 5Effect of EEZS in the PI3K/Akt signaling pathway in T24 cells. Cells were cultured for 48 h in medium containing the indicated concentrations of EEZS (A) or pre-treated with 10 μM LY294002 for 1 h, and then treated with 300 μg/mL EEZS for 48 h (B-D). (A) The expressions of PI3K and Akt proteins and their phosphorylated forms were determined by Western blot analysis. (B) Apoptosis of T24 cells after EEZS treatment in the presence or absence of LY29400 was analyzed using flow cytometry by annexin V/PI double staining. (C) Statistical analysis of apoptotic cell proportion. The percentage of cells undergoing apoptosis is expressed as the percentage of the number of annexin V-positive cells using a flow cytometer. (D) Cell viability was measured by the MTT assay. (C and D) Data are expressed as the mean ± SD.EEZS, ethanol extracts of Z. schinifolium leaves; PI3K, phosphoinositide 3-kinase; FITC, fluorescein isothiocyanate; PI, propidium iodine; MTT, 3-(4,5-dimethylthiazol-2-yl)-2,5-diphenyltetra-zolium bromide.
***P < 0.001 vs. untreated cells. ##P < 0.01 and ###P < 0.001 vs. 300 μg/mL EEZS-treated cells.
|
EEZS increases ROS production in T24 cells
To evaluate the effect of EEZS on intracellular ROS production, flow cytometry and fluorescence microscopy with DCF-DA staining were performed. Results of flow cytometry (Fig. 6A and B) show that ROS levels are greatly increased within 1 h of EEZS treatment. However, the EEZS-induced ROS generation is significantly suppressed by the ROS scavenger NAC. Consistent with the results of flow cytometry, a strongly increased intensity of DCF fluorescence was obtained in cells treated with EEZS alone for 1 h, with significantly decreasing intensity in cells cultured in the presence of NAC (Fig. 6C). Additionally, artificial blocking of ROS generation by NAC resulted in maintaining control levels of p-PI3K and p-Akt expressions in 300 μg/mL EEZS-treated cells (Fig. 6D).
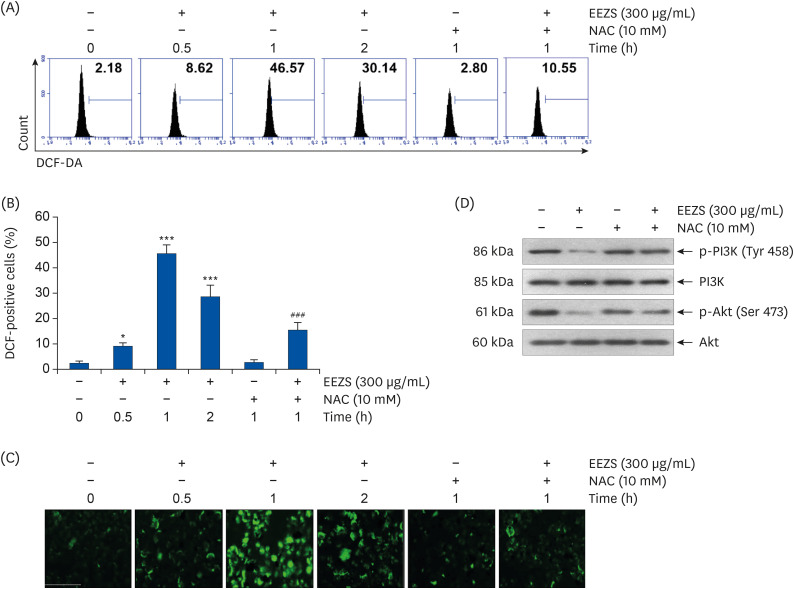 | Fig. 6Effect of ROS on inactivation of PI3K/Akt signaling pathway by EEZS in T24 cells. (A-C) Cells were treated with 300 μg/mL EEZS for the indicated periods, or pre-treated with or without 10 mM NAC for 1 h, followed by treatment with 300 μg/mL EEZS for 1 h. (A) ROS generation was detected by flow cytometry analysis. (B) Quantification of ROS generation measured by a flow cytometer. Data are expressed as the mean ± SD. (C) Intracellular ROS levels in T24 cells were detected using fluorescence microscopy. (D) Cells were incubated with 300 μg/mL EEZS for 48 h, or pre-incubated with 10 mM NAC for 1 h followed by treatment with 300 μg/mL EEZS for 48 h. The expressions of PI3K and Akt proteins and their phosphorylated forms were evaluated by Western blot analysis. Actin was used as a control for protein loading.EEZS, ethanol extracts of Z. schinifolium leaves; NAC; N-acetyl cysteine; DCF, 2′,7′-dichlorofluorescin; PI3K, phosphoinositide 3-kinase; ROS, reactive oxygen species.
*P < 0.05 and ***P < 0.001 vs. untreated cells. ###P < 0.001 vs. 300 μg/mL EEZS-treated cells.
|
EEZS induces ROS-dependent apoptosis in T24 cells
To evaluate if EEZS-mediated cytotoxicity is associated with ROS generation, we investigated the effect of NAC on EEZS-induced cell death and growth inhibition. As observed in the results of DAPI staining and flow cytometry (Fig. 7A-C), NAC pretreatment significantly protects cells from EEZS-induced apoptosis. Consistent with this, decrease in the EEZS-induced cell viability was largely restored by blocking ROS generation (Fig. 7D).
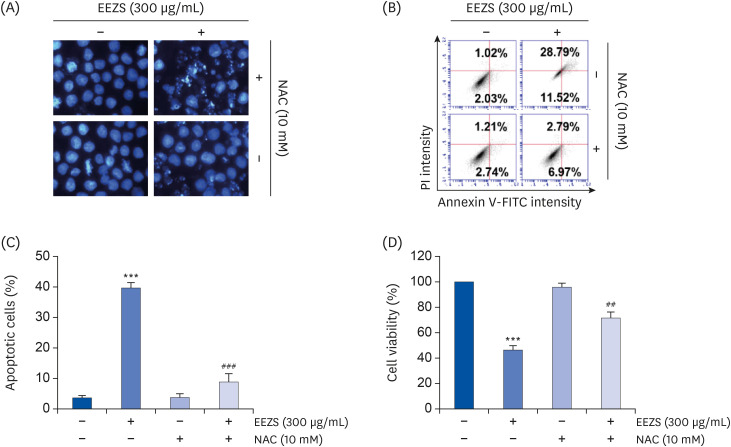 | Fig. 7Induction of ROS-dependent apoptosis by EEZS in T24 cells. Cells were treated with 300 μg/mL EEZS for 48 h, or pre-treated with 10 mM NAC for 1 h before 300 μg/mL EEZS treatment. (A) Nuclear morphological changes were observed under a fluorescence microscope using DAPI staining. (B) Apoptosis was analyzed using flow cytometry after annexin V/PI double staining in T24 cells. (C) Statistical analysis of apoptotic cell proportion. The percentage of cells undergoing apoptosis is expressed as the percentage of the number of annexin V-positive cells using a flow cytometer. (D) Cell viability was measured by the MTT assay. (C and D) Data are expressed as the mean ± SD.EEZS, ethanol extracts of Z. schinifolium leaves; NAC; N-acetyl cysteine; FITC, fluorescein isothiocyanate; PI, propidium iodine; MTT, 3-(4,5-dimethylthiazol-2-yl)-2,5-diphenyltetra-zolium bromide; DAPI, 4′,6′-diamidino-2-phenylindole; MTT, 3-(4,5-dimethylthiazol-2-yl)-2,5-diphenyltetra-zolium bromide.
***P < 0.001 vs. untreated cells. ##P < 0.01 and ###P < 0.001 vs. 300 μg/mL EEZS-treated cells.
|
Go to :
DISCUSSION
Results of the current study demonstrate that EEZS activates both caspase-8 and caspase-9, and promotes the mitochondrial dysfunction and truncation of Bid in T24 bladder cancer cells, accompanied by upregulation in the ratio of Bax expression to Bcl-2, and increased cytochrome c expression in the cytoplasm. In cells treated with EEZS, we determined greatly increased caspase-3 activation and PARP degradation. However, the EEZS-induced cytotoxicity and apoptosis were markedly suppressed by pre-treatment with pan-caspase inhibitor. It is well known that activation of caspase-8 initiates the DR-mediated extrinsic apoptotic pathway, and cleaves and converts Bid to tBid [53435]. tBid then migrates to the mitochondria, promoting permeability of the mitochondrial outer membrane. This results in cytoplasmic translocation of cytochrome c, ultimately amplifying the mitochondrial-mediated intrinsic apoptosis pathway [3436]. Our results therefore demonstrate that EEZS induces apoptosis of T24 cells through activation of the caspase-dependent extrinsic and intrinsic pathways by tBid-mediated crosstalk.
Previous results indicate that excessive activity of the PI3K/Akt signaling pathway plays a critical role in pathogenesis of numerous human tumors, including bladder cancer [11133738]. Akt is a representative downstream kinase of PI3K. Phosphorylation of Akt by activated PI3K inhibits the induction of apoptosis by blocking initiation of the caspase cascade through phosphorylation of caspases. In addition, it enhances the expression of anti-apoptotic proteins, thereby improving the survival and proliferation of cancer cells [3940]. Ultimately, PI3K and its modulators are potentially attractive targets in cancer treatment, as they contribute to chemotherapeutic resistance, which induces cell death in cancer cells. In the present study, exposure to EEZS resulted in decreasing the levels of phosphorylation of PI3K and Akt, indicating inactivation of PI3K/Akt by EEZS. Furthermore, LY294002, a PI3K inhibitor, markedly enhanced the apoptotic activity of EEZS and suppressed the cell viability, supporting our conclusion that EEZS-induced T24 cell apoptosis is associated with inhibition of the activity of PI3K/Akt signaling pathway.
Numerous studies have shown that moderate levels of ROS play a key role as important messengers in multiple signaling pathways. However, excessive accumulation of ROS increases the oxidation of mitochondrial pores, triggering an onset of apoptotic signaling [41041]. Additionally, several studies have shown that numerous bioactive compounds with anti-cancer activity increase the ROS levels, thereby activating apoptosis in cancer cells, which correlates with inhibition of the PI3K/Akt signaling pathway activity [1113]. Although Z. schinifolium extracts have antioxidant activity in normal cells [18], Paik et al. [24] and Lee et al. [42] reported that when exposed to essential oil extracted from Z. schinifolium pericarp, the ROS act as key signaling molecules in inducing apoptosis of human hepatoma cells. We therefore investigated whether the EEZS-induced apoptosis is related to ROS, and examined the role of ROS in EEZS-induced inactivation of PI3K/Akt signaling. As indicated by the results obtained in the current study using DCF-DA, ROS levels were markedly increased during the early stage of EEZS treatment. However, the quenching of ROS production significantly attenuated EEZS-mediated dephosphorylation of PI3K and Akt proteins, and blocked the EEZS-induced reduction in viability and increase in apoptosis. These results demonstrate that ROS production by EEZS in T24 cells plays a critical role in the initiation of apoptosis induction as an upstream signal, and inhibits activation of the PI3K/Akt signaling pathway (Fig. 8). However, more studies are required to determine the role of other cellular signaling pathways that may be involved in the anti-cancer activity of EEZS, and to determine the direct relationship with PI3K/Akt signaling. In addition, establishing the role of other intracellular organelles in cells that are involved in ROS production by EEZS, should be a priority.
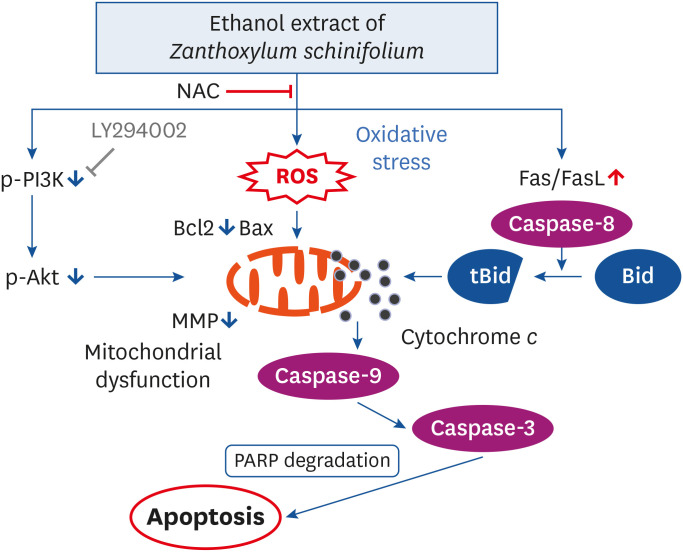 | Fig. 8Illustration of the mechanism of EEZS-induced apoptosis in human bladder cancer T24 cells.NAC, N-acetyl cysteine; ROS, reactive oxygen species; PI3K, phosphoinositide 3-kinase; FasL, Fas ligand; PARP, poly (ADP-ribose) polymerase; MMP, mitochondrial membrane potential; EEZS, ethanol extracts of Z. schinifolium leaves.
|
Taken together, results of the current study indicate that exposure to EEZS inhibits the proliferation of human bladder cancer T24 cells through activation of the caspase-dependent extrinsic as well as intrinsic apoptosis pathways, involving ROS-mediated inactivation of the PI3K/Akt signaling pathway. We therefore conclude that EEZS has the potential to be a promising therapeutic and nutritional agent for cancer treatment.
Go to :
 XML Download