Journal List > J Korean Med Sci > v.37(18) > 1162162

An, Ahn, Jang, Lee, Kang, Lee, and Park: Comparison of the Prevalence of Cardiometabolic Disorders and Comorbidities in Korea and the United States: Analysis of the National Health and Nutrition Examination Survey

Abstract

Background

Comparison of the prevalence of cardiometabolic disorders (CMDs) and comorbidities in Korea and the United States (US) can be an important indicator for forecasting future risk of cardiovascular events in Korea. This study aimed to estimate and compare the prevalence of hypertension, diabetes mellitus (DM), dyslipidemia, obesity, and metabolic syndrome (MetS) in Korea and the US.

Methods

A total of 15,872 individuals from the US National Health and Nutrition Examination Survey (NHANES) 2003–2014 and 26,492 from the Korea NHANES (KNHANES) 2007–2014 were included. Additionally, 164,339 (139,345 from the Health Examinees-Gem Study and 24,994 from the Cardiovascular Disease Association Study) participants enrolled in the Korea Genome and Epidemiology Study were included to investigate the differences of CMDs between urban and rural regions. To estimate the age-standardized prevalence of CMDs in individuals aged 40–69 years, direct standardization using the World Health Organization standard population was performed.

Results

The prevalence of CMDs was lower in Korea than the US (hypertension 49.9% vs. 56.8%; DM 13.4% vs. 14.3%; hypercholesterolemia 16.8% vs. 17.8%; obesity 36.2% vs. 38.6%; and MetS 29.4% vs. 36.5%). According to the median survey years, dyslipidemia has become more prevalent in Korea than in the US since 2010. The prevalence of CMDs was greater in rural than that in urban areas in Korea.

Conclusion

The prevalence of dyslipidemia in Korea exceeded that of the US after 2010, which was associated with increasing burden of cardiovascular events. The present study suggests that further preventive strategies are needed to mitigate the prevalence of CMDs in Korea.

Graphical Abstract

jkms-37-e149-abf001.jpg

INTRODUCTION

The Global Burden of Disease 2016 Study reported that cardiovascular diseases (CVDs) are the leading causes of global years of life lost.1 Since ischemic heart disease is projected to be the leading cause of mortality by 2040,2 CVDs are expected to become more problematic. In the United States (US), nearly half of adults have CVD, and around one in every four people die from it.3 In Korea, CVD is the second largest cause of death following cancer.4
Unhealthy lifestyle behaviors such as cigarette smoking, alcohol consumption, obesity, poor diet, and lack of exercise are widely recognized to impact blood pressure, fasting glucose levels, cholesterol levels, and metabolic syndrome (MetS), all of which are risks factors for CVDs.56789 These conditions are referred to as cardiometabolic disorders (CMDs), which are related to an increased risk of CVDs.10 In addition, a combination of these conditions multiplicatively raises the risk of death from any cause and CVD.1112 The aging population and westernized lifestyle in Korea have increased the prevalence of CMDs.1314151617 As a result, estimating the prevalence of CMDs in a nationally representative population can be an important indicator to forecast the future CVD mortality risk in Korea.
Previous studies have primarily investigated the prevalence of single or multiple CMDs in each country,1819 but no study has directly compared the prevalence of CMDs and comorbidity in Korea and the US using nationally representative population data. In addition, population-based studies in Korea that examine the prevalence of cardiometabolic comorbidities between urban and rural areas have been scarce.
Therefore, the aim of this study is to compare the prevalence of CMDs and comorbidities in Korea and the US by analyzing the US National Health and Nutrition Examination Survey (NHANES) and its counterpart in Korea (Korea National Health and Nutrition Examination Survey [KNHANES]). The Korean population will also be subdivided into a large-scale urban cohort study and a rural community cohort to estimate urban-rural inequalities in the prevalence of CMDs.

METHODS

Study population

NHANES

The NHANES is a series of multistage probability surveys designed to be representative of the non-institutionalized population in the US.20 Since 1999, the NHANES has been collecting data in 2-year phases. From 2003 to 2014, we analyzed 15,872 individuals aged 40 to 69 years to estimate the prevalence of hypertension, diabetes mellitus (DM), dyslipidemia (hypercholesterolemia and hypertriglyceridemia), obesity, and MetS.

KNHANES

The KNHANES is a nationally representative cross-sectional survey that collects data on demographic status, lifestyle habits, anthropometric measurements, and clinical profiles.21 The data is collected annually through a health questionnaire and examination done by certified physicians and medical technicians. Individuals aged 40 to 69 years old having the information on height, weight, and blood pressure measurements, blood tests, and usage of antihypertensive and antidiabetic medication recruited between 2007 to 2014 were included in this study.

Korean Genome and Epidemiology study (KoGES)

The Health Examinees-Gem Study (HEXA-G) and the Cardiovascular Disease Association Study (CAVAS) are both large population-based cohorts from the KoGES. The HEXA-G is comprised of urban residents recruited from various urban hospitals and centers between 2004 and 2013, whereas the CAVAS is composed of individuals living in rural regions in Korea from 2005 to 2011. The detailed information of the urban and rural cohorts of KoGES is described previous studies.2223 This study is eligible to 139,345 individuals from HEXA-G and 24,994 individuals from CAVAS who have information on their blood pressure, height, weight, laboratory blood tests, and usage of antihypertensive and antidiabetic medication.

Definition of CMDs

Hypertension

The American College of Cardiology/American Heart Association 2017 guideline for high blood pressure in adults was used to diagnose hypertension in this study.24 According to the guidelines, we classified hypertension as taking antihypertensive medication, having a systolic blood pressure of 130 mmHg or higher, or having a diastolic blood pressure of 80 mmHg or higher.

DM

According to the World Health Organization (WHO) and International Diabetes Federation, DM is taking antidiabetic medication, having a fasting plasma glucose level of 126 mg/dL or more, or having an HbA1C level of 6.5% or above.25 On the other hand, KNHANES defined DM using plasma glucose level after 8 hours of fasting.

Dyslipidemia (hypercholesterolemia and hypertriglyceridemia)

The two kinds of dyslipidemia, hypercholesterolemia and hypertriglyceridemia were classified using the National Cholesterol Education Program’s Adult Treatment Panel III (NCEP-ATP III) standards.26 Total cholesterol of 240 mg/dL or above was regarded as hypercholesterolemia, and a triglyceride (TG) level of 200 mg/dL or above was defined as hypertriglyceridemia.

Obesity

Different body mass index (BMI) cut-offs were used between Asians and Americans based on the WHO obesity standards.27 Obesity was defined as a BMI of 25 kg/m2 or greater in the Korean population and 30 kg/m2 or greater in the US population.

MetS

According to the NCEP-ATP III criteria,26 MetS is defined as having three of the five conditions mentioned below: 1) A blood pressure of 130/85 mmHg or more or taking antihypertensive medications; 2) a fasting glucose level above 100 mg/dL; 3) high-density lipoprotein level lower than 40 mg/dL for men and 50 mg/dL for women; 4) a TG level greater than 150 mg/dL; 5) a waist circumstance of 102 cm or higher for men and 88 cm or higher for women in the US and 90 cm or higher or for men and 85 cm or higher for women in the Korean population.28

Statistical analysis

The NHANES and KNHANES data were analyzed using relevant established survey sample weights. We used the χ2 test for categorical variables and the Student’s t-test for continuous variables to compare the baseline characteristics including lifestyle habits, and self-reported disease history of CVD and cancer across studies. We calculated the age-standardized prevalence with the 95% confidence intervals of hypertension, DM, hypercholesterolemia, hypertriglyceridemia, obesity, MetS, and the comorbidity in each study population. All estimates were based using direct age-standardized approaches29 using the WHO world standard population.30
The age-standardized rate is computed as follow (calculation of direct age-standardized rate):
(Equation 1)
ASR=i=1Aaiwii=1Awijkms-37-e149-e001.jpg
wi: Number of population in the ith age group of the WHO world standard population.
ai: Age-specific rate in the ith age group.
The prevalence was further subdivided by sex, median survey years of the overall data (before 2010 and after 2010), and age groups (40–49, 50–59, and 60–69). Excess rates were estimated using the KNHANES as the reference group to assess the prevalence differences between the studies. SAS software version 9.4 (SAS Institute Inc., Cary, NC, USA) was used to analyze the data.

Ethics statement

This study was approved by the Institutional Review Boards (IRB) of Seoul National University Hospital (Approval No. 0608-018-179 and 1912-063-1088). Informed consent was waived by the IRB.

RESULTS

Table 1 shows the general characteristics of the study individuals aged 40 to 69 years in the NHANES, KNHANES, HEXA-G, and CAVAS. There were 15,872 individuals in the NHANES, 26,492 in the KNHANES, 139,345 in the HEXA-G, and 24,994 in the CAVAS. The mean age in each study was 54.0, 53.9, 52.7, and 56.5 years old, respectively. The greatest BMI was shown in the NHANES at 29.3 kg/m2, while the lowest was found in the HEXA-G at 23.9 kg/m2. Individuals in the Korean study were less likely to smoke and drink alcohol than individuals in the NHANES, and they were more likely to exercise. The baseline self-reported CVD and cancer history, the prevalence of stroke, myocardial infarction, and was significantly higher in NHANES than in KNHANES and KoGES (Table 1).
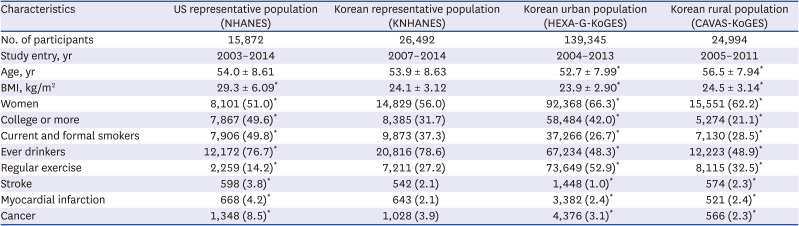
Table 1

Baseline characteristics of the four study groups

jkms-37-e149-i001
Characteristics US representative population (NHANES) Korean representative population (KNHANES) Korean urban population (HEXA-G-KoGES) Korean rural population (CAVAS-KoGES)
No. of participants 15,872 26,492 139,345 24,994
Study entry, yr 2003–2014 2007–2014 2004–2013 2005–2011
Age, yr 54.0 ± 8.61 53.9 ± 8.63 52.7 ± 7.99* 56.5 ± 7.94*
BMI, kg/m2 29.3 ± 6.09* 24.1 ± 3.12 23.9 ± 2.90* 24.5 ± 3.14*
Women 8,101 (51.0)* 14,829 (56.0) 92,368 (66.3)* 15,551 (62.2)*
College or more 7,867 (49.6)* 8,385 (31.7) 58,484 (42.0)* 5,274 (21.1)*
Current and formal smokers 7,906 (49.8)* 9,873 (37.3) 37,266 (26.7)* 7,130 (28.5)*
Ever drinkers 12,172 (76.7)* 20,816 (78.6) 67,234 (48.3)* 12,223 (48.9)*
Regular exercise 2,259 (14.2)* 7,211 (27.2) 73,649 (52.9)* 8,115 (32.5)*
Stroke 598 (3.8)* 542 (2.1) 1,448 (1.0)* 574 (2.3)*
Myocardial infarction 668 (4.2)* 643 (2.1) 3,382 (2.4)* 521 (2.4)*
Cancer 1,348 (8.5)* 1,028 (3.9) 4,376 (3.1)* 566 (2.3)*
NHANES = National Health and Nutrition Examination Survey, KNHANES = Korea National Health and Nutrition Examination Survey, KoGES = Korean Genome and Epidemiology Study, HEXA-G = Health Examinees-Gem Study, CAVAS = Cardiovascular Disease Association Study.
*P < 0.001 for the test for the difference between each group and the KNHANES.

Prevalence of CMDs

We found that the prevalence of CMDs was higher in US adults and lowest among Koreans living in urban areas. Among the CMDs, hypertension had the greatest age-standardized prevalence, affecting half of the individuals in NHANES (56.8%) and Korea (KNHANES, 49.9%; HEXA-G, 51.0%; CAVAS, 60.3%). Hypertension, obesity, and MetS were more prevalent in the NHANES (56.8%, 38.6%, 36.5%) and CAVAS (60.3%, 40.9%, 33.2%) than in the KNHANES (49.9%, 36.2%, 29.4%). The lowest prevalence of dyslipidemia (hypercholesterolemia 11.3%; hypertriglyceridemia 12.8%), obesity (31.9%), and MetS (18.8%) were shown in the Korean urban population (Table 2).
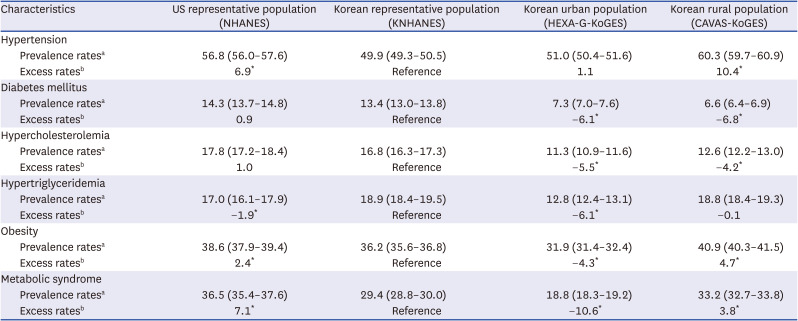
Table 2

ASPRsa of cardiometabolic disorders in the four study groups

jkms-37-e149-i002
Characteristics US representative population (NHANES) Korean representative population (KNHANES) Korean urban population (HEXA-G-KoGES) Korean rural population (CAVAS-KoGES)
Hypertension
Prevalence ratesa 56.8 (56.0–57.6) 49.9 (49.3–50.5) 51.0 (50.4–51.6) 60.3 (59.7–60.9)
Excess ratesb 6.9* Reference 1.1 10.4*
Diabetes mellitus
Prevalence ratesa 14.3 (13.7–14.8) 13.4 (13.0–13.8) 7.3 (7.0–7.6) 6.6 (6.4–6.9)
Excess ratesb 0.9 Reference −6.1* −6.8*
Hypercholesterolemia
Prevalence ratesa 17.8 (17.2–18.4) 16.8 (16.3–17.3) 11.3 (10.9–11.6) 12.6 (12.2–13.0)
Excess ratesb 1.0 Reference −5.5* −4.2*
Hypertriglyceridemia
Prevalence ratesa 17.0 (16.1–17.9) 18.9 (18.4–19.5) 12.8 (12.4–13.1) 18.8 (18.4–19.3)
Excess ratesb −1.9* Reference −6.1* −0.1
Obesity
Prevalence ratesa 38.6 (37.9–39.4) 36.2 (35.6–36.8) 31.9 (31.4–32.4) 40.9 (40.3–41.5)
Excess ratesb 2.4* Reference −4.3* 4.7*
Metabolic syndrome
Prevalence ratesa 36.5 (35.4–37.6) 29.4 (28.8–30.0) 18.8 (18.3–19.2) 33.2 (32.7–33.8)
Excess ratesb 7.1* Reference −10.6* 3.8*
ASPR = age-standardized prevalence rate, NHANES =National Health and Nutrition Examination Survey, KNHANES = Korea National Health and Nutrition Examination Survey, KoGES = Korean Genome and Epidemiology Study, HEXA-G = Health Examinees-Gem Study, CAVAS = Cardiovascular Disease Association Study.
aASPRs (per 100 persons) were calculated using the World Health Organization world standard population.
bExcess rates (per 100 persons) were calculated as [(ASPR in each group) − (ASPR in the KNHANES)].
*P < 0.001 for the test for the difference between each group and the KNHANES.
The sex differences in the age-standardized prevalence of CMDs were similar across the two countries. In both US and Korea, men have a larger prevalence of hypertension, DM, hypertriglyceridemia, and MetS than women, whereas women have a higher prevalence of hypercholesterolemia. Obesity was more prevalent in women than in men in the US, whereas it was more common in men in Korea (Table 3).
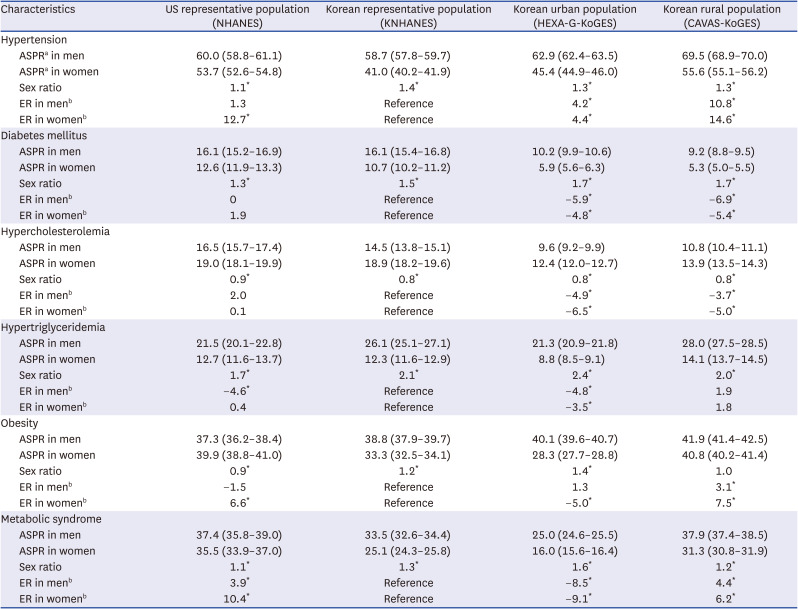
Table 3

Sex-specific ASPRsa of cardiometabolic disorders in the four study groups

jkms-37-e149-i003
Characteristics US representative population (NHANES) Korean representative population (KNHANES) Korean urban population (HEXA-G-KoGES) Korean rural population (CAVAS-KoGES)
Hypertension
ASPRa in men 60.0 (58.8–61.1) 58.7 (57.8–59.7) 62.9 (62.4–63.5) 69.5 (68.9–70.0)
ASPRa in women 53.7 (52.6–54.8) 41.0 (40.2–41.9) 45.4 (44.9–46.0) 55.6 (55.1–56.2)
Sex ratio 1.1* 1.4* 1.3* 1.3*
ER in menb 1.3 Reference 4.2* 10.8*
ER in womenb 12.7* Reference 4.4* 14.6*
Diabetes mellitus
ASPR in men 16.1 (15.2–16.9) 16.1 (15.4–16.8) 10.2 (9.9–10.6) 9.2 (8.8–9.5)
ASPR in women 12.6 (11.9–13.3) 10.7 (10.2–11.2) 5.9 (5.6–6.3) 5.3 (5.0–5.5)
Sex ratio 1.3* 1.5* 1.7* 1.7*
ER in menb 0 Reference −5.9* −6.9*
ER in womenb 1.9 Reference −4.8* −5.4*
Hypercholesterolemia
ASPR in men 16.5 (15.7–17.4) 14.5 (13.8–15.1) 9.6 (9.2–9.9) 10.8 (10.4–11.1)
ASPR in women 19.0 (18.1–19.9) 18.9 (18.2–19.6) 12.4 (12.0–12.7) 13.9 (13.5–14.3)
Sex ratio 0.9* 0.8* 0.8* 0.8*
ER in menb 2.0 Reference −4.9* −3.7*
ER in womenb 0.1 Reference −6.5* −5.0*
Hypertriglyceridemia
ASPR in men 21.5 (20.1–22.8) 26.1 (25.1–27.1) 21.3 (20.9–21.8) 28.0 (27.5–28.5)
ASPR in women 12.7 (11.6–13.7) 12.3 (11.6–12.9) 8.8 (8.5–9.1) 14.1 (13.7–14.5)
Sex ratio 1.7* 2.1* 2.4* 2.0*
ER in menb −4.6* Reference −4.8* 1.9
ER in womenb 0.4 Reference −3.5* 1.8
Obesity
ASPR in men 37.3 (36.2–38.4) 38.8 (37.9–39.7) 40.1 (39.6–40.7) 41.9 (41.4–42.5)
ASPR in women 39.9 (38.8–41.0) 33.3 (32.5–34.1) 28.3 (27.7–28.8) 40.8 (40.2–41.4)
Sex ratio 0.9* 1.2* 1.4* 1.0
ER in menb −1.5 Reference 1.3 3.1*
ER in womenb 6.6* Reference −5.0* 7.5*
Metabolic syndrome
ASPR in men 37.4 (35.8–39.0) 33.5 (32.6–34.4) 25.0 (24.6–25.5) 37.9 (37.4–38.5)
ASPR in women 35.5 (33.9–37.0) 25.1 (24.3–25.8) 16.0 (15.6–16.4) 31.3 (30.8–31.9)
Sex ratio 1.1* 1.3* 1.6* 1.2*
ER in menb 3.9* Reference −8.5* 4.4*
ER in womenb 10.4* Reference −9.1* 6.2*
ASPR = age-standardized prevalence rate, NHANES = National Health and Nutrition Examination Survey, KNHANES = Korea National Health and Nutrition Examination Survey, KoGES = Korean Genome and Epidemiology Study, HEXA-G = Health Examinees-Gem Study, CAVAS = Cardiovascular Disease Association Study, ER = excess rate.
aASPRs (per 100 persons) were calculated using the World Health Organization world standard population.
bERs (per 100 persons) were calculated as [(ASPR in each group) − (ASPR in the KNHANES)].
*P < 0.001 for the test for the difference between each group and the KNHANES.

Comparison of the prevalence rates between before and after 2010

According to the median survey years of the overall data from 2003 to 2014, the data was divided into before 2010 (from 2003 to 2009) and after 2010 (from 2010 to 2014). In both Korean and US studies, more than half of the individuals were diagnosed with hypertension after 2010. Individuals living in rural regions in Korea showed a significant decrease in the prevalence of hypertension after 2010 compared to before 2010 (CAVAS, 61.0% vs. 54.1%). We found increasing prevalence of DM in the Korean population (KNHANES, from 11.8% to 14.1%; HEXA-G, from 5.7% to 9.7%; CAVAS, from 6.4% to 8.9%). Individuals in KNHANES had increasing prevalence of hypercholesterolemia (from 13.8% to 18.2%), as opposed to those in NHANES (hypercholesterolemia, from 19.2% to 15.4%; hypertriglyceridemia, from 18.2% to 15.1%). After 2010, the prevalence of hypercholesterolemia and hypertriglyceridemia in KNHAENS (18.2% and 18.9%, respectively) became higher than that in the NHANES (15.4% and 15.1%). The prevalence of obesity increased in the individuals in NHANES (from 37.8% to 40.3%) and CAVAS (from 40.8% to 41.7%), while decreased in KNHANES (from 37.1% to 35.8%) and HEXA-G (from 32.3% to 31.3%). The prevalence of MetS, the prevalence decreased in both US and Korean (NHANES, from 37.1% to 35.5%; KNHANES, from 32.7% to 28.3%; HEXA-G, from 19.4% to 17.8%; CAVAS, from 33.8% to 28.5%) (Table 4 and Supplementary Table 1).
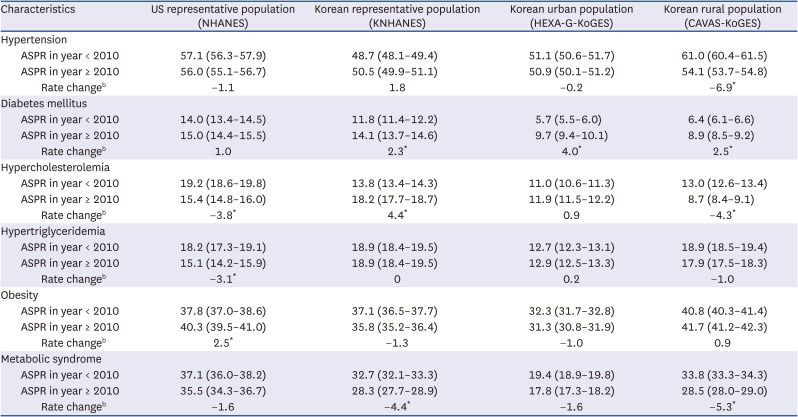
Table 4

ASPRsa of cardiometabolic disorders according to the observational year in the four study groups

jkms-37-e149-i004
Characteristics US representative population (NHANES) Korean representative population (KNHANES) Korean urban population (HEXA-G-KoGES) Korean rural population (CAVAS-KoGES)
Hypertension
ASPR in year < 2010 57.1 (56.3–57.9) 48.7 (48.1–49.4) 51.1 (50.6–51.7) 61.0 (60.4–61.5)
ASPR in year ≥ 2010 56.0 (55.1–56.7) 50.5 (49.9–51.1) 50.9 (50.1–51.2) 54.1 (53.7–54.8)
Rate changeb −1.1 1.8 −0.2 −6.9*
Diabetes mellitus
ASPR in year < 2010 14.0 (13.4–14.5) 11.8 (11.4–12.2) 5.7 (5.5–6.0) 6.4 (6.1–6.6)
ASPR in year ≥ 2010 15.0 (14.4–15.5) 14.1 (13.7–14.6) 9.7 (9.4–10.1) 8.9 (8.5–9.2)
Rate changeb 1.0 2.3* 4.0* 2.5*
Hypercholesterolemia
ASPR in year < 2010 19.2 (18.6–19.8) 13.8 (13.4–14.3) 11.0 (10.6–11.3) 13.0 (12.6–13.4)
ASPR in year ≥ 2010 15.4 (14.8–16.0) 18.2 (17.7–18.7) 11.9 (11.5–12.2) 8.7 (8.4–9.1)
Rate changeb −3.8* 4.4* 0.9 −4.3*
Hypertriglyceridemia
ASPR in year < 2010 18.2 (17.3–19.1) 18.9 (18.4–19.5) 12.7 (12.3–13.1) 18.9 (18.5–19.4)
ASPR in year ≥ 2010 15.1 (14.2–15.9) 18.9 (18.4–19.5) 12.9 (12.5–13.3) 17.9 (17.5–18.3)
Rate changeb −3.1* 0 0.2 −1.0
Obesity
ASPR in year < 2010 37.8 (37.0–38.6) 37.1 (36.5–37.7) 32.3 (31.7–32.8) 40.8 (40.3–41.4)
ASPR in year ≥ 2010 40.3 (39.5–41.0) 35.8 (35.2–36.4) 31.3 (30.8–31.9) 41.7 (41.2–42.3)
Rate changeb 2.5* −1.3 −1.0 0.9
Metabolic syndrome
ASPR in year < 2010 37.1 (36.0–38.2) 32.7 (32.1–33.3) 19.4 (18.9–19.8) 33.8 (33.3–34.3)
ASPR in year ≥ 2010 35.5 (34.3–36.7) 28.3 (27.7–28.9) 17.8 (17.3–18.2) 28.5 (28.0–29.0)
Rate changeb −1.6 −4.4* −1.6 −5.3*
NHANES = National Health and Nutrition Examination Survey, KNHANES = Korea National Health and Nutrition Examination Survey, KoGES = Korean Genome and Epidemiology Study, HEXA-G = Health Examinees-Gem Study, CAVAS = Cardiovascular Disease Association Study, ASPR = age-standardized prevalence rate.
aASPR was calculated using World Health Organization world standard population.
bRate change was calculated as [(ASPR in recent year ≥ 2010) − (ASPR in past year < 2010).
*P < 0.001 for the test for the difference between each group and the KNHANES.

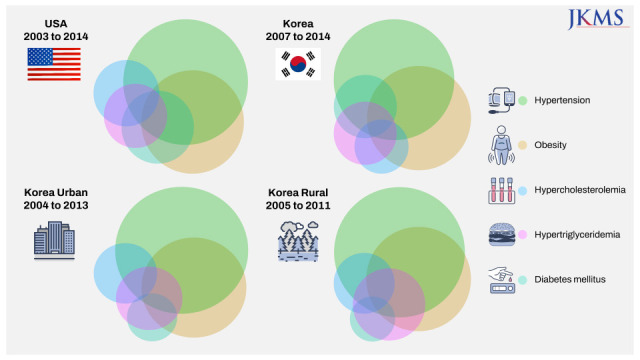
Prevalence of cardiometabolic comorbidity

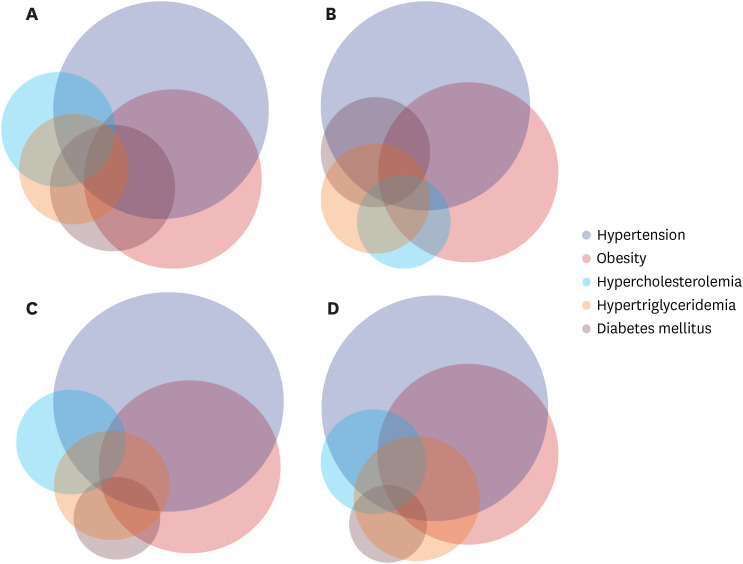
Overall, 24.4%, 29.3%, 30.9%, and 19.5% of individuals in NHANES, KNHANES, HEXA-G, and CAVAS were free of CMDs, respectively. In the KNHANES, 31.1%, 23.2%, 11.8%, and 4.6% had one, two, three, and four disorders, respectively, as opposed to 31.5%, 26.0%, 13.4%, and 4.7% in the NHANES, respectively. Individuals in rural regions were more likely to have a comorbidity than those in urban areas in Korea. In both Korean and US population, the most common combination of comorbidities was hypertension and obesity (Fig. 1 and Supplementary Table 2).
Fig. 1

Combination of age-standard prevalence for comorbirity according to each studies. (A) US National Health and Nutrition Examination Survey, (B) Korea National Health and Nutrition Examination Survey, (C) Health Examinees-Gem Study, and (D) Cardiovascular Disease Association Study.

jkms-37-e149-g001

DISCUSSION

Our study found that the Korean population had a lower prevalence of hypertension, obesity, and MetS than the US population. Individuals living in rural areas had the highest prevalence of hypertension, hypertriglyceridemia, obesity, and MetS in Korean population studies. The prevalence rates of hypertension, DM, obesity, and MetS after 2010 in Korea were lower than those in the US population. However, dyslipidemia was more prevalent in Korea than the US. Korea also had a lower prevalence of cardiometabolic comorbidity than the US. Among the Korean population, individuals living in rural areas had the highest prevalence of comorbidity.
Lifestyle behaviors such as cigarette smoking, alcohol consumption, diet, and physical activity are the common triggers for CVDs.313233343536 These poor lifestyle behaviors affect blood pressure, fasting glucose levels, cholesterol levels, and obesity, all of which are intermediate risks factors for CVDs.56789 Hypertension is responsible for approximately 42.7% of coronary heart disease, 38.9% of strokes, and 21.6% of heart failure.37 DM is associated with a 19.5% population attributable risk for stroke and a 3% for coronary heart disease, respectively.38394041 Hypercholesterolemia is accountable for 18% of the risk of coronary heart disease, 31% of the risk of myocardial infarction, and a 21% higher risk of CVD mortality.414243 On the other hand, the relationship between hypertriglyceridemia and the risk of CVD and mortality has been debated.4445 Furthermore, since life expectancy has gradually increased over the last decade, the prevalence of CMDs and comorbidity has risen as well.46 Previous studies have found that having multiple CMDs is associated with a higher risk of total and cardiovascular mortality.1112
CMDs were less prevalent in the Korean population than in the US population. Theses differences might be related to variances in dietary patterns and lifestyle behaviors.47 Due to economic growth and westernization, however, the increased prevalence of CMDs has become a burden on public health in Korea.13141516 Previous studies have investigated the prevalence of CMDs in the US and Korea, respectively;1819 but there were only a few studies that evaluated the difference between the two nations. Comparing the prevalence of CMDs in Korea with the US has important implications for intervention strategies to prevent the risk of CVD mortality in Korea. In this study, we estimated and compared the prevalence of CMDs and comorbidities in the US and Korea using four independent data sources, including data representative of the US and Korea and large-scale urban and rural cohorts in Korea.
We found a significant increase in the prevalence of DM in the Korean population after 2010, which corresponded to the global increase in DM.48 In comparison to the US, Korea had a much greater prevalence of dyslipidemia after 2010. Because dyslipidemia is common in patients with hypertension and DM, the increasing prevalence of hypertension and DM in Korea might be associated with a higher prevalence of dyslipidemia.49 Korea’s carbohydrate-centered diet is another risk factor for dyslipidemia.50 Furthermore, individuals living in rural areas of Korea showed a much higher prevalence of comorbidity than those living in urban areas. This disparity is likely due to their low socioeconomic status, limited access to health care, and unhealthy lifestyle behaviors.515253 Public health program is needed to decrease the excess risk of mortality from CVDs in rural areas of Korea.
There are several strengths in our study. First, we used data from the NHANES and KNHANES, which are nationally representative data of the US and Korea, respectively. Based on the non-institutionalized population dataset, we were able to estimate the age-standardized prevalence of CMDs in both the countries. The large sample size from the KoGES data was another strength of our study. The Korean population was also subdivided into an urban and rural cohort to compare the rural-urban disparities in Korea. To our knowledge, our study was the first to compare the age-standardized prevalence of CMDs and comorbidities in Korea and the US.
This study has several limitations. Misclassification bias can occur due to the differences between each of the studies from study design, and measurement methods. We were unable to classify type 1 or type 2 DM, due to the lack of information in the dataset. Another limitation is that because the datasets we used are based on cross-sectional surveys, we were limited to capturing information from a specific point in time and were unable to examine a cause-and-effect relationship with mortality from CVDs. Further studies on the effects of CMDs on CVD events in nationally representative data will be required.
In conclusion, the comparison of the prevalence of CMDs and comorbidities in Korea and the US suggests that an effective monitoring system and prevention strategies are needed to minimize the risk of CVD events, particularly in rural areas of Korea.

ACKNOWLEDGMENTS

We would like to thank the participants and all members of the Health Examinee Study (HEXA) group. This study was provided with bioresources from the National Biobank of Korea, the Centers for Disease Control and Prevention, Republic of Korea (4845-301, 4851-302 and -307).

Notes

Funding: This research was supported by a grant of the Korea Health Technology R&D Project through the Korea Health Industry Development Institute (KHIDI), and National Genome Research Institute, Korea Center for Disease Control and Prevention, and by a grant from Seoul National University Hospital (2022). This research was funded by the Ministry of Health & Welfare, Republic of Korea (grant No. HI16C1127).

Disclosure: The authors have no potential conflicts of interest to disclose.

Author Contributions:

  • Conceptualization: An S, Park SK.

  • Data curation: Kang D, Lee JK, Park SK.

  • Formal analysis: An S, Ahn C.

  • Funding acquisition: Park SK.

  • Investigation: An S, Ahn C, Jang J, Lee J.

  • Methodology: An S, Ahn C, Kang D, Lee JK, Park SK.

  • Project administration: Park SK.

  • Resources: Kang D, Lee JK, Park SK.

  • Software: An S, Ahn C.

  • Supervision: Park SK.

  • Validation: An S, Park SK.

  • Visualization: An S.

  • Writing - original draft: An S.

  • Writing - review & editing: An S, Ahn C, Jang J, Lee J, Kang D, Lee JK, Park SK.

References

1. GBD 2016 Causes of Death Collaborators. Global, regional, and national age-sex specific mortality for 264 causes of death, 1980-2016: a systematic analysis for the Global Burden of Disease Study 2016. Lancet. 2017; 390(10100):1151–1210. PMID: 28919116.
2. Foreman KJ, Marquez N, Dolgert A, Fukutaki K, Fullman N, McGaughey M, et al. Forecasting life expectancy, years of life lost, and all-cause and cause-specific mortality for 250 causes of death: reference and alternative scenarios for 2016-40 for 195 countries and territories. Lancet. 2018; 392(10159):2052–2090. PMID: 30340847.
3. Benjamin EJ, Muntner P, Alonso A, Bittencourt MS, Callaway CW, Carson AP, et al. Heart disease and stroke statistics-2019 update: a report from the American Heart Association. Circulation. 2019; 139(10):e56–528. PMID: 30700139.
4. Shin HY, Kim J, Lee S, Park MS, Park S, Huh S. Cause-of-death statistics in 2018 in the Republic of Korea. J Korean Med Assoc. 2020; 63(5):286–297.
5. Helfand M, Buckley D, Fleming C, Fu R, Freeman M, Humphrey L, et al. Screening for Intermediate Risk Factors for Coronary Heart Disease. Rockville, MD, USA: Agency for Healthcare Research and Quality (US);2009.
6. Kokubo Y, Iwashima Y. Higher blood pressure as a risk factor for diseases other than stroke and ischemic heart disease. Hypertension. 2015; 66(2):254–259. PMID: 26077565.
7. Laakso M. Cardiovascular disease in type 2 diabetes from population to man to mechanisms: the Kelly West Award Lecture 2008. Diabetes Care. 2010; 33(2):442–449. PMID: 20103560.
8. Wang X, Dong Y, Qi X, Huang C, Hou L. Cholesterol levels and risk of hemorrhagic stroke: a systematic review and meta-analysis. Stroke. 2013; 44(7):1833–1839. PMID: 23704101.
9. Yaghi S, Elkind MS. Lipids and cerebrovascular disease: research and practice. Stroke. 2015; 46(11):3322–3328. PMID: 26451029.
10. Kirk EP, Klein S. Pathogenesis and pathophysiology of the cardiometabolic syndrome. J Clin Hypertens (Greenwich). 2009; 11(12):761–765. PMID: 20021538.
11. Emerging Risk Factors Collaboration. Di Angelantonio E, Kaptoge S, Wormser D, Willeit P, Butterworth AS, et al. Association of cardiometabolic multimorbidity with mortality. JAMA. 2015; 314(1):52–60. PMID: 26151266.
12. Licher S, Heshmatollah A, van der Willik KD, Stricker BH, Ruiter R, de Roos EW, et al. Lifetime risk and multimorbidity of non-communicable diseases and disease-free life expectancy in the general population: a population-based cohort study. PLoS Med. 2019; 16(2):e1002741. PMID: 30716101.
13. Moran AE, Forouzanfar MH, Roth GA, Mensah GA, Ezzati M, Murray CJ, et al. Temporal trends in ischemic heart disease mortality in 21 world regions, 1980 to 2010: the Global Burden of Disease 2010 study. Circulation. 2014; 129(14):1483–1492. PMID: 24573352.
14. Kim HJ, Kim Y, Cho Y, Jun B, Oh KW. Trends in the prevalence of major cardiovascular disease risk factors among Korean adults: results from the Korea National Health and Nutrition Examination Survey, 1998-2012. Int J Cardiol. 2014; 174(1):64–72. PMID: 24742812.
15. Suh S, Lee MK. Metabolic syndrome and cardiovascular diseases in Korea. J Atheroscler Thromb. 2014; 21(Suppl 1):S31–S35. PMID: 24452115.
16. Lee SW, Kim HC, Lee HS, Suh I. Thirty-year trends in mortality from cardiovascular diseases in Korea. Korean Circ J. 2015; 45(3):202–209. PMID: 26023308.
17. Yoon YS, Oh SW. Recent shift of body mass index distribution in Korea: a population-based Korea National Health Insurance Database, 2002-2013. J Korean Med Sci. 2017; 32(3):434–438. PMID: 28145646.
18. Kim H, Kim S, Han S, Rane PP, Fox KM, Qian Y, et al. Prevalence and incidence of atherosclerotic cardiovascular disease and its risk factors in Korea: a nationwide population-based study. BMC Public Health. 2019; 19(1):1112. PMID: 31412823.
19. Muntner P, Hardy ST, Fine LJ, Jaeger BC, Wozniak G, Levitan EB, et al. Trends in blood pressure control among US adults with hypertension, 1999-2000 to 2017-2018. JAMA. 2020; 324(12):1190–1200. PMID: 32902588.
20. Johnson CL, Dohrmann SM, Burt VL, Mohadjer LK. National health and nutrition examination survey: sample design, 2011–2014. Vital Health Stat 2. 2014; (162):1–33.
21. Kweon S, Kim Y, Jang MJ, Kim Y, Kim K, Choi S, et al. Data resource profile: the Korea National Health and Nutrition Examination Survey (KNHANES). Int J Epidemiol. 2014; 43(1):69–77. PMID: 24585853.
22. Shin S, Lee HW, Kim CE, Lim J, Lee JK, Lee SA, et al. Egg consumption and risk of metabolic syndrome in Korean adults: results from the Health Examinees Study. Nutrients. 2017; 9(7):687.
23. Kim Y, Han BG. KoGES group. Cohort profile: the Korean Genome and Epidemiology Study (KoGES) consortium. Int J Epidemiol. 2017; 46(4):1350. PMID: 28938752.
24. Whelton PK, Carey RM, Aronow WS, Casey DE Jr, Collins KJ, Dennison Himmelfarb C, et al. 2017 ACC/AHA/AAPA/ABC/ACPM/AGS/APhA/ASH/ASPC/NMA/PCNA guideline for the prevention, detection, evaluation, and management of high blood pressure in adults: a report of the American College of Cardiology/American Heart Association task force on clinical practice guidelines. Circulation. 2018; 138(17):e484–e594. PMID: 30354654.
25. World Health Organization. International Diabetes Federation. Definition and Diagnosis of Diabetes Mellitus and Intermediate Hyperglycaemia: Report of a WHO/IDF Consultation. Geneva, Switzerland: World Health Organization;2006.
26. National Cholesterol Education Program (NCEP) Expert Panel on Detection, Evaluation, and Treatment of High Blood Cholesterol in Adults (Adult Treatment Panel III). Third Report of the National Cholesterol Education Program (NCEP) Expert Panel on Detection, Evaluation, and Treatment of High Blood Cholesterol in Adults (Adult Treatment Panel III) final report. Circulation. 2002; 106(25):3143–3421. PMID: 12485966.
27. World Health Organization Regional Office for the Western Pacific. The Asia-Pacific Perspective: Redefining Obesity and Its Treatment. Sydney, Australia: Health Communications Australia;2000.
28. Lee SY, Park HS, Kim DJ, Han JH, Kim SM, Cho GJ, et al. Appropriate waist circumference cutoff points for central obesity in Korean adults. Diabetes Res Clin Pract. 2007; 75(1):72–80. PMID: 16735075.
29. Boyle P, Parkin DM. Cancer registration: principles and methods. Statistical methods for registries. IARC Sci Publ. 1991; (95):126–158. PMID: 1894318.
30. Ahmad OB, Boschi-Pinto C, Lopez AD, Murray CJ, Lozano R, Inoue M. Age Standardization of Rates: A New WHO Standard. GPE Discussion Paper Series: No. 31. Geneva, Switzerland: World Health Organization;2001.
31. Anand SS, Hawkes C, de Souza RJ, Mente A, Dehghan M, Nugent R, et al. Food consumption and its impact on cardiovascular disease: importance of solutions focused on the globalized food system: a report from the workshop convened by the World Heart Federation. J Am Coll Cardiol. 2015; 66(14):1590–1614. PMID: 26429085.
32. Rigotti NA, Clair C. Managing tobacco use: the neglected cardiovascular disease risk factor. Eur Heart J. 2013; 34(42):3259–3267. PMID: 24014389.
33. Hackshaw A, Morris JK, Boniface S, Tang JL, Milenković D. Low cigarette consumption and risk of coronary heart disease and stroke: meta-analysis of 141 cohort studies in 55 study reports. BMJ. 2018; 360:j5855. PMID: 29367388.
34. Whitman IR, Agarwal V, Nah G, Dukes JW, Vittinghoff E, Dewland TA, et al. Alcohol abuse and cardiac disease. J Am Coll Cardiol. 2017; 69(1):13–24. PMID: 28057245.
35. Goenka S, Lee IM. Physical activity lowers mortality and heart disease risks. Lancet. 2017; 390(10113):2609–2610. PMID: 28943265.
36. Shiroma EJ, Lee IM. Physical activity and cardiovascular health: lessons learned from epidemiological studies across age, gender, and race/ethnicity. Circulation. 2010; 122(7):743–752. PMID: 20713909.
37. Clark D 3rd, Colantonio LD, Min YI, Hall ME, Zhao H, Mentz RJ, et al. Population-attributable risk for cardiovascular disease associated with hypertension in black adults. JAMA Cardiol. 2019; 4(12):1194–1202. PMID: 31642869.
38. World Health Organization. Noncommunicable Diseases Country Profiles 2018. Geneva, Switzerland: World Health Organization;2018.
39. World Health Organization. Global Action Plan for the Prevention and Control of NCDs 2013–2020. Geneva, Switzerland: World Health Organization;2013.
40. Willey JZ, Moon YP, Kahn E, Rodriguez CJ, Rundek T, Cheung K, et al. Population attributable risks of hypertension and diabetes for cardiovascular disease and stroke in the northern Manhattan study. J Am Heart Assoc. 2014; 3(5):e001106. PMID: 25227406.
41. Nilsson PM, Nilsson JA, Berglund G. Population-attributable risk of coronary heart disease risk factors during long-term follow-up: the Malmö Preventive Project. J Intern Med. 2006; 260(2):134–141. PMID: 16882277.
42. Glazer NL, Smith NL, Heckbert SR, Doggen CJ, Lemaitre RN, Psaty BM. Risk of myocardial infarction attributable to elevated levels of total cholesterol among hypertensives. Am J Hypertens. 2005; 18(6):759–766. PMID: 15925732.
43. Sugiyama D, Okamura T, Watanabe M, Higashiyama A, Okuda N, Nakamura Y, et al. Risk of hypercholesterolemia for cardiovascular disease and the population attributable fraction in a 24-year Japanese cohort study. J Atheroscler Thromb. 2015; 22(1):95–107. PMID: 25185893.
44. Nordestgaard BG, Varbo A. Triglycerides and cardiovascular disease. Lancet. 2014; 384(9943):626–635. PMID: 25131982.
45. Miller M, Stone NJ, Ballantyne C, Bittner V, Criqui MH, Ginsberg HN, et al. Triglycerides and cardiovascular disease: a scientific statement from the American Heart Association. Circulation. 2011; 123(20):2292–2333. PMID: 21502576.
46. Houtkooper RH, Williams RW, Auwerx J. Metabolic networks of longevity. Cell. 2010; 142(1):9–14. PMID: 20603007.
47. Jun S, Ha K, Chung S, Joung H. Meat and milk intake in the rice-based Korean diet: impact on cancer and metabolic syndrome. Proc Nutr Soc. 2016; 75(3):374–384. PMID: 26975473.
48. NCD Risk Factor Collaboration (NCD-RisC). Worldwide trends in diabetes since 1980: a pooled analysis of 751 population-based studies with 4.4 million participants. Lancet. 2016; 387(10027):1513–1530. PMID: 27061677.
49. Srikanth S, Deedwania P. Management of dyslipidemia in patients with hypertension, diabetes, and metabolic syndrome. Curr Hypertens Rep. 2016; 18(10):76. PMID: 27730495.
50. Song Y, Joung H. A traditional Korean dietary pattern and metabolic syndrome abnormalities. Nutr Metab Cardiovasc Dis. 2012; 22(5):456–462. PMID: 21215606.
51. Cross SH, Mehra MR, Bhatt DL, Nasir K, O’Donnell CJ, Califf RM, et al. Rural-urban differences in cardiovascular mortality in the US, 1999-2017. JAMA. 2020; 323(18):1852–1854. PMID: 32396176.
52. Lee HY. Socioeconomic disparities in the prevalence, diagnosis, and control of hypertension in the context of a universal health insurance system. J Korean Med Sci. 2017; 32(4):561–567. PMID: 28244279.
53. Chung SJ, Han YS, Lee SI, Kang SH. Urban and rural differences in the prevalence of gender and age specific obesity and related health behaviors in Korea. J Korean Med Sci. 2005; 20(5):713–720. PMID: 16224141.

SUPPLEMENTARY MATERIALS

Supplementary Table 1

ASPRsa of cardiometabolic disorders according to observational year in each age group
jkms-37-e149-s001.doc

Supplementary Table 2

Comorbidity rates (age-standardized prevalence per 100 persons) in each study
jkms-37-e149-s002.doc
TOOLS
Similar articles