

 PDF
PDF Citation
 Print
Print


INTRODUCTION
Childhood and adolescence are periods of rapid physiological, sexual, neurological, and behavioral changes [1]. During these life stages, proper nutrition is important to achieve one's full growth potential [2]. However, in modern society, the high accessibility of energy-dense foods and reduced physical activity, due to increased screen time and sedentary activity, has prompted energy imbalances in children [3]. This has led to the 47% increase in overweight and obese children and adolescents during the past few decades worldwide [4]; the obesity rates of Korean children and adolescents show a similar pattern [5].
As children and adolescents gradually become more independent in lifestyle decision-making, including food selection and intake, their food literacy during this crucial period may impact lifelong eating patterns and behaviors. Food literacy is defined as “the scaffolding that empowers individuals, households, communities, or nations to protect diet quality through change and strengthen dietary resilience over time. It is composed of a collection of inter-related knowledge, skills and behaviors required to plan, manage, select, prepare, and eat food to meet needs and determine intake” [6]. Thus, enhancing food literacy during child development may benefit dietary behaviors by increasing the knowledge of healthy and sustainable diets and choice of appropriate foods. In addition, children and adolescents may be strongly affected by peers, parental modeling, mass media, and body image when selecting and consuming foods [7]. Therefore, the ability, skills, and behaviors that enable one to search for, comprehend, and apply food knowledge is essential. In adults, a positive association between food literacy and dietary behavior has been demonstrated [8], but this association has not been investigated in children and adolescents.
In addition to personal nutrition, emphasis on the impact of food selection and intake on the food system and environment is increasing. More than half of the 17 United Nations Sustainable Development Goals are related to food, including health, environment, food production and consumption patterns, and food security [9]. In line with this trend, recent research on food literacy also covers a broad spectrum—from individual health to the food system and its interactions with the society and environment [1011]. Therefore, the term “food literacy” should incorporate complex decision-making concepts related to food [12]. The food system encompasses all processes related to food, including production, processing, distribution, consumption, and disposal, and operates within a social, political, economic, and natural environment [13]. By integrating the food system into the conceptual framework of food literacy, we may adequately address issues such as food safety and sustainable agriculture, which were limited in previous approaches [14].
Unfortunately, children and adolescents have few opportunities to be educated on the effects of food selection and intake on the society and environment as most school curricula do not focus on this aspect [1516]. Moreover, most food literacy interventions in children and adolescents have focused on food preparation and nutrition, but not on the food system [17]. Recently, we developed and validated a food literacy measurement tool for adults based on a new two-dimensional conceptual framework which integrates a food system dimension with6 the existing literacy measurement tools [18]. Using this 25-item measurement tool, we found that food literacy was positively associated with food knowledge and diet quality in adults [18]. However, no food literacy measurement tool that covers these comprehensive concepts exists for children and adolescents [10].
In the current study, we aimed to develop and validate a food literacy measurement tool based on a comprehensive conceptual framework applicable to children and adolescents. Using this measurement tool, we explored the associations of food literacy with diet quality and subjective health in Korean children and adolescents.
SUBJECTS AND METHODS
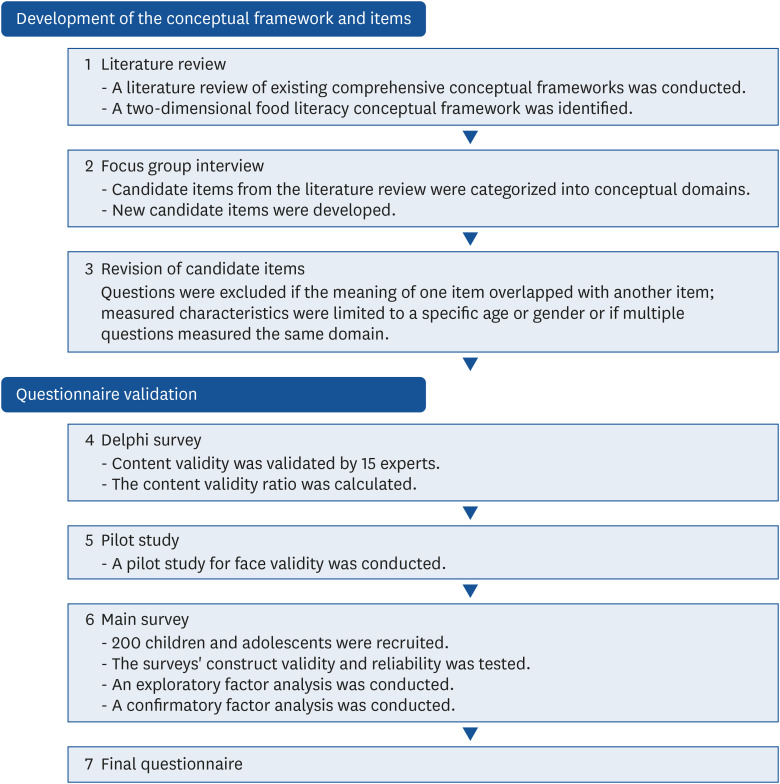
The current questionnaire was developed and validated following the methods previously described [18]. Briefly, the conceptual framework, based on a literature review of food literacy in adults [61219202122], was adapted to children and adolescents through the generation of new questions, a focus group interview, Delphi study, and face validity study (Fig. 1). A main survey was then performed, and the results were validated against Nutrition Quotient (NQ) scores and subjective health. All of the study processes were approved in advance by the Institutional Review Board of Korea University (KUIRB-2019-0306-01). All study participants voluntarily assented, and their legal guardians consented to their participation in the study.
Development of a food literacy conceptual framework and items for children and adolescents
A detailed description of the development of the conceptual framework can be found elsewhere [18]. Briefly, the conceptual framework was developed based on a literature review on food literacy measurement tools with the addition of a food system dimension [18]. This two-dimensional framework consisted of a literacy dimension and a food system dimension. Initially, the literacy dimension had three domains (functional, interactive, and critical literacy) and the food system dimension had eight domains (production, processing, distribution, planning and management, selection, preparation and cooking, intake, and disposal) [18]. The framework was revised through focus group interviews that included 12 older adults (≥ 65 years of age), 12 younger adults (19–64 years of age), and 12 children and adolescents (8–18 years of age) who reflected a balance between urban and rural area residents. An item (question) pool (total of 562 items) was generated from the 547 items determined by the literature review and the 15 newly composed life-stage specific items collected from the results of the focus group interviews. For instance, for this study in children and adolescents, items such as “I search recipes through various media,” “I usually willingly participate in preparing or cooking meals,” and “I try different foods that I am not used to eating every day” were included. Questions were then excluded if the meaning of one question overlapped with another question's, if the question measured characteristics limited to a narrow age range or specific gender, or if multiple questions measured the same domain. In the latter case, the question easiest to understand and that measured the broadest range of content was selected. A 5-point Likert scale was used to measure food literacy (strongly disagree=1 point, disagree=2 points, neutral=3 points, agree=4 points, and strongly agree=5 points).
Questionnaire validation
We confirmed the content validity of questionnaire with a Delphi survey of 15 food and nutrition experts. Each item was evaluated on a four-point Likert scale to calculate the content validity ratio (CVR) [2324]; a question was determined to be appropriate if its CVR was 0.49 or higher [23]. The questions evaluated as inappropriate were corrected according to the experts' suggestions, and the survey was repeatedly reviewed until all questions were valid.
To evaluate the face validity of the questionnaire, a pilot survey was conducted in ten children and adolescents aged 8–18 years. Participants were recruited through posters and online recruitment notices, i.e., convenience sampling. Interviews were performed to assess the clarity of the questions.
The main survey was conducted (online or offline) on 200 Korean children and adolescents aged 8-18 years old in August 2020. Participants were selected through convenience sampling. The appropriate sample size was determined according to statistical criteria that considered factor loading and the number of questions [2526]. An exploratory factor analysis (EFA) using a maximum likelihood analysis with a direct oblimin rotation pattern matrix was conducted to verify construct validity, thus determining the number and nature of the questionnaire's underlying factors. We measured sample appropriateness via the Kaiser–Meyer–Olkin (KMO) method and evaluated the factor analysis using Bartlett's test of sphericity and total variance explained. Using the EFA, each item was allocated to the factor with the highest factor loading. Items were deleted if they did not meet the inclusion criteria (i.e., factor loading < 0.4, communalities extraction < 0.4). Internal consistency and reliability for the total questionnaire and each factor were confirmed through Cronbach's alpha value (> 0.7) [27]. A confirmatory factor analysis (CFA) was conducted to test whether the data fit the hypothesized measurement model that was extracted by the EFA. The goodness of fit of the model was evaluated using various indices: the root mean square error of approximation (RMSEA), which tests the fit of the model to the covariance matrix, was considered to show an acceptable fit when the value was 0.05–0.08 and a good fit when < 0.05; the comparative fit index (CFI) was considered to demonstrate a good fit with a value of ≥ 0.9; and the relative χ2 (χ2/degrees of freedom) with a value of 3 or less was considered as acceptable [2829303132].
NQ score and assessment of subjective health
The survey included questions for NQ score and subjective health to evaluate dietary quality and overall health, respectively. The NQ score assesses overall diet quality and food behaviors [3334]; higher NQ scores denote healthier diet quality and food behavior. Subjective health was measured with the question “What do you usually think about your health?” Participants answered on a 5-point scale: 1 = very poor, 2 = poor, 3 = fair, 4 = good, and 5 = very good.
Linear regression analyses were used to assess the association of food literacy scores with NQ scores and subjective health. Crude analyses (Model 1) and an adjustment for age and gender (Model 2) were performed. All analyses were conducted using the Statistical Package for Social Sciences for Windows, version 24.0 (IBM Corp, New York, NY, USA).
RESULTS
Questionnaire development
Of the 562 items in the item pool, 530 items were deleted according to the exclusion criteria, resulting in 32 candidate items. Based on the focus group interviews, the items in the planning and management domain were reclassified and the planning and management domain was deleted.
Questionnaire validation
The Delphi study was conducted three times to reach a consensus. Two items were deleted during this process, resulting in a total of 30 items. In addition, items in the processing domain were reassigned to the selection domain during the Delphi survey. Therefore, the remaining 30 items were classified into 18 areas (three food literacy domains × six food system domains). In the literacy dimension, there were seventeen, seven, and six items corresponding to the functional, interactive, and critical literacy domains, respectively. In the food system dimension, there were five, three, nine, five, five, and three items in the production, distribution, selection, preparation and cooking, intake, and disposal domains, respectively. The questionnaire's content validity was confirmed by CVR (mean CVR: 0.86).
The pilot study to assess the questionnaire's face validity found that most items were comprehensible for the general public and could adequately measure food literacy. Some questions were rewritten to clarify their meaning, seven questions were edited with simpler or more specific vocabulary, and examples were added to four questions to increase understanding.
Table 1 shows the characteristics of the 200 children and adolescents that participated in the main survey. The participants were equally organized by gender and age group. The validity of the questionnaire was confirmed through the EFA, using the maximum likelihood method (Table 2). Eleven items were excluded due to communalities or factor loading values less than 0.4. Five factors were derived from the 19 items included in the final tool (Factor 1: selection, Factor 2: production, Factor 3: distribution, Factor 4: preparation and cooking, and Factor 5: intake). We confirmed that the KMO measure of sampling adequacy was appropriate (0.886) and that the Bartlett's test results were statistically significant (X2 = 1527.630, df = 171, and P-value < 0.001). The Cronbach's alpha for each of the five factors were all appropriate, i.e., above 0.7: Factor 1 = 0.848, Factor 2 = 0.765, Factor 3 = 0.790, Factor 4 = 0.728, and Factor 5 = 0.707. The CFA results indicated a desirable fit of the proposed models, with the CFI = 0.904, RMSEA = 0.068, TLI = 0.888, AIC = 9945.865, and BIC = 10150.360. The mean (± SD) food literacy score of the final 19 items was 60.0 (± 11.9), ranging from 19 to 88.
Table 1
Main survey participants' characteristics
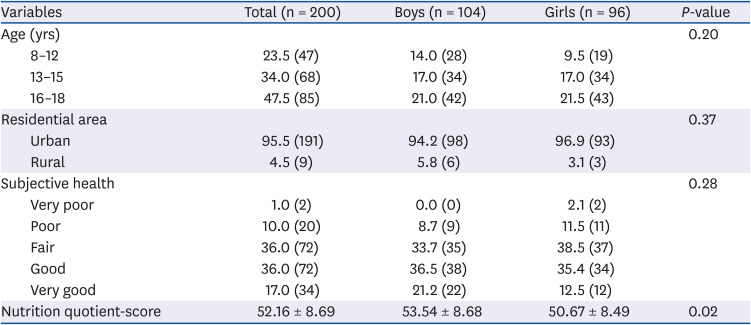
Table 2
Validity results from the exploratory factor analysis of the main survey (n = 200)
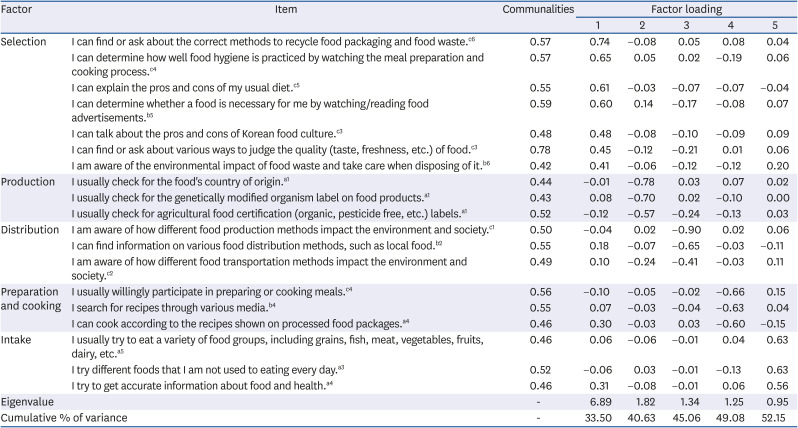
a,b,cDomain of literacy dimension (a: functional literacy, b: interactive literacy, and c: critical literacy); 1~6 Domain of food system dimension (1: production, 2: distribution, 3: selection, 4: preparation and cooking, 5: intake, and 6: disposal). Some questions may overlap with questions developed for adults [18].
Association of food literacy with NQ scores and subjective health
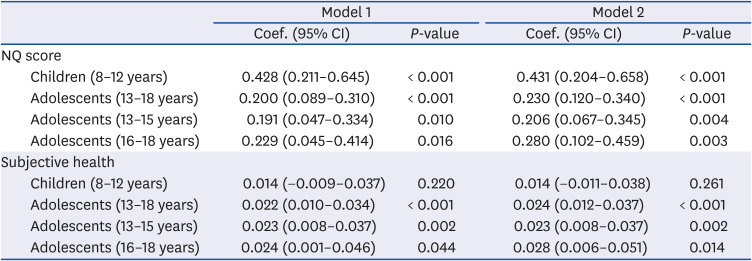
Food literacy scores were positively associated with diet quality as measured by NQ scores (Table 3). When food literacy scores increased by one unit, NQ scores increased by 0.428 and 0.200 in children and adolescents, respectively. That relationship remained positive after adjusting for age and gender. Subjective health was also positively associated with food literacy in adolescents, regardless of adjustment.
Table 3
Regression analysis of food literacy score with NQ score and subjective health (n = 200)
DISCUSSION
We developed a food literacy measurement tool for children and adolescents based on a two-dimensional conceptual framework consisting of five factors and nineteen questions. This tool includes the concept of the food system and expands its scope to encompass sustainability of the environment and society. We also confirmed that food literacy is positively associated with NQ scores in both children and adolescents and with adolescents' subjective health status.
The current food literacy tool for children and adolescents integrated a food system domain which may promote food-related sustainability in addition to food safety and nutrition [35]. As food-related choices and intake manifested during youth can last a lifetime [36], enhancing food literacy from a young age should be a focus of effective food and nutrition education. Food literacy with respect to not only nutrition and food safety but also the society and environment is essential even for younger individuals. Previous studies show that environmental behavior [37], as well as its antecedents [38] such as ecological awareness [3940] and environmental attitudes [41], begin to form and develop in early childhood. However, previous food literacy measuring instruments developed for children and adolescents did not incorporate domains related to the food system [42434445]. In Australian adolescents, four of the five top important aspects of food literacy chosen were related to food safety and nutrition [46], possibly due to the limited focus on food-related environmental sustainability in the classroom [15]. When we assessed Korean children and adolescents' awareness of environmental sustainability during the development of the current food literacy measurement tool, we found that their awareness seemed to be higher than that of Korean adults. As a result, items related to disposal were included in the selection factor, and the separate disposal factor was omitted. In contrast, the disposal factor was retained in adults [18]. This indicates that Korean children and adolescents consider food disposal when selecting which foods to consume. In addition, the distribution factor was included in the tool for children and adolescents, while it was omitted in the one for adults. This unique factor in the tool for children and adolescents indicates that more variation may exist among the younger generation in items related to food distribution, which may impact food literacy scores. Moreover, the item “I am aware of how different food production methods impact the environment and society” in the distribution factor was excluded from the tool for adults due to the EFA results, but was retained in the tool for children and adolescents. The current food literacy measurement tool may be used to identify gaps in and convey the importance of food knowledge, beliefs, and behavior that impact the society and environment to children and adolescents.
Many items in the present tool for children and adolescents were newly developed or assigned to different factors from those in the adult tool, reflecting the unique circumstances of younger individuals. For instance, several questions that belonged to the preparation and cooking factor in adults corresponded to the selection factor in children and adolescents [18]. This reflects that the preparation and cooking of foods are mostly adult tasks, while children and adolescents mostly select from already prepared foods. This may be owing to not only children's limited cooking capabilities but also to limited opportunities and time constraints for preparing and cooking food due to school-related activities and/or a lack of confidence in food preparation [46]. Thus, the three questions pertaining to the preparation and cooking factor in the current tool differ from those in the tool for adults. These questions were included based on the results of the focus group interviews and Delphi study to reflect the characteristics of children and adolescents concerning cooking-related capacity and attitudes. On the other hand, items that pertained to the production and selection factors in adults comprised an independent factor (distribution) in children and adolescents. Finally, the child and adolescent measurement tool included the question “I try different foods that I am not used to eating every day” in the intake factor. This question highlights the willingness of children and adolescents to actively rather than passively consume a variety of foods. This amenability to trying unfamiliar foods can also influence the selection of foods when the environment is at stake. The present tool was tailored to children and adolescents to capture their unique life stage and to incorporate the food system.
Although cross-sectional, the positive relationship between NQ scores and food literacy scores demonstrates that an increase in food literacy may increase nutrition-related diet quality in children and adolescents. The NQ scores and self-reported health measures are valid measures of diet quality [3334] and physical and emotional well-being [47], respectively, in children and adolescents. According to prior research on adults, improving food literacy is key to supporting healthy food selection and preparation and may lead to improvements in dietary quality and ultimately health outcomes [8]. Similarly, a few, but not all, observational studies have shown a positive relationship between food literacy and dietary intake in adolescents [48]. However, these studies did not include the concept of food system when assessing food literacy. In addition, only a few food literacy interventions have been implemented in children or adolescents, mostly targeting the cooking aspect of food literacy [17]. Most of these interventions lacked a theoretical basis, which may be the reason for their low success rate in influencing positive dietary behaviors [17]. Childhood and especially adolescence can present unique challenges for developing and implementing interventions due to the time crunch created by increased school workloads and the greater influence of peer pressure at those ages [7]. On the other hand, self-reported health status indicators show greater stability during early and middle adolescence [49], which may explain why the reported positive association between subjective health and food literacy in adolescents was not found in children. In line with the positive association between food literacy and diet quality, increased food literacy may heighten environment-related behaviors in children and adolescents. Well-designed interventions to increase food literacy, with additional emphasis on the food system, in children and adolescents are required.
Despite its brevity, the current food literacy measurement tool, which incorporates East Asian culture, was validated across a wide age range of growing individuals. Previous food literacy assessment tools for children or adolescents were developed for narrow age ranges. For example, the preschool-Food Literacy Assessment Tool (FLAT) was developed for 3- to 6-year-old children in Italy [42], while the Tool for Food Literacy Assessment in Children (TFLAC) [43] and Food and Nutrition Literacy (FNLIT) [44] were developed for those aged 9–11 years in the U.S. and 10–12 years in Iran, respectively. Another tool was recently developed for Danish adolescents 12–14 years of age [45]. Because the present tool has been developed and validated for subjects within a wide age range (8–18 years old), it is possible to assess food literacy across childhood development and to compare differences by age groups. The positive association between food literacy status and NQ score, which was developed for children and adolescents separately, indicates that this measurement tool can accurately convey food literacy for both life stages despite the differences between them. In addition, compared to the existing tools, which on average consist of 31 items, the present 19-item measurement tool is shorter, enabling a simple measurement of food literacy. In addition, food literacy may differ by geographical and cultural backgrounds while food systems may differ by country and region [4244], yet no measurement tool has been developed for Korean or East Asian children or adolescents [48]. Thus, a strength of the current validated tool is that it may more easily capture food literacy status in both children and adolescents in Korea.
This study is not without limitations. The survey participants were restricted to Koreans. However, to broaden the applicability of this tool, we included individuals of both genders and various ages and regions in the study. Although the questionnaire was validated in subjects aged 8–18, we were not able to validate the questionnaire in more detailed age groups due to the small sample size. For wider use, the tool should be translated and validated in children and adolescents of other countries. However, this tool is meaningful since it is the first to set a framework to assess food literacy that includes the food system in children and adolescents. It should also be noted that this study used convenience sampling when recruiting survey participants. This food literacy measurement tool can be employed to conduct future research on practical education and policy to increase food literacy and their influence on food-related behaviors.
We developed a food literacy measurement tool for children and adolescents based on a systematic conceptual framework that includes the food system. Food literacy and NQ scores were positively associated in both children and adolescents. This tool provides an understanding of the food literacy status of both children and adolescents that can serve as a basis for establishing effective strategies to solve various food-related problems and for achieving environmental sustainability associated with food-related behaviors.
 XML Download