

 PDF
PDF Citation
 Print
Print


INTRODUCTION
Fatty acids form cell membranes, and essential fatty acids play important roles in growth and development by regulating various functions in the body [1]. In addition, the consumption of energy-dense fats has been emphasized in children's diets to meet their energy needs because younger children have higher energy needs per body weight [2]. However, epidemiological studies have reported that the excessive intake of dietary fats early in life might be associated with increased risks of obesity and lipid disorders in childhood [34].
Obesity is an important health issue because it is a major risk factor for many chronic diseases. In particular, childhood obesity has shown a higher incidence rate compared to adulthood obesity, which is of substantial interest as it is a threat to the healthy growth of children [5]. Furthermore, childhood obesity can be a burden on public health resources because it often leads to adulthood obesity [67]. The risk of cardiovascular disease is increased by hypercholesterolemia, which is associated with the excessive consumption of saturated fatty acids (SFAs) [89]. This association has also been observed in children, which is especially important because atherosclerosis, a risk factor for cardiovascular disease, develops early in life [1011]. Therefore, the consumption of healthy levels of dietary fat starting in early childhood is important. To determine the appropriate recommendations for a healthy fat intake for children, a definition of the diet that can support optimal growth and health in children and an understanding of children's current consumption of fats are needed.
In previous studies examining the fat intake level of children, children in the Asian region had lower intake levels of total fat and SFAs compared to children in the Western region, although it is difficult to directly compare the results from each study, which had different time frames, dietary assessment tools, and subject characteristics [121314151617]. According to the NHANES reports from the US and Korea, children in the US and Korea obtained approximately 34% and 23% of their energy from their total fat intake, respectively, in 2015–2016 [1819]. In terms of changes in dietary fat intake, however, children from Asian countries had steeper increases in dietary fat intake, whereas children from Western countries showed no changes or decreasing trends in the intake of total fat or SFAs [12131415]. Recent reviews reported that children from different countries consistently had SFA intake levels above the dietary recommendation, but the level of polyunsaturated fatty acid (PUFA) intake, especially that of n-3 fatty acids (n-3 FAs), was below the recommended level [2021].
The maximum potential growth in height, normal weight for height, brain development, and proper blood lipid profile have been recognized as health issues related to fat intake in childhood. Thus, a healthy level of fat intake is defined as satisfying the intake levels of energy from fat, SFAs and PUFAs recommended in the dietary guidelines [2]. Although the prevalence of overweight and obesity among children have been increasing in Korea [22], it has been difficult to analyze the changes in the intake level and the trend in fat intake of Korean children partially due to the lack of a comprehensive fatty acid food composition database. Recently, however, such a database has been established [23]. Accordingly, this study examined the consumption trends in dietary fats, including different types of fatty acids, in children older than 3 yrs of age who had a stable intake of solid food. We expected that this study could provide important evidence that can be used to inform public health strategies for improving child health.
Go to : 
SUBJECTS AND METHODS
Data and study subjects
In this study, data from the fourth (2007–2009), fifth (2010–2012), sixth (2013–2015), and seventh (2016–2017) Korea National Health and Examination Surveys (KNHANESs) were used to identify secular trends in dietary intakes of total fat and fatty acid among Korean children. The KNHANES is aimed to assess and monitor nutritional health status of the Korean population and conducted by the Korea Disease Control and Prevention Agency every year. It uses a stratified, multistage probability sampling design, which results in the selection of nationally representative samples of the noninstitutionalized civilian Korean population. The KNHANES includes three parts of survey section: health interview, health examination, and nutrition survey. Detailed information on the KNHANES has been described elsewhere [24].
Based on the 4th, 5th, 6th, and 7th KNHANESs, the eligible subjects of this study were children who were aged 3–11 yrs and participated in the nutrition survey (n = 10,324). Among them, subjects who had no information on household income (n = 122) and those who reported an implausible energy intake (< 1st or > 99th percentile of energy intake, n = 204) were excluded. A total of 9,998 Korean children (5,206 males and 4,792 females) were included in this study. This study was conducted in accordance with the Declaration of Helsinki and was approved by the Korea Disease Control and Prevention Agency Institutional Review Board (IRB No. 2007-02CON-04-P, 2008-04EXP-01-C, 2009-01CON-03-2C, 2010-02CON-21-C, 2011-02CON-06-C, 2012-01EXP-01-2C, 2013-07CON-03-4C, and 2013-12EXP-03-5C). Written informed consent was obtained from study subjects' parents or guardians prior to their inclusion in the KNHANES.
Dietary assessment
The dietary data used in this study were based on a single 24-h dietary recall, which was conducted as part of the nutrition survey of the KNHANES. During the 24-h dietary recall, detailed information about all foods and beverages consumed by the interviewed individuals in the past 24 h were recorded by trained dietitians. The energy and macronutrient intake levels for each subject were calculated using the Food Composition Table established by the Korean Rural Development Administration [252627]. A database of the fatty acid contents of Korean foods was developed in 2013, and the KNHANES released the data on fatty acid intake of the subjects starting at the 6th KNHANES [23]. As the 4th and 5th KNHANES had no data on fatty acid intake, the fatty acid intake for each subject was calculated using the fatty acid content per 100 g of foods that appeared in the 6th KNHANES dataset [2829]. For the food items that did not appear in the 6th KNHANES, the fatty acid contents were replaced with calculated or imputed values using the fatty acid contents of similar Korean foods or of foods in the U.S. Department of Agriculture fatty acid database. For foods that was consisted of several food items, the fatty acid contents of the main food source for total fat were applied. Some food items that had very low fat contents and no reference data were considered as the content of fat was zero.
The intakes of total fat, SFAs, monounsaturated fatty acids (MUFAs), PUFAs, n-3 FAs, and n-6 fatty acids (n-6 FAs) were presented as grams (g) and the percentage of the total energy intake from each fatty acid (% of energy). To evaluate the total fat and SFAs intakes of study subjects based on recommended levels, the Acceptable Macronutrient Distribution Range (AMDR) was used: the AMDR for total fat is 15–30% of the total energy, and the AMDR for SFAs is < 8% of the total energy in children [2]. Proportions of individuals who exceeded the AMDR for total fat (>30% of energy) and SFAs (≥ 8% of energy) were calculated across the survey periods by sex.
Statistical analyses
All statistical analyses were performed using the Statistical Analysis Systems (SAS) software package, version 9.4 (SAS Institute, Cary, NC, USA). To produce estimates for all Korean children from the representative survey sample, all the data analyses in this study considered the complex sampling-design effect and used appropriate sampling weights. The intake levels of dietary total fat and fatty acids across the survey periods were presented as the means and standard errors by children's sex, age, living area, and household income. Multiple regression analysis was performed to evaluate linear trends in the intake levels of total fat and fatty acids across the survey periods after adjustment for sex, age, living area, and household income. The proportions of children who consumed total fat and SFA exceeding the AMDR were estimated across the survey period, and differences in proportions across the survey period were tested using the χ2 test. P < 0.05 was considered statistically significant.
Go to :
RESULTS
Characteristics of the study subjects
The characteristics of the study subjects are presented stratified by survey administration in Table 1. Across the survey administrations, the proportion of younger children aged 3–5 yrs significantly increased, whereas that of older children aged 9–11 yrs decreased (P < 0.0001). The distribution of children by household income significantly differed by survey administration (P < 0.0001). Over the survey administrations, the total energy intake and the percentage of energy from fat increased, but the percentages of energy from carbohydrates and protein decreased.
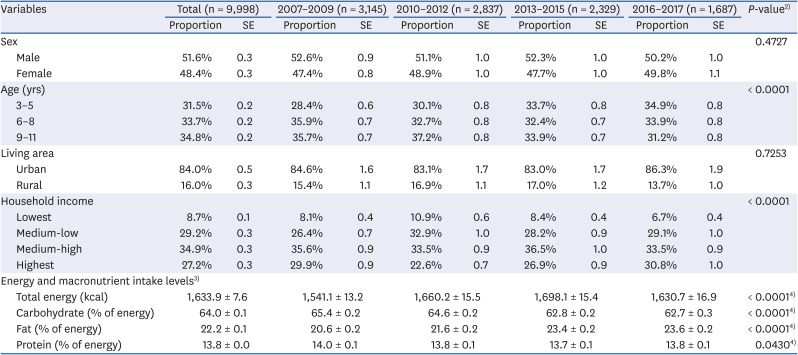
Table 1
Characteristics of the study subjects stratified by survey administration1)
1)The statistical analysis accounted for the complex sampling design effect and used an appropriate sample weight; 2)P-values were obtained from the χ2 test; 3)Energy and macronutrient intake levels presented as means ± SE; 4)P-values were obtained from the regression analysis.
![]()
Trends in the intake of total fat, SFA, and MUFA
Tables 2, 3, and 4 shows the trends in the intake levels of total fat, SFAs, and MUFAs during the 11-year period. For total fat, SFA, and MUFA, the amounts consumed in grams and the proportions of the total energy intake significantly increased between 2007 and 2017 in all subgroups stratified by sex, age, living area, and household income. From 2007 to 2017, the percentage of energy from total fat increased by 3%, of which 1.2% was from SFAs and 1.3% was from MUFAs.
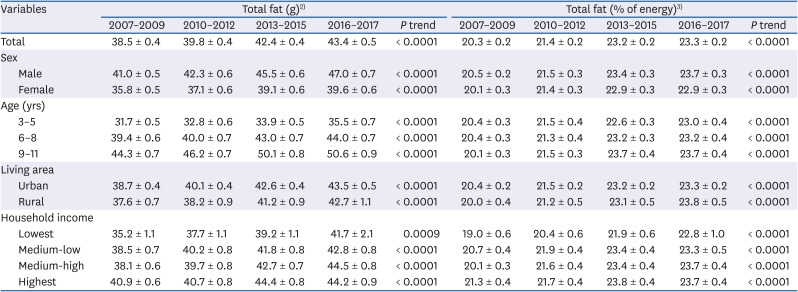
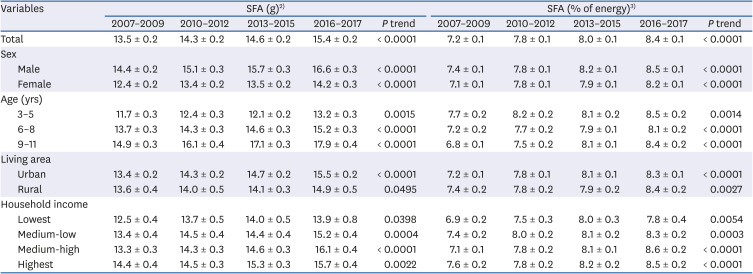
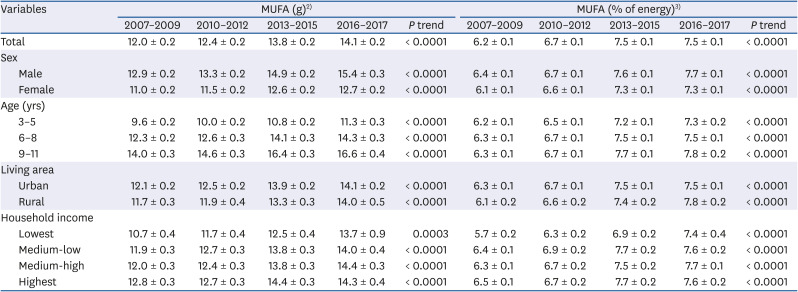
Table 2
Trends in intake levels of total fat among Korean children from 2007 to 20171)
Values are expressed as mean ± SE.
1)The statistical analysis accounted for the complex sampling design effect and used an appropriate sample weight; 2)Means, SE, and P trends were obtained from the multiple regression model after adjustment for sex, age, living area, household income, and total energy intake, where applicable; 3)Means, SE, and P trends were obtained from the multiple regression model after adjustment for sex, age, living area, and household income, where applicable.
![]()
Table 3
Trends in intake levels of SFA among Korean children from 2007 to 20171)
Values are expressed as mean ± SE.
SFA, saturated fatty acid.
1)The statistical analysis accounted for the complex sampling design effect and used an appropriate sample weight; 2)Means, SE, and P trends were obtained from the multiple regression model after adjustment for sex, age, living area, household income, and total energy intake, where applicable; 3)Means, SE, and P trends were obtained from the multiple regression model after adjustment for sex, age, living area, and household income, where applicable.
![]()
Table 4
Trends in intake levels of MUFA among Korean children from 2007 to 20171)
Values are expressed as mean ± SE.
MUFA, monounsaturated fatty acid.
1)The statistical analysis accounted for the complex sampling design effect and used an appropriate sample weight; 2)Means, SE, and P trends were obtained from the multiple regression model after adjustment for sex, age, living area, household income, and total energy intake, where applicable; 3)Means, SE, and P trends were obtained from the multiple regression model after adjustment for sex, age, living area, and household income, where applicable.
![]()
Trends in PUFA intake
Trends in the intake of PUFAs, including n-3 FA and n-6 FA, are described in Tables 5, 6, and 7. From 2007 to 2017, the absolute amount of PUFAs consumed, including n-6 FA, tended to increase in males but not in females. Younger children aged 3–5 yrs and 6–8 yrs had increased levels of consumption of PUFAs and n-6 FAs, whereas older children aged 9–11 yrs did not. With regard to the intake of n-3 FAs in grams, increasing trends were observed over the survey period only in males and 3- to 5-yrs-old children. An increase in the percentage of energy from n-6 FAs accounted for most of the increase in the intake of PUFAs.
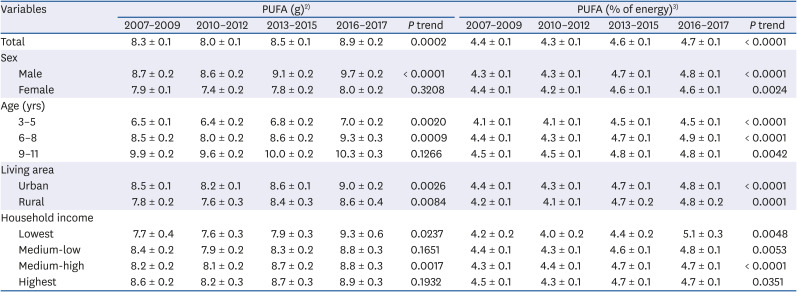
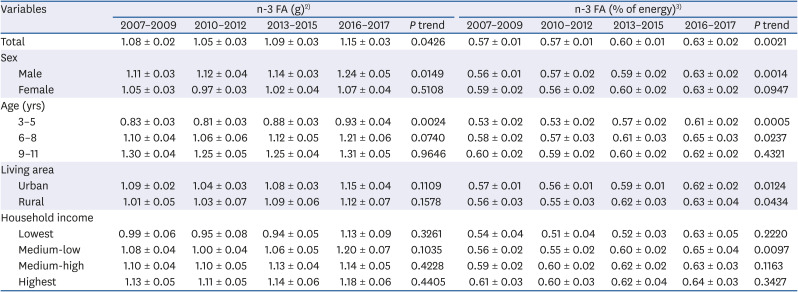
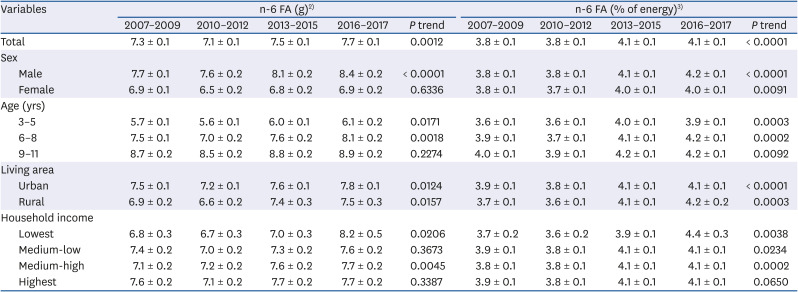
Table 5
Trends in intake levels of PUFA among Korean children from 2007 to 20171)
Values are expressed as mean ± SE.
PUFA, polyunsaturated fatty acid.
1)The statistical analysis accounted for the complex sampling design effect and used an appropriate sample weight; 2)Means, SE, and P trends were obtained from the multiple regression model after adjustment for sex, age, living area, household income, and total energy intake, where applicable; 3)Means, SE, and P trends were obtained from the multiple regression model after adjustment for sex, age, living area, and household income, where applicable.
![]()
Table 6
Trends in intake levels of n-3 FA intake among Korean children from 2007 to 20171)
Values are expressed as mean ± SE.
n-3 FA, n-3 fatty acid.
1)The statistical analysis accounted for the complex sampling design effect and used an appropriate sample weight; 2)Means, SE, and P trends were obtained from the multiple regression model after adjustment for sex, age, living area, household income, and total energy intake, where applicable; 3)Means, SE, and P trends were obtained from the multiple regression model after adjustment for sex, age, living area, and household income, where applicable.
![]()
Table 7
Trends in intake levels of n-6 FA intake among Korean children from 2007 to 20171)
Values are expressed as mean ± SE.
n-6 FA, n-6 fatty acid.
1)The statistical analysis accounted for the complex sampling design effect and used an appropriate sample weight; 2)Means, SE, and P trends were obtained from the multiple regression model after adjustment for sex, age, living area, household income, and total energy intake, where applicable; 3)Means, SE, and P trends were obtained from the multiple regression model after adjustment for sex, age, living area, and household income, where applicable.
![]()
For PUFAs and n-6 FAs, the amounts consumed in grams and the percentage of energy intake significantly increased from 2007 to 2017 among children living in both urban and rural areas. The percentages of energy from n-3 FAs showed increasing trends across the survey periods in all subgroups stratified by living area, whereas the intake of n-3 FAs in grams did not. By household income level, intakes of PUFAs and n-6 FAs in grams showed increasing trends in the lowest and medium-high groups but no significant changes in the highest and medium-low groups. The intake level of n-3 FAs did not change across the survey periods in all subgroups stratified by household income.
Trends in the prevalence of the excessive intake of total fat and SFA
Fig. 1 shows the trends in the proportions of children who consumed excessive amounts of total fat and SFA compared to the dietary guidelines. In both sexes, the proportions of children who consumed more total fat than the recommended level by dietary guidelines significantly increased from 2007 to 2017. With regard to the intake of SFAs, the proportion of children who consumed more than the recommended level by dietary guidelines was 36.9% in the period from 2007 to 2009 and 50.9% in the period from 2016 to 2017 (P < 0.0001). Both males and females showed significant increasing trends in the prevalence of the excessive intake of SFAs.
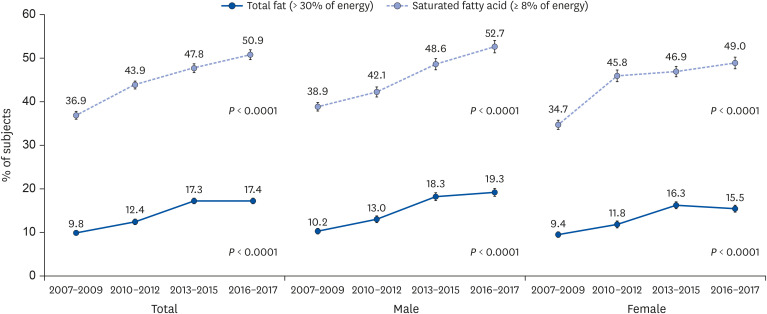 | Fig. 1Trends in proportions of individuals who exceeded the dietary guidelines for total fat and saturated fatty acid intake levels among Korean children from 2007 to 2017.The statistical analysis accounted for the complex sampling-design effect and used appropriate sample weights. P trends were obtained from the χ2 test to compare the proportions of subjects across the survey period.
|
Go to :
DISCUSSION
This study found that Korean children have tended to have increased total fat intake levels over the 11 years since 2007, regardless of sex, age, place of residence, and household income level. On average, the percentage of the energy accounted for by the intake of total fat increased by 3.0% from 20.3% in the period from 2007 to 2009 to 23.3% in the period from 2016 to 2017. This change is mainly due to the increase in the intake of SFAs (1.2% of the energy) and MUFAs (1.3% of the energy), while only 0.3% of the energy increase was due to PUFAs. These prominent increases in total fat, particularly in SFAs and MUFAs, were also observed in Korean adults and adolescents [2829]. Consistent with our findings, Chinese children aged 7–10 yrs consumed 48.3 g of total fat in 1991 and 63.1 g in 2009 (P trend < 0.0001) [12]. As a result of the increase in total fat intake, the proportion of Chinese children obtaining more than 30% of their energy from fat increased from 20.5% in 1991 to 51.8% in 2009 [12]. However, children from Western countries showed no changes or decreases in their intake of total fat and SFAs [131415].
A previous study analyzing the fat intake of adults observed a rapid increase in SFA consumption after the 2016 survey [2930]. However, in this study, children's fat intake steadily increased over the entire study period. Approximately 50% of children consumed more than 8% of their energy as SFAs from 2016 to 2017. Several reports demonstrated that SFA intake was positively associated with a risk of cardiovascular disease [89]. In the US study, positive correlations between blood cholesterol levels and total fat and SFA intake were observed both in childhood and adulthood [11]. Therefore, it is necessary to establish dietary habits that lower the risk of cardiovascular disease starting in childhood. In this regard, the continued increase in SFA intake levels and the fact that a large number of children now consume more than the recommended level is concerning.
Compared to the marked increases in SFA and MUFA intake in the current study, PUFA intake only showed a slight increase in Korean children. In terms of the average intake levels from 2016 to 2017, the PUFA intake of children in this study accounted for 4.7% of the total energy intake (8.9 g), and the average amount of n-3 FAs consumed was 1.15 g, which accounted for 0.63% of the total energy. This was lower than the recommended amount of n-3 FA, which would account for approximately 1% of the total energy [2]. In addition, there was no significant change in the intake of PUFAs in Korean adults and adolescents between 2007 and 2017 [2829]. PUFAs play a pivotal role in the normal development and functioning of brain tissue by being involved in a variety of neurological processes, from regulating cell membrane fluidity to controlling gene expression [1]. Thus, the inadequate intake of PUFAs can have a significant impact on brain function throughout the life cycle and is of relatively greater importance in the early stages of growth and development. Therefore, for Korean children, appropriate PUFA intake should be emphasized through nutrition education based on the food-based dietary guidelines.
Compared with the results from previous reports on dietary fat intake in children, there were some differences in the level of intake stratified by age and country. A study of 12- to 60-month-old children in the US showed that they consumed 0.9 g of n-3 FAs and 8.6 g of n-6 FAs daily [31]. Canadian children aged 4–8 yrs consumed 0.8 to 1.3 g of n-3 FAs and 7.4 to 7.7 g of n-6 FAs per day [3233]. In Australia, 2- to 3-yrs-old and 4- to 7-yrs-old children consumed 0.7 g and 0.9 g of n-3 FAs per day and 6.2 g and 7.6 g of n-6 FAs per day, respectively [34]. Comparing the values in similar periods, the intake of n-3 FAs in Korean children was higher than that in Western children, but the intake level of n-6 FAs was similar or somewhat lower. On the other hand, children aged 1–5 yrs in China were found to consume approximately 0.4 g of n-3 FAs and 2.2 g of n-6 FAs each day [35], which was much lower than the intake levels in this study.
In Korea, according to a study of children aged 3–5 yrs, the main sources of fat were milk, pork, soybean oil, eggs and bread [36]. Among these sources, milk (29.5%), pork (9.5%) and eggs (5.1%) were the main sources of SFAs. In addition, more than one-third of the SFAs consumed were obtained from milk, ice cream and other dairy products, such as cheese [36]. Soybean oil was the main source of PUFAs in Korean children aged 1–5 yrs, accounting for 20% of the total PUFA intake, and the intake of n-3 FAs was mainly in the form of vegetable oils, including soybean oil [36]. Children from countries with higher PUFA intake levels than Korean children consumed more PUFAs from dairy products, poultry, fish, and eggs [1531]. As food-based approaches to improving dietary fat intake might be more effective than other approaches, further studies examining the food sources of each fatty acid as well as identifying changes in food sources of fats are needed in this population.
This study has some limitations. The dietary data used in this study were the daily intake data collected via the 24-h recall method and do not reflect the usual intake levels of the subjects. Accordingly, in the analysis of the distribution of intake levels using data pertaining to the intake in one day, the proportion of subjects with overnutrition or undernutrition could be overestimated. In addition, the children's intake levels were based on surrogate surveys completed by the main caregivers in the home, which may not sufficiently reflect the intake that occurred when the children were cared for by other people or educational institutions outside the home. Nevertheless, this study was the first to examine trends in dietary fat intake among Korean children and present novel fat intake data in children that can be used to develop strategies to support the healthy growth of children and to manage the risk factors for chronic diseases throughout the life cycle.
Despite the fact that fat intake levels are increasing, the intake of PUFAs, which are an important source of essential fatty acids, has only changed slightly. On the other hand, the intake of SFAs, which might increase the risk of chronic diseases, has been steadily increasing. Therefore, from a public health point of view, it is necessary to prepare a multifaceted strategy to promote healthy levels of fat intake in growing children. Future studies are needed to elucidate the effects of dietary fatty acid intake on health outcomes, including physical growth and development among children.
Go to :
 XML Download