

 PDF
PDF Citation
 Print
Print


INTRODUCTION
In Korea, with rapid economic growth and improved living standards, problems related to nutrient deficiency have been resolved to a considerable extent; however, the excessive intake of specific foods and nutrients has become a new issue as these are considered as risk factors of chronic diseases such as cancers, cardiovascular diseases, and diabetes [1]. In addition, inadequate intake of certain foods (such as milk) or nutrients (such as calcium) remains a problem [2]. In a reflection of the nutritional problems faced by the Korean population, the Ministry of Health and Welfare developed and published dietary guidelines for the prevention of chronic diseases and for health promotion through maintenance of healthy dietary habits, which include information on the adequate intake of foods and nutrients and energy balance [345]. In addition, the 2015 Dietary Reference Intakes for Koreans (KDRI) introduced recommended dietary patterns such as the food balance wheels of the 6 food groups (grains; meat, fish, eggs, and beans; vegetables; fruits; milk and milk products; oils and sugars) to serve as a basis for appropriate intake of energy and nutrients and emphasized the importance of an overall diet composition [6].
Because a diet is consumed in a complex form rather as a single food or nutrient, it is difficult to assess the overall quality of the diet based only on the specific foods or nutrients consumed [7]. Therefore, the overall diet quality is assessed using certain tools such as the dietary pattern and dietary quality index, rather than assessing the adequacy of a single food and nutrient [8910111213141516]. For example, the United States (US) Healthy Eating Index (HEI) was developed based on the dietary guidelines for Americans and was modified according to the revised dietary guidelines for this population; this tool is used to assess the overall dietary quality of the US population [8910]. The Diet Quality Index (DQI) was developed to measure the dietary risk factors related to chronic diseases among the US population and amended to assess all aspects of adequacy, variety, and moderation of food and nutrient intake [11]. The Diet Quality Index-International (DQI-I), specifically developed to compare the quality of diet between countries, was used to assess the quality of diet in four aspects by adding an overall balance element to the above three fields [12]. In addition, the Healthy Diet Indicator was developed based on the international dietary guidelines for the prevention of chronic diseases by the World Health Organization (WHO); the Mediterranean Diet Score was developed to assess an individual's compliance to the Mediterranean diet guidelines and was used in several studies related to health [13141516].
In Korea, various indices have been developed to assess the overall dietary patterns and risk of chronic diseases [171819]. The Diet-related Health Risk Appraisal (D-HRA) was recently developed to determine an individual's level of chronic disease risk using a simple questionnaire. However, the D-HRA cannot be calculated using the existing epidemiological data such as those obtained in the Korea National Health and Nutrition Examination Survey (KNHANES) [17]. The Korean Diet Score was developed to assess an individual's compliance to the daily recommended serving of the 6 food groups (grains; meats, fish, eggs, and beans; vegetables; fruits; milk and dairy products; oils and sugars) using the existing epidemiological data; it was evaluated to be important in determining relevant health indicators, such as blood glucose and blood pressure [18]. However, since it focuses only on the proper intake of the six food groups, further review on the multidimensional aspects of the dietary guidelines is needed. Finally, the Korean Diet Quality Index (KDQI) was developed to evaluate the dietary balance throughout an individual's life course. The KDQI was used to address the nutritional problems of Koreans and to assess the dietary risk factors of chronic diseases based on the six food groups and dietary guidelines; the concurrent criterion validity was also examined. Revision of the KDQI is warranted to determine the current nutritional and health issues of the Korean population [19].
The KNHANES is a representative national cross-sectional study conducted in Korea that provides information on dietary habits, including food and nutrient intake, of the Korean population [20]. Therefore, if an index for evaluating the quality of the overall diet based on the KNHANSES data is developed, we can observe the status or trend in the overall dietary quality of the Korean population. For this reason, the Korea Disease Control and Prevention Agency (KDCA) and the Korean Nutrition Society developed the Korean Healthy Eating Index (KHEI) to assess the overall dietary quality of Korean adults using KNHANES data, and released the draft model of KHEI in 2015 [2122]. Since then, the draft model of KHEI has been updated by establishing a database for fatty acids in the 2013–2015 KNHANES, enacting the National Dietary Guidelines for Koreans [5] and the KDRI [6] in 2015. This study aimed to describe the development process of the final KHEI model and to assess the overall diet quality of Korean adults aged 19 years and older.
SUBJECTS AND METHODS
Study population
The KNHANES is an ongoing surveillance system that measures the health and nutritional status of the Korean population [20]. The KNHANES consists of a health interview, health examination, and nutrition survey. The survey was conducted among household members aged 1 years and over. The households were selected by stratified multistage probability sampling. Data on sociodemographic features such as education, occupational status, household income, and health-related behaviors such as smoking, drinking status, and physical activities were obtained via health interview. The anthropometric, biochemical, and clinical information related to chronic diseases were obtained during the health examination. The nutrition survey comprised an assessment of the dietary habits and a 1-day 24-h recall. During the dietary habit survey, information on meal frequency, dietary supplement used, and nutritional knowledge were collected. During the 24-h recall, participants' food intake 1 day prior to the survey was collected to calculate the food and nutrient intake. Health interviews and health examinations were conducted at mobile examination centers. During the nutrition survey, the participants were interviewed by trained dietitians at home within 1–2 weeks after the health interview and health examination survey. The 2013–2014 KNHANES was approved by the institutional review board for the KDCA (2013-07CON-03-4C and 2013-12EXP-03-5C), and 2015 KNHANES has been exempted from review about research ethics based on Bioethics and Safety Act. All participants in KNHANES signed an agreement to participate and consent to the utilization of the results.
This study used the data of the 2013–2015 KNHANES to develop the KHEI scoring criteria and to calculate scores of the KHEI among adults aged over 19 years. The final analysis included 16,069 adults aged over 19 years (6,712 men and 9,357 women) who participated in the 2013–2015 KNHANES.
Dietary assessment
The frequency of breakfast consumption indicated in the dietary habit survey and the food and nutrient intake calculated using the 1-day 24-h recall method were used to develop the KHEI. The frequency of breakfast consumption was surveyed by asking the participants about their weekly frequency of eating breakfast over the last 1 year; the respondents were asked to select from the following four categories: five to seven times a week, three to four times a week, one to 2 times a week, and almost never. Food and nutrient intake was calculated by surveying all foods consumed 1 day prior to the 1-day 24-h recall survey and by using the Standard Food Composition Table (8th Revision) [23] of the Rural Development Institute.
Although the food group assignment was based on the food grouping system of the KNHANES, some food groups such as vegetables were defined according to the KDRI items. Fruits were defined in the same way as in this study, because fruits contain 100% fruit juice; however, fruit juice containing sugar was excluded from the 2013–2015 KNHANES. On the other hand, according to the definition provided in the 2015 KDRI, seaweeds and mushrooms were included in the vegetable category, while nuts were included in the bean category. The soup prepared from vegetables, meats, and fish was excluded from the calculation of intake.
The frequency of each food intake that was used to determine the KHEI was calculated based on one serving size proposed by the 2015 KDRI:
The serving of the food group was calculated by summing the serving of each food consumed during the day. For example, one serving sizes of strawberries and apples were 150 g and 100 g, respectively. If the participant consumed 100 g of strawberries and 50 g of apples, the frequencies of intake of each fruit were 0.67 (100 g/150 g) and 0.50 (50 g/100 g) servings, respectively. The total serving of fruits consumed by the participant is 1.17, which is the sum of 0.67 and 0.50 servings of strawberries and apple.
Development of KHEI
The process of developing this model is presented in Fig. 1. The draft model of the KHEI was developed by the KDCA and the Korean Nutrition Society. The KHEI components were selected based on the Dietary Guidelines for Koreans, the 2010 KDRI, the 4th Health Plan 2020, and domestic and overseas previous overall dietary quality indices. These components were confirmed after analysis of the relationship between the candidate item and obesity and metabolic syndrome using the 2010–2012 KNHANES data. The KHEI scores were defined using the methods of scoring the domestic and overseas dietary quality indices [1012]. The detailed process of developing the draft model of the KHEI has been published [2122].
Fig. 1
The development process of the KHEI for adults.
Primary selection of component based on previous overall dietary assessment tools, Dietary Guidelines for Koreans, KDRI, and the 4th Health Plan 2020. An analyses of relation between primary selection components and obesity, abdominal obesity, and metabolic syndrome using 2010–2012 Korea Health and Nutrition Survey data.
KDRI, Dietary Reference Intakes for Koreans; KHEI, Korean Healthy Eating Index.

Since then, the KHEI components and scoring method were revised by establishing a database for saturated fats in the 2013–2015 KNHANES and enacting the common dietary guidelines and the 2015 KDRI, which were finally confirmed through a review by the advisory board consisting of nutritional professionals and epidemiologists.
Statistical analysis
All estimates were produced to represent the Korean population using sampling weights for the analysis of the KNHANES data. The Taylor series method was applied to the variance estimation to account for multistage sampling and unequally weighted design of the KNHANES. The difference in KHEI scores between the groups was tested using a linear regression model. All statistical analyses were performed using SAS version 9.4 (SAS Institute Inc., Cary, NC, USA), and SAS SURVEY procedures were used to account for the multi-stage complex sampling scheme. A P-value of < 0.05 was considered significant.
RESULTS
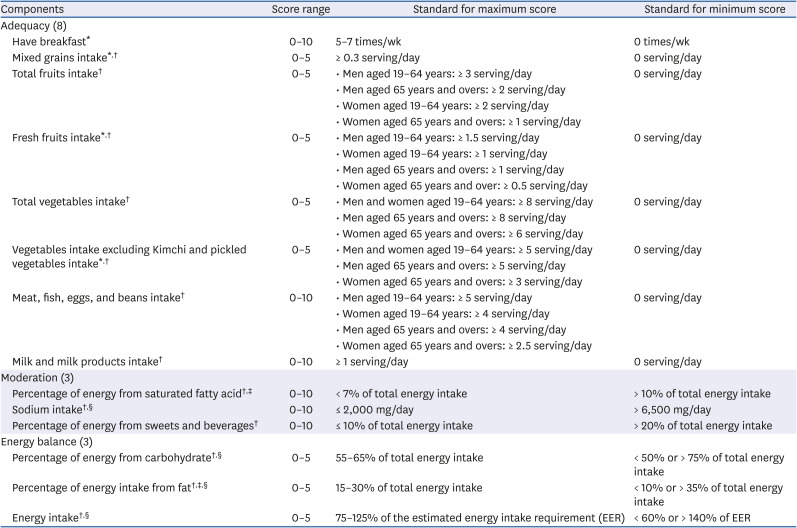
The final components, scoring, and minimum and maximum criteria for the dietary assessment index are shown in Table 1.
Table 1
Korean Healthy Eating Index components and lifecycle-specific standard for scoring
Components
The items of the final model were mostly similar to those of the draft, but the differences were as follows. The draft model consists of fruit intake including juice, fruit intake excluding juice, vegetable intake including kimchi or pickles, vegetable intake excluding kimchi and pickles, milk and dairy intake, protein food intake, ratio of white meat to red meat, whole grain intake, frequency of breakfast consumption, sodium intake, percentages of energy from foods that contain empty calories, percentages of energy from fat, refined grain intake, and percentages of energy from carbohydrates [22]. Among them, whole grain and refined grain intake was changed to mixed grain intake as only a few grains were classified as whole grains, and the dietary guidelines recommend eating mixed grains. The ratio of white meat to red meat, which was added as an alternative to fatty acid intake, was changed to fatty acid intake after establishing a database for fatty acids in the KNHANES. Finally, an energy intake item was added, considering the linear relationship between the total score of the KHEI and energy intake.
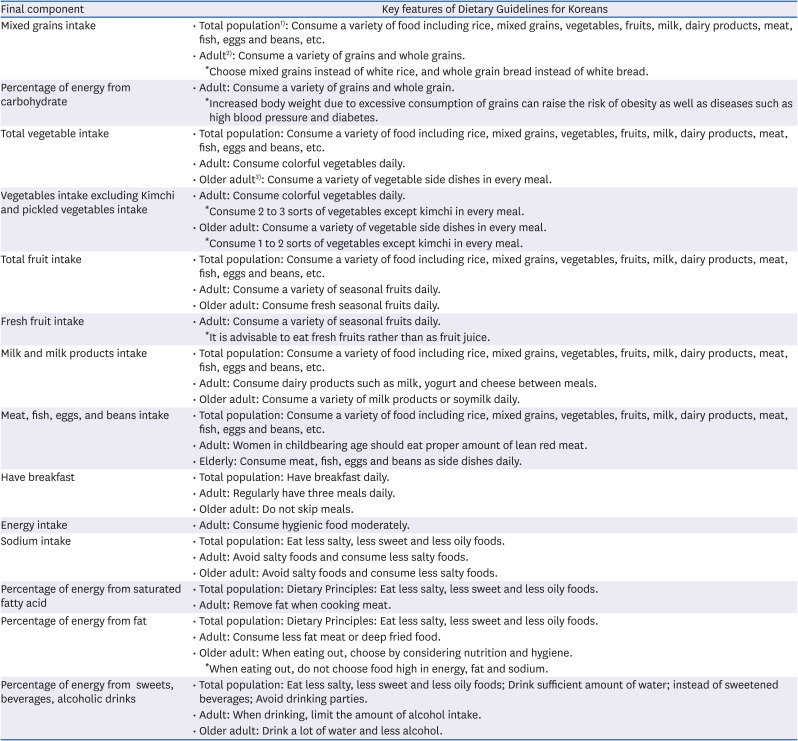
The final KHEI model consists of three categories: adequacy, moderation, and balance. The adequacy category evaluates whether the recommended food and nutrients are sufficiently consumed. The adequacy category consists of eight components: frequency of breakfast consumption; mixed grain intake; total fruit intake; fresh fruit intake; total vegetable intake; vegetable intake except kimchi and pickles; meat, fish, egg and bean intake; and milk and dairy product intake. Fruit intake consisted of the following two items: total fruit intake, which includes all fresh fruits, canned fruits, and dried fruits (except fruit juice), and fresh fruit intake based on the dietary guidelines. The vegetable intake items also consisted of 2 items such as total vegetable intake, which includes all vegetables, mushrooms, and seaweeds, and vegetable intake that excludes salted vegetables such as kimchi and pickles. The moderation category evaluates the restricted food intake and nutrient intake. The moderation category includes 3 components: saturated fatty acid energy intake ratio, sodium intake, and sugar and beverage energy intake ratio. In the final category, the balance of energy and macronutrient intake is assessed. The balance category consists of three components: the percentage of energy from carbohydrate and fat, and energy intake. The KHEI consists of 14 components, all of which are based on the dietary guidelines (Table 2).
Table 2
Key features of Korean Healthy Eating Index components mapped to the key dietary recommendations of the Dietary Guidelines for Koreans
Scoring
The total KHEI score was 100. Each component was scored 10 points with the same level of importance, but fruits and vegetables were provided a score of 5 points each as subcomponents. In Korea, mixed grains are not included as a subcomponent; however, because of the overlap with the carbohydrate energy intake ratio in the balance category, a score of 5 points was allotted. The fat energy intake ratio and energy intake in the balance category were allotted 5 points each for the same reason.
The highest and the lowest scores were set based on gender and age (age 19–64 years and over 65 years) in the 2015 KDRI [6]. Items without a daily recommended serving were set based on the dietary guidelines and food and nutrient intake distribution of Korean adults. In the adequacy category, the maximum score was provided when the recommended daily serving was met. If no intake amount was indicated 1 day prior to the survey, a score of 0 was assigned. However, as no standard criteria were established to measure breakfast frequency, mixed grain intake, fresh fruit intake, and vegetable intake except kimchi and pickles, the scores were assigned based on the following categories: 5–7 times a week, 10 points; 3–4 times a week, 6 points; 1–2 times a week, 3 points; and almost never, 0 points. For mixed grain intake, the mixed grain content in boiled rice with mixed grains was calculated (approximately 15 g) based on the recipe database of homemade meals from the KNHANES, and the frequency was set by assuming that two meals a day included boiled rice with mixed grains (15 g × 2 meals/weight per serving of grains in 2015 KDRI [90 g] = 0.3 serving a day). For fresh fruit intake, half of the recommended serving was set as the standard for calculating the maximum score by considering the dietary guidelines that recommend fresh fruit intake rather than fruit juice intake. The standards of maximum score of vegetable intake except kimchi and pickles was set by excluding 3 serving from the recommended serving of vegetable, reflecting the characteristics of a typical Korean, who consume kimchi every meal.
In the moderation category, a maximum score was assigned to intake below the recommended criteria. The minimum score for sodium was 6,500 mg or more, which is an approximation of the 85th percentile value (6,300 mg) of patients aged 19 years and older in KNHANES 2013–2015. The minimum score for the percentage of energy from saturated fatty acids was set to 10% and higher, because the 85th percentile value of Korean adults (9.1%) was lower than the intake level recommended by the WHO/Food and Agriculture Organization (FAO) (10%) [24]. For the percentage of energy from sugars and beverages, intake below 10% of the lower limit of the sugar intake (10–20% total energy intake) recommended by the 2015 KDRI was set as the minimum score, while intake more than 20% of the upper limit was set as the maximum score.
In the balance category, the standards of maximum scores were set based on the recommended intake by the 2015 KDRI, while the minimum score was set by considering the intake distribution of Korean adults (15th percentile and 85th percentile values). The standard of lowest score for the percentage of energy intake from carbohydrate items was below 50% or over 75% based on the 15th percentile value (53.1%) and the 85th percentile value (77.8%) of the percentage of energy intake from carbohydrates among Korean adults. The 15th percentile value of the percentage of energy intake from fat was 9.9%, but the 85th percentile value was 30.1%, which is lower than that recommended (35%) by the WHO/FAO [24]. Based on this, the minimum percentage of energy intake from fat items was set to < 10% or > 35%. Energy was assigned the maximum score if the ratio to energy intake and estimated energy requirement (EER) was within 75–125% or the minimum score if it was below the approximation of the 15th percentile (61.2%) and the 85th percentile (137.4%) of the ratio to the energy intake and EER of Korean adults, which were below 60% and exceeded 140%, respectively.
If the intake of food groups or nutrients was within the minimum and maximum range, scores were assigned based on the recommended criteria. For example, the recommended serving of the total fruit intake among men aged 19–64 years is three servings per day. However, if only 2 servings were consumed per day, a score of 3.33 (5 × 2/3 servings) was given.
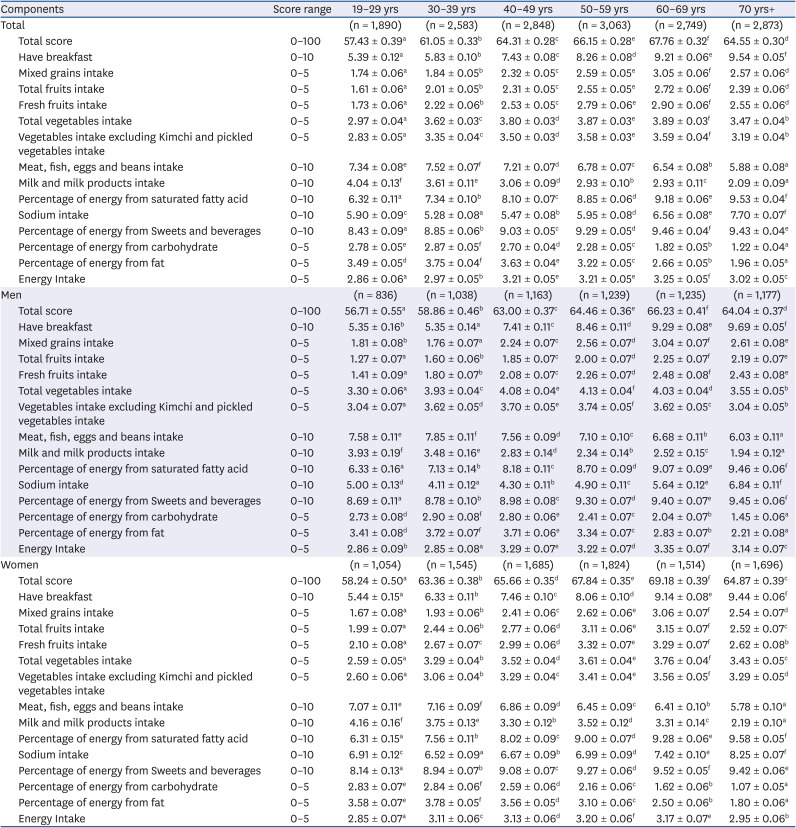
KHEI among adults aged ≥ 19 years in KNHANES 2013–2015
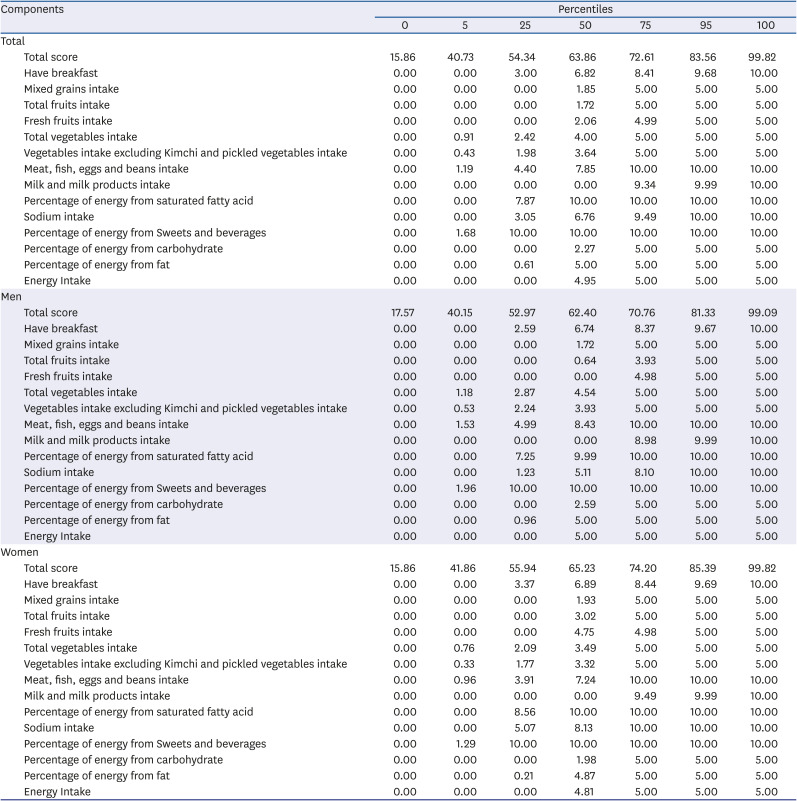
The total KHEI score of Korean adults was 63.2 out of 100, and none of the 14 components reached the maximum scores (Table 3, Appendix 1). Among the components of KHEI, the sugar and beverage energy intake ratio and the saturated fat energy intake ratio were close to the maximum score, with 9.0 and 8.1, respectively, but milk and dairy product intake garnered the lowest score (3.2 out of 10); moreover, mixed grain intake, total fruit intake, fresh fruit intake, and carbohydrate energy intake ratio garnered less than half of the maximum scores.
Table 3
Scores of the Korean Healthy Eating Index among Korean adults above 19 years old in the Korea National Health and Nutrition Survey VI (2013–2015)
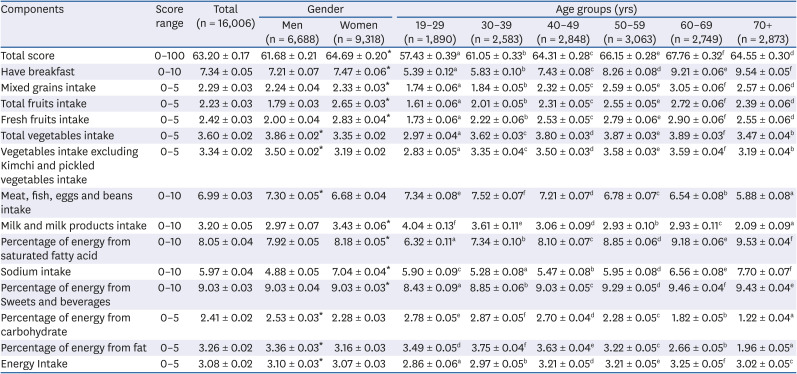
The total KHEI score for men was 61.7, which was lower than that of women (64.7). Women showed higher scores for breakfast, mixed grain, fruit, and milk intake in the adequacy category and the three components in the moderation category than men; by contrast, men showed higher scores for vegetable and meat, fish, egg, and bean intake in the adequacy category and the three components in the balance category than women. By age group, those in their 20s and 30s showed the lowest scores (57.4 and 61.1, respectively); the total scores were higher (67.8) in participants aged 60–69 years, but gradually declined in those aged 70s and older. The scores for meat, fish, egg, beans, milk, and dairy product intake were higher in participants in their 20s (who had the lowest total score) than in those in older age groups; however, they had lower scores in breakfast, mixed grain, fruit, and vegetable intakes in the adequacy category; saturated fatty acid intake and sugar and beverage intake in the moderation category; and energy intake in the balance category. Although their total scores were higher than those of the 20s group, the 30s group obtained the lowest score for sodium intake. In patients aged 70s or older, the total score was relatively higher than that of younger age groups; in contrast to the 20s group, the scores for milk and dairy product, and meat, fish, egg, and bean intake were the lowest, and the percentage of energy intake from carbohydrates and fats in the balance category was also the lowest. In the 50s and 60s groups, the total scores were high and the scores of most components were among the highest; however, similar to the > 70s group, the meat, fish, egg, and bean intake; milk and dairy product intake; and energy intake ratio of carbohydrates and fats were relatively low compared with those in the younger age group. The difference of the KHEI across age groups were similar for men and women (Appendix 2).
DISCUSSION
This study aimed to introduce the KHEI, which was developed based on the KNHANES, and to identify the overall diet quality of Korean adults. The KHEI consists of 14 components: eight evaluates the adequacy of recommended food and nutrient intake based on the dietary guidelines, three evaluates the moderation of restricted food and nutrient intake, and three evaluates the balance of energy intake.
Dietary characteristics and nutritional issues vary by country; therefore, this should be considered as an index to evaluate the overall dietary quality. The KHEI consists of foods and nutrients that are emphasized in Dietary Guidelines for Koreans. Also, to ensure continuous evaluation of the overall dietary quality of Korean adults, it was developed to calculate using data from the KNHANES. As such, the KHEI in this study is most similar to the US HEI [910], which is used to evaluate the overall quality of meals consumed by the American population using the National Health and Nutrition Examination Survey. It evaluates the balance category in addition to adequacy and moderation, which are similar to those of the DQI-I [12], developed for international comparison. The KHEI had almost the same items as HEI and DQI-I, but included the balance category and breakfast frequency, reflecting the nutritional issues of Korea. Nutritional issues in Korea vary according to gender and age. According to the 2016 KNHANES, the prevalence of insufficient energy intake among Korean adults aged 19 years or older is 31.7%, which is higher than the excess intake ratio (20.7%). In men in their 30s and 40s, the prevalence of excessive energy intake (29.0%) was higher than that of insufficient energy intake (25.0%). The prevalences of excessive energy intake in participants aged 19–29 years and > 65 years were similar (38.9% and 35.4%, respectively); however, the prevalence of excessive fat intake in participants aged 19–29 years was more than 40%. For participants aged 65 years and older, who usually consume carbohydrate-intensive meals, the prevalence of excessive fat intake was 4.4%, while the prevalence of insufficient fat intake ratio was more than 60% [2]. The balance category reflects such nutritional issues in Korea, with both insufficient and excessive intake. Another significant Korean dietary feature is the breakfast frequency. This feature reflects the increased prevalence of skipping breakfast among the Korean population. The percentage of Korean adults who skipped breakfast was 29.6% in 2016, which increased by 6.1% in 2007 [2], which is higher than that of adults in the US and Japan [2526].
Based on the developed KHEI, the total score of Korean adults aged 19 years and older was 63.2. The total score of our participants was higher than that of the American adults based on the HEI-2015, which is closely similar to our index. The total HEI-2015 scores of US adults aged 20 years and older in the 2011–2012 KNHANES were 57.2 for men and 59.7 for women [27], which were lower than those of adults aged 20 years and above in our study (61.8 for men and 64.8 women; data not shown). The differences in KHEI scores by gender and age were similar to those of overseas dietary quality indices such as the US HEI-2015 [2728]. In the KHEI, men had lower scores than women; in the 20s and 30s groups, their total scores were the lowest and therefore required improvement. Women had higher total scores than men, with high scores for most items, but they showed lower scores than men in vegetable intake; meat, fish, egg, and bean intake; and the three components of the balance category. In the 20s and 30s groups, their total scores were the lowest; their scores in most of the components were lower than those of older age groups, but their scores for meat, fish, egg, and bean intake; milk and dairy product intake; and energy intake ratio of carbohydrate and fat were higher. By contrast, the higher age groups had higher total scores and higher scores for components in the adequacy and moderation categories, but had lower scores in meat, fish, egg, and bean intake; milk and dairy product intake; and percentage of energy intake from carbohydrate and fat, where the 20-year-old group obtained higher scores. To increase the total scores, it is necessary to employ different intervention methods based on gender and age.
The KHEI was first developed to enable the continuous evaluation of the overall dietary quality of Korean adults by building components based on the dietary guidelines in Korea and using the KNHANES; however, it has some limitations. The Health Plan 2020 and KDRI suggest the recommended intake based on the sugar component; however, due to the lack of sugar database in the KNHANES, the percentage of energy intake from food containing sugar such as candy, chocolate, and beverages, the major source of added sugar intake, was included as a component. The dietary quality index has various components according to the dietary guidelines at the time. The HEI-2015 in the US includes added sugar as a component, but the Dutch HEI 2015 includes sweetened beverages and fruit juices as a component, which is similar to our index [2728]. Once the sugar database in the KNHANES is completed in the future, a review on changing the category of a component based on sugar intake is necessary. Second, because the dietary guidelines and the KDRI recommend that foods and nutrients should be adequately consumed daily, we calculated the KHEI using 1-day 24-h recall data instead of estimating it based on the daily intake. Therefore, it is possible that the scores were under- or overestimated. In the HEI-2015, which has the most similar aspects to our index, in order to compensate for the limitation of the 1-day 24-h recall method, the average intake of the population group was calculated using the population ratio method [27]; most dietary quality indices use the 24-h recall method for 2 days or more or the food frequency questionnaire for calculation purposes [121428]. It is possible to assess the mean total score of a population based on the 1-day 24-h data; however, to confirm the applicability of KHEI in determining the relationship between overall dietary quality and chronic diseases, future studies must include the calculation of KHEI that accurately reflects the usual intake.
The KHEI suggested in this study can be used to observe changes in compliance to the dietary guidelines and overall dietary quality. Likewise, most overseas dietary quality indices have no standard scoring system. Instead, they only evaluate the overall dietary quality by trend analysis and group comparison [2930]. In studies on chronic disease risks and its relation to death, KHEI is used to analyze the risk level based on the score obtained [1416].
The KHEI in this study was developed to continuously evaluate the overall dietary quality of Korean adults based on the KNHANES. Therefore, it can be useful in establishing and assessing nutritional policies, and is expected to be used in diverse epidemiological studies, such as those investigating the association of overall dietary quality and chronic diseases, to establish a basis for developing health policies. We plan to additionally publish the results of the validation of KHEI and to continuously update the KHEI according to the changes in dietary habits, revised dietary guidelines, and KDRI.
 XML Download