

 PDF
PDF Citation
 Print
Print


INTRODUCTION
Healthy eating in children should be established while they are still in primary to elementary schools to prevent malnutrition and to shape their eating habits as adults [1]. In 2013, 8 out of 10 Filipino children aged 6–12 yrs old did not meet their daily recommended intake requirements for energy while 1 in 4 consumed less than the recommended intake for protein, according to the Philippines National Nutrition Survey [2]. Of the total food intake, 43% came from cereals and cereal products. Fruit and vegetable consumption was recorded at only 5% and 6%, respectively. Milk and milk product consumption was at 8%—with older children consuming less whole milk and more milk products. The same survey revealed that the top ten food items commonly consumed by school-age children were rice, cooking oil, bread, eggs (chicken), chicken, sugar, crackers, cookies, noodles (instant), and hotdogs. Furthermore, an evaluation study found that their diet was inadequate in energy, fat, and most micronutrients [3]. Along with the poor quantity and quality of food, undernutrition is also affecting 3 out of ten children aged 5–10 yrs [4]. This situation contributes to poor child development (e.g., physical and mental development) eventually leading to less productive adults [5].
Filipino families typically maintain a close-knit relationship with their relatives. The stronger the ties within a family, the greater the chances of their eating meals together and influencing the nutrition knowledge and healthy eating habits of the primary gatekeepers (i.e., dietary decision-makers), particularly the mothers. Frequent activities and practices shared together as a family, such as the discussion of healthy dietary practices during mealtimes develop behaviors that may improve the individual health of household members. In a study by Moxley et al. [6], family solidarity promoted a better knowledge of health and food choices.
The family plays a significant role in the dietary habits of children. Their parents primarily provide their food and influence their intake. It is important to develop healthy eating while young because eating patterns as a child will ultimately lay the foundation for the adult attitude towards food and eating behavior. Parents, especially mothers, act as models who shape the child's attitude towards eating and the formation of healthy or unhealthy eating patterns [178]. A healthy eating habit for children is defined as a dietary intake with high consumption of fruits, vegetables, milk, rice, and fish [89]. Eating together as a family is correlated with higher fruit, vegetable, and dairy food consumption [7]. The attitude and behavior of children towards certain foods are also influenced by the environment, particularly at school. Time spent and food bought in school are not usually monitored by parents. To ensure that children have continuous access to healthy foods, several policies are being implemented.
In the Philippines, the Department of Education (DepEd) issued Department Order No. 13, Series of 2017 [10] entitled “Policy and Guidelines on Healthy Food and Beverage Choices in Schools and in DepEd Offices”. This order focuses on a system to categorize and evaluate the food items and beverages sold in schools. Foods and beverages were categorized as green (always available), yellow (maybe served once or twice a week), and red (not recommended). Cooked foods served in the school canteen were also expected to adhere to the categories and fall between green and yellow depending on the ingredients. This was followed by the issuance of DepEd's Department Order No. 39, Series of 2017 [11] entitled Operational Guidelines on the Implementation of School-Based Feeding Program (SBFP) for School Years 2017–2022. Food for Education programs, particularly school feeding, has been conducted by the DepEd since 1997 [12]. The target of SBFP was to 1) improve the nutritional status of all severely wasted and wasted children from kindergarten to grade 6 by at least 70% at the end of 120 feeding days; 2) increase classroom attendance by 85% to 100%; and 3) improve children's health and nutrition values and behavior. One of the activities to complement the SBFP is the Gulayan sa Paaralan Program—a school-based gardening program. This is implemented through the DepEd Memorandum No. 293, series of 2007 [13] to encourage the establishment of school gardens in public elementary and secondary schools and increase the SBFP's access to vegetable supply.
Likewise, several non-governmental organizations (NGOs) aid in reducing the magnitude of undernutrition among Filipino children. Most of these interventions provide supplementary feeding to children; usually conducted in schools and communities during lunch or breakfast. However, the role of the family—especially the child's caregiver, is often overlooked. What is eaten at a family's dining table greatly influences the food preferences of young children [14]. Meals familiar to children are most likely to be accepted [141516], a component useful during the design and provision of a feeding program. It is also vital that aside from feeding the children, their parents or mothers/caregivers should also be provided with the necessary knowledge to enable them to practice good nutrition [71417].
This present study investigated the effectiveness of an intervention intended for school children and their mothers/caregivers in terms of improving the nutrition behavior of the children. Two components of the nutrition intervention were pilot tested: 1) lunch feeding of schoolchildren using recipes based on the Philippines' Pinggang Pinoy® that provide the recommended energy and nutrient intake for one meal; and 2) nutrition classes for school children and their mothers/caregivers using modules focused on basic nutrition knowledge and practices which were developed specifically for the intervention. Pinggang Pinoy® is a food guide that shows the right food group proportions an individual should eat per meal. Both the recipes and modules were developed by the Department of Science and Technology's Food and Nutrition Research Institute (DOST-FNRI).
This paper determined the change in behavior among schoolchildren and specifically, the change in their food intake after the intervention using the modified Child and Diet Evaluation Tool (CADET).
SUBJECTS AND METHODS
Ethical considerations
Prior to implementation, the study protocol was reviewed and approved by the Food and Nutrition Research Institute Institutional Ethics and Review Committee (FIERC) on May 31, 2017, with FIERC protocol code FIERC-2017-007. Informed written consent from mothers/caregivers and assent from their underweight (UW) children were sought.
Study design
The study used a quasi-experimental design with 385 child-mother pairs categorized into 3 interventions (n = 287) and one non-intervention (n = 98). A minimum sample size of 92 UW children per group from 2 different school districts was set to detect a 20% difference in the UW prevalence (based on 90% power). To allow for a 9% drop-out, an additional 8 children were added per group, resulting in a group size of 100 children. Thus, the sample size was a total of 400 children divided into 4 groups (100 per group). From a total of 1,723 children screened, 385 were selected as eligible study participants for baseline data collection and inclusion in the study. The intervention groups were composed of: group 1-feeding only using DOST-FNRI-developed recipes; group 2-nutrition classes only using DOST-FNRI-developed modules; group 3-feeding and nutrition classes. The non-intervention group (group 4) received the current DepEd feeding and nutrition classes. The children participating in the study were enrolled in selected public elementary schools in Laguna, Philippines, specifically in the municipalities of Bay and Calauan that had a high prevalence of wasting and a large population of student enrollees. For monitoring of the intervention, trained project assistants were involved in the study areas.
The intervention
Nutrition interventions developed and implemented by the DOST-FNRI for this pilot study are described in detail below.
Feeding
Meals were provided to the children daily in school during lunch for 7 mon using a 4-week cycle menu—which was changed to a 3-week cycle menu from the third month of the intervention. The change was made after removing pasta recipes which recorded a liberal amount of leftovers. The recipes used were developed based on a food plate model adapted for Filipino use, or the Pinggang Pinoy®. This lunch was based on the reference age group of males, 6–9 yrs old, providing at least 1/5th of the recommended energy and at least 1/3rd of the recommended protein. The meals' costs ranged from Php 12.00 (USD 0.23) to Php 15.00 (USD 0.29). The costs were computed based on market prices in 2017.
Nutrition classes
Prior to conducting the nutrition classes for children, the teachers from the study areas had undergone appropriate training. A total of 29 lessons covering topics on basic nutrition with a focus on the consumption of various types of foods—go, grow, and glow foods and the inclusion of water in every meal were part of the modules. The importance of eating colored fruits and vegetables, foods high in protein, and nutrient-dense sources of energy were also discussed. Children attended the nutrition sessions that lasted 25 min each for a total of 60 h for the duration of the study. The trained project staff also facilitated a total of 9 nutrition classes for mothers/caregivers with each session lasting for 1 h. Similar modules were used for both the children and their mothers/caregivers.
Dietary assessment
This study utilized the CADET for measuring the change in the nutrition attitude and behavior of children. The CADET is a dietary assessment tool developed by Cade et al. [18] that can assess the diet of young children, particularly their fruit and vegetable consumption. It was primarily intended for use by non-specialists for a quick and simple assessment of The School Fruit and Vegetable Scheme (UK). It is a 24-h prospective tick list of foods consumed, with a retrospective breakfast—comprised of 3 parts: 1) for completion at home by parent or caregiver with 92 food options; 2) for completion at lunchtime in the school by a supervisor with 82 food options, and 3) for use in class right after break times with 20 snack foods and 7 drink options presented as pictures. In addition to the tick list, CADET has a second section where questions regarding the amount and types of food and drink usually consumed by children on an average per day are recorded. Studies that explored the associations of the home food environment [1] and school gardening program [19] with the fruit and vegetable intake of children have used CADET as a tool for measuring the children's dietary intake. CADET has also shown potential to be used as a diet screening tool to identify diets low in variety and quality [20]. Since the CADET was developed and tested among younger children aged 3–7 yrs, one study validated its utility in measuring nutrient intake among older children aged 8–11 yrs [21].
Several studies have utilized the 24-h tick box design of CADET, but for this study, the second section of CADET was modified and used as a means to measure the attitude and behavior change of participating children. The attributes of attitude in the CADET were categorized into 5 topics relating to how the mother perceives her own and her child's attitude towards 1) fruits, 2) vegetables, 3) milk, 4) water, and 5) sweet and salty foods. For dietary behavior, questions on the average amount of milk, rice, vegetable, fruit, and table sugar consumed by children in a day were answered by their mothers/caregivers.
The CADET questionnaire was given as homework to the children for their mothers/caregivers to fill out. Instructions were translated to the Filipino language for ease of understanding and use. Questions on parents' attitude and the perceived attitude of their children towards eating were answered as any one of the following: ‘strongly agree’, ‘agree’, ‘neutral’, ‘disagree’, and ‘strongly disagree’. Behavior-related questions examined the average consumption by children of certain food items (e.g., milk, rice, fruit, vegetable, and sugar).
Data collection
The socio-demographic profile of research participants and their households were collected through face-to-face interviews at baseline. The 2-day non-consecutive 24-h food recall method was used to determine the dietary intake of the participants. Mothers/caregivers were interviewed by trained nutritionist-dietitians. For safety reasons, the plate wastes of children during feeding were secured for disposal by the project staff in charge. The project assistants also recorded the attendance of children and mothers in nutrition classes.
Data analysis
Data processing and analysis used the Stata version 15 (Stata Statistical Software: release 15; StataCorp., College Station, TX, USA) with significance set at P-value < 0.05. The Pearson's χ2 test was used to evaluate relationships of categorical variables between study groups during the study periods. The means of the 4 study groups and the means between periods of each group were compared using 1-way analysis of variance (ANOVA) and the paired t-test, respectively. Significant results in ANOVA were further analyzed using the Scheffé test to identify which means among the study groups are significant. The McNemar's test was also applied to determine the significance of the differences per study group from baseline to endline.
RESULTS
Socio-demographic profile of children and mother participants
The data of the 339 child-mother pairs who completed the study were used in the analysis. Children who did not finish the study (n = 46) either transferred to another school or dropped out of school.
There were no significant differences among study groups in terms of the respondents' profile (relation to the child: χ2 = 18.11, P = 0.257; civil status: χ2 = 8.17, P = 0.917) and children's profile (gender: χ2 = 5.54, P = 0.136) as well as household profile except for the mean monthly per capita income. The majority of the respondents were aged 36–38 yrs with a high school level of education (> 60%; χ2 = 9.80, P = 0.634). More than half of the respondents were married, while a third were cohabiting with their partners. Households from the non-intervention group (group 4) had a significantly higher mean monthly income per capita (m = Php2,980.00 [USD57.17], SD = 2,630.00 [50.46], P = 0.02 than the intervention group with both feeding and nutrition classes (group 3) (m = Php2,290.00 [USD 43.94], SD = 2,070.00 [39.71], P = 0.02) (Table 1).
Table 1
Characteristics of respondents, households, and children by study group
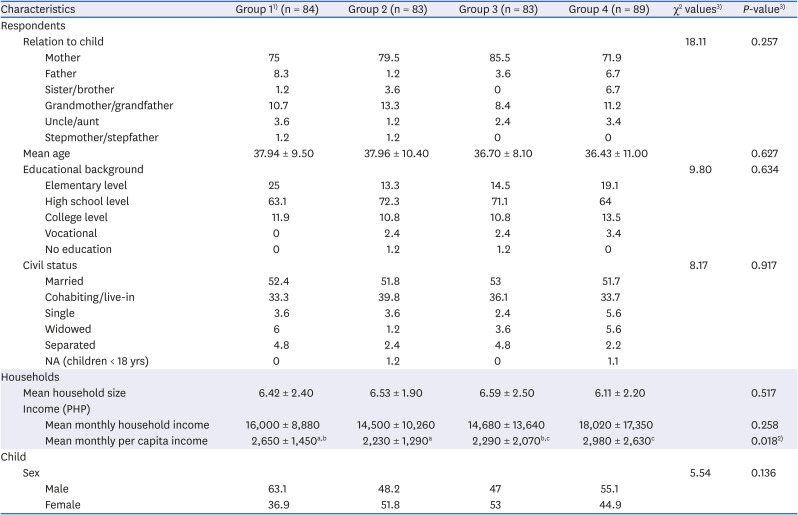
Values are presented as mean ± SD or percentages.
NA, not available; PHP, Philippine peso.
1)Group1, feeding only; group 2, nutrition classes only; group 3, feeding and nutrition classes; group 4, current DepEd feeding and nutrition classes.
2)Using Kruskal-Wallis test.
3)Pearson's χ2 (P-value) results: relation to child = 18.11 (0.257); educational background = 9.80 (0.634); civil status = 8.17 (0.917); sex of child = 5.54 (0.136).
a,b,cSuperscript letters are significantly different.
Attitude and behavior of children using modified CADET
Changes in the nutrition attitude and behavior of children as perceived by their mothers/caregivers were assessed using the modified CADET. Overall, the attributes included dealt with the intake of rice, fruits, vegetables, milk, water, and sweet and salty foods.
Attitude
The children brought the modified CADET questionnaire for their mothers/caregivers to answer at home. Their attitude was measured through varying scales of an agreement to a statement. The scales of the agreement were ‘strongly agree’, ‘agree’, ‘neutral’, ‘disagree’, and ‘strongly disagree’. Scores were assigned to each level of agreement with each questionnaire having a maximum score of 26.
At baseline and endline, the highest mean ± SD recorded—22.72 ± 2.17 and 24.63 ± 2.20, respectively—was from group 3 (feeding and nutrition classes). A post hoc test showed that the mean score of the feeding and nutrition classes (group 3) was significantly different (P = 0.048) from the feeding only (group 1) at baseline. However, no significant differences were noted in the mean attitude scores across study groups for the endline period (Table 2). On the other hand, the mean scores on attitude significantly increased from baseline to endline in all study groups (P < 0.05).
Table 2
Mean scores for CADET attitude by study group by period1)

Values are presented as mean ± SD.
CADET, Child and Diet Evaluation Tool.
1)The 5-option answer was reduced to 3-option answers: 1) combine ‘strongly agree’ & ‘agree’; 2) neutral; 3) combine ‘strongly disagree’ & ‘disagree’.
2)Group 1, feeding only; group 2, nutrition classes only; group 3, feeding and nutrition classes; group 4, current DepEd feeding and nutrition classes.
3)Scheffé test (P-value) = 0.048.
The attributes of attitude in the CADET questionnaire were categorized into 5 topics relating to how the mother perceives her own and her child's attitude towards 1) fruits, 2) vegetables, 3) milk, 4) water, and 5) sweet and salty foods.
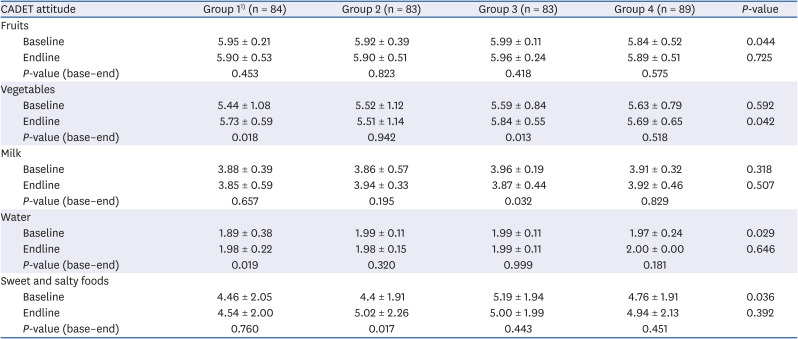
Results showed that, in general, the intervention groups obtained higher mean attitude scores than the non-intervention group from baseline to endline. Intervention groups that received feeding only (group 1) and both feeding and nutrition classes (group 3) showed a significant increase in mean scores on attitude towards vegetables (P < 0.05). Meanwhile, significantly higher mean scores on attitude towards water and sweet and salty foods were recorded among participating children in group 1 (Feeding only) and group 2 (nutrition classes only), respectively (P < 0.05) (Table 3). Across groups, a post hoc comparison showed significant differences between group 3 (feeding and nutrition classes) and group 4 (non-intervention) on attitude towards fruits at baseline (5.99 ± 0.11 and 5.84 ± 0.52, P = 0.041); and group 3 and group 2 (nutrition classes only) on attitude towards vegetables at endline (5.84 ± 0.55 and 5.51 ± 1.14, P = 0.048).
Table 3
Mean scores for CADET attitude by study group by period and by topic
Behavior
The modified CADET also covered questions on the dietary behavior of children as observed by their mothers/caregivers. Table 4 shows an increased proportion of children drinking milk at endline except in group 2 (nutrition classes only). However, applying McNemar's test showed that these improvements were insignificant in the intervention groups (group 1: P = 0.157; group 3: P= 0.317). Filled milk and full cream milk were among the types of milk that the majority of the children consumed. In terms of the amount of milk intake measured by the number of glasses, a higher percentage of children from the 3 intervention groups shifted from drinking 2 glasses (23.6–31.6%) at baseline (χ2 = 15.9875, P = 0.192) to 3 glasses (6.6–18.1%) of milk per day at endline (χ2 = 9.4965, P = 0.660). The opposite was observed among children in the non-intervention group.
Table 4
Modified CADET behavior on drinking milk by study group and period
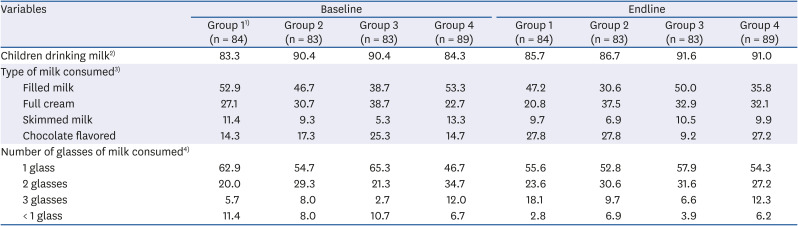
Values are given as percentages.
CADET, Child and Diet Evaluation Tool.
1)Group 1, feeding only; group 2, nutrition classes only; group 3, feeding and nutrition classes; group 4, current DepEd feeding and nutrition classes.
2)McNemar's test (P-value): group 1 = 2.00 (0.157); group 2 = 3.00 (0.083); group 3 = 1.00 (0.317).
3)Multiple response.
4)Pearson's χ2 (P-value) results: number of glass (baseline) = 15.99 (0.192); (endline) = 9.50 (0.660).
The participant's behavior regarding rice consumption and the use of bread fillings were also determined as shown in Table 5. More than half of the children in group 1 (feeding only) and group 4 (non-intervention) consumed one cup of rice at baseline (χ2 = 13.1123, P = 0.361) and endline (χ2 = 9.3364, P = 0.407). On the use of bread fillings, a significantly greater increase was observed among children in group 2 (nutrition classes only) from baseline to endline (12.1% points; P = 0.002). Increases in consumption among other intervention groups ranged from 7.2 to 8.4 percentage points, which were also significant (group 1: P = 0.008; group 3: P = 0.014). Cheese was largely used as bread filling across study groups and periods. Margarine and butter came in second and third, respectively—with 1 to 3 out of 10 children using them as bread fillings.
Table 5
Modified CADET behavior on rice consumption and use of bread filling by study group and period
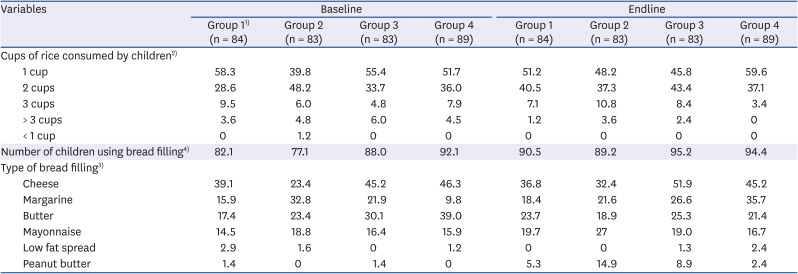
Values are given as percentages.
CADET, Child and Diet Evaluation Tool.
1)Group 1, feeding only; group 2, nutrition classes only; group 3, feeding and nutrition classes; group 4, current DepEd feeding and nutrition classes.
2)Pearson's χ
2 (P-value) results: cups of rice consumed by children (baseline) = 13.11 (0.361); (endline) = 9.34 (0.407).
3)Multiple response.
4)McNemar's test (P-value): group 1 = 7.00 (0.008); group 2 = 10.00 (0.002); group 3 = 6.00 (0.014).
The majority of the children were eating fruits and vegetables at baseline (children eating fruits: χ2 = 18.5903, P = 0.233; vegetables: χ2 = 9.8560, P = 0.073) (Table 6). At endline, more mothers reported that their children were eating vegetables (94.0–100.0%; χ2 = 23.5626, P = 0.073), with the increase only significant in group 3 (feeding and nutrition classes) (P = 0.046). Most of these children ate at least 3 tablespoons of vegetables in a day (27.2–43.4%). The highest proportions were observed among children who received both feeding and nutrition classes (group 3). Moreover, the increase in fruit consumption was also highest and significant (P = 0.025) in group 3 (feeding and nutrition classes) at endline (χ2 = 23.7431, P = 0.070). Half of the children from all study groups were eating at least one piece of fruit a day (46.5–51.4%).
Table 6
Modified CADET behavior on vegetable and fruit consumption by study group and period
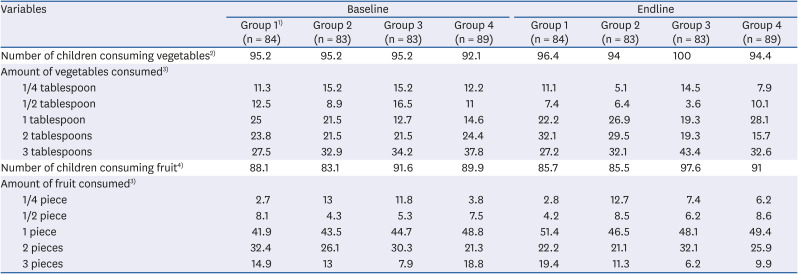
Values are given as percentages.
CADET, Child and Diet Evaluation Tool.
1)Group 1, feeding only; group 2, nutrition classes only; group 3, feeding and nutrition classes; group 4, current DepEd feeding and nutrition classes.
2)McNemar's test (P-value): group 1 = 1.00 (0.317); group 2 = 1.00 (0.317); group 3 = 4.00 (0.046).
3)Pearson's χ
2 (P-value) results: amount of vegetables consumed (baseline) = 9.85 (0.829); (endline) = 23.56 (0.073); amount of fruit consumed (baseline) = 18.59 (0.233); (endline) = 23.74 (0.070).
4)McNemar's test (P-value): group 1 = 2.00 (0.157); group 2 = 2.00 (0.157); group 3 = 5.00 (0.025).
Generally, the sugar consumption of children decreased significantly at endline (group 1: P = 0.001; group 2: P = 0.014) except for group 3 (feeding and nutrition classes) (P = 0.023) (Table 7). Most of these children consumed only 1–2 teaspoons of added sugar as reported by their mothers. The number of children consuming sugar in the intervention groups and non-intervention group at baseline (χ2 = 18.3656, P = 0.105) and endline (χ2 = 14.8035, P = 0.252) was independent of each other.
Table 7
Modified CADET behavior on sugar consumption by study group and period
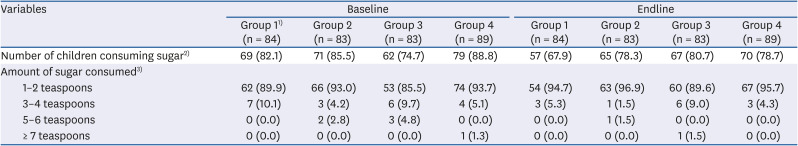
Values are presented as number (%).
CADET, Child and Diet Evaluation Tool.
1)Group 1, feeding only; group 2, nutrition classes only; group 3, feeding and nutrition classes; group 4, current DepEd feeding and nutrition classes.
2)McNemar's test (P-value): group 1 = 12.00 (0.001); group 2 = 6.00 (0.014); group 3 = 5.00 (0.025).
3)Pearson's χ
2 (P-value) results: amount of sugar consumed (baseline) = 18.37 (0.105); (endline) = 14.80 (0.252).
Food intake
Table 8 lists the 30 most commonly eaten food items by the children at baseline and endline, respectively. Rice, coconut oil (cooking oil), egg, powdered milk, and sausages were among the top 5 food items commonly consumed by children at baseline. Vegetables such as string beans (Sitao), carrot, horseradish tree leaves (Malunggay), cabbage, swamp cabbage leaves (Kangkong), and squash were included in the list.
Table 8
Top 30 food items commonly consumed by children at baseline and endline
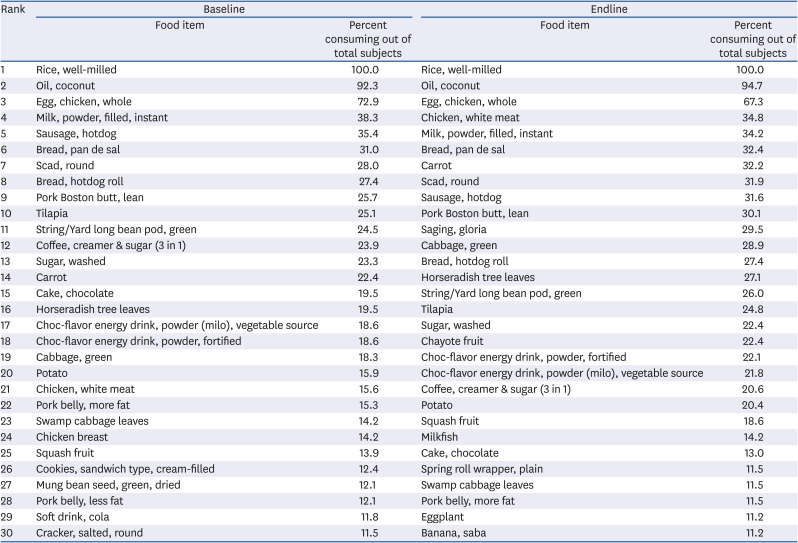
At endline, chicken meat (i.e., white meat) moved from the baseline's 21st rank to the top 5 along with rice, cooking oil, eggs, and powdered milk. Vegetables commonly consumed were the same at baseline and endline with the addition of eggplant and chayote. Banana (i.e., Gloria and Saba) was the only fruit included in the list ranking 11th (29.5%) and 30th (11.2%), respectively. Less than 11.2% of children consumed soft drinks at endline; thus, it was not included in the list. Milkfish was added as a commonly consumed fish in the list.
DISCUSSION
In response to the question “Do school-based nutrition interventions improve the eating behavior of school-age children?”, this paper presented 3 nutrition intervention approaches developed by the DOST-FNRI and one regular school-based intervention implemented by the DepEd which have resulted in improvements in the attitude and behavior of schoolchildren as perceived by their mothers. Findings revealed an overall improvement in the eating behavior of children in the intervention groups as shown by the increased number of children eating vegetables and fruits, more glasses of milk intake, higher vegetable intake, greater pieces of fruit consumed, and decreased consumption of sugar.
The study utilized the second section of the modified CADET in assessing attitude and behavior change as this has not been the focus of previous studies.
The intervention with feeding and attendance of the nutrition classes had positively influenced children's eating behavior.
The CADET primarily assessed the diet of children, particularly their fruit and vegetable intake [1820]. In the CADET questionnaire, the mothers were asked to respond by ticking the food items consumed by their children during mealtimes and to measure their average daily intake. The attitude and behavior of schoolchildren were assessed from the mothers/caregivers' perspective. Results showed that more mothers perceived better attitude and behavior in their children with regard to eating vegetables by the end of the intervention. This was evident in the presence of more vegetables in children's actual food intake at endline. This increase could be attributed to the meals provided to children during lunch as part of the intervention in the school. The school lunch feeding used a 3-week cycle menu for 16–17 weeks. A child participant with complete attendance in the intervention would have consumed the meals 5 times a week. Repeated exposure to food, particularly vegetables, helped in increasing the children's familiarity with these food items. A study conducted among preschool children in England [22] revealed that children who were exposed to tasting an unfamiliar vegetable (long white radish) developed a consistent liking for it and easily accepted it after 10 exposures. The nutrition education component of the study [22] increased the willingness of children to try the vegetable. In other studies, children who were repeatedly exposed to and tasted the target vegetables 8–12 times within a maximum of 10 weeks developed a liking and increased their consumption of the target vegetables [1623242526]. Vegetables used for these studies were unfamiliar to the children. They were either served raw or cooked using a different method. One study proposed 2 pathways to improve children's liking for vegetables: 1) changing the appearance, texture, or taste of vegetables by cooking them and 2) using repeated exposure strategies [27]. The more familiar children are with a particular food, the greater would be their liking for it [14]. Simply put, what children accept as food they would most likely eat. The same results were observed in a review where the author reassessed experimental and naturalistic studies that link children's food preferences with food exposure and acceptance [15]. Children's food experience through the school lunch may have helped in increasing their fondness for meals with vegetables, thus increasing their intake even when they are at home [222829]. These studies support the probability that a school lunch feeding intervention could help improve the nutritional status of children and aid in developing children's acceptance of vegetables, while the presence of the nutrition education component further enhanced the effect of the school lunch feeding.
In this study, the children's fruit intake had not improved. Consuming at least one fruit a day as reported in the modified CADET matched the presence of bananas in the list of commonly consumed foods by the end of the school lunch intervention. Bananas were the fruit included in the lunch meals of children due to their affordable price and abundance in the research areas. The improvement in fruit intake in this study could only be attributed to the provision of school lunch during the period of intervention. The continuous intake of fruits at least once a day after the intervention could not be assured. In a discussion paper, it was indicated that the majority of Filipino families will prioritize having rice and viands on their tables before buying other food commodities [30]. Rice forms a central part of Filipino dining tables, especially in Luzon – where the study areas were located. Cereals, such as rice and fish and fish products also shared the biggest household expenditures in rural communities [31]. One study [32] which investigated the dietary pattern in a Philippine village revealed that families resort to having one viand meal aside from rice due to the high cost of food. This viand which becomes the source of protein could either be fish, meat, or a poultry dish. Fruits may not be as easily included in the meals of children, at school and home, because of their price and availability [33]. The 2013 Dietary Component of the National Nutrition Survey revealed that Filipino children aged 6–12 yrs typically consume cereals and cereal products and fish, meat, and poultry which contributed 43.0% and 23.6% of the total food intake, respectively. Fruits only comprised an intake of 28 g/day—4.9% of the total daily consumption. The behavior of eating fewer fruits is apparent among this population. This is similar to a study among children aged 6 to 7 yrs conducted in English primary schools that explored the link between the various methods adopted by these schools to promote fruit and vegetable intake and the subsequent actual changes in the diet of children aged 6–7 yrs [33]. They found that nutrition activities such as gardening, counseling of parents, and lessons taught to children were associated with increased vegetable intake but not that of fruit. However, it should be noted that many studies are reporting the effectiveness of nutrition education in improving the fruit and vegetable intake of their target audience [223435363738]. For this study, the limitations of the capacity of households to purchase other food commodities like fruits should be accounted for. Even if these households understood the health benefits of eating fruits for their children, when accessibility and affordability are not addressed, their nutrition knowledge and attitude will not be translated into concrete behavior [3439].
The attitude of children towards milk varied in the study groups; however, their behavior as reported by the modified CADET showed more children drinking 2 or more glasses of milk especially in the group which received both feeding and nutrition classes interventions—albeit this change was insignificant. Milk drinking was also high among children in the non-intervention group which may be associated with higher purchasing power because of the group's higher household monthly income [40]. This is confirmed by the presence of milk (powdered) in the top 10 foods consumed by children. Coffee (instant) drinking, on the other hand, decreased. The information obtained from the nutrition classes component of the intervention could have provided clarity to the mothers/caregivers on the importance of nutritious beverages.
Children are genetically inclined to eating foods that taste sweet because it naturally signals a content of calories or energy [7]. In this study, adding sugar to children's powdered milk was observed as a household practice which explained why sugar (washed) is listed as a commonly consumed food. Washed sugar is a type of raw sugar that is light brown due to molasses or is the same as residue after minimal processing. However, free sugar in the diet of participating children was within 25 g or 6 teaspoons—as recommended by the American Heart Association (AHA) [41]. With sugar intake within the guidelines of the AHA, other low-calorie foods such as soft drinks, cookies, and crackers were excluded from the list of commonly consumed foods by children at the end of the study. This could be attributed to one of the key messages in the nutrition classes which says—“consume more nutrient-dense sources of energy”. The modified CADET captured the children's negative attitude towards sweet and salty foods and behavior towards sugar intake as reported by the mothers/caregivers.
The implementation of the intervention (feeding children and nutrition classes for them and their mothers/caregivers) proved to affect children's nutrition behavior. The measurement of attitude and behavior through the modified CADET may not have demonstrated consistent improvement in children since its intended use is to evaluate diet. The assessment using the modified CADET identified areas of concerns or topics (e.g., sugar consumption in the form of table sugar or other forms, salty food intake, milk consumption, and inclusion of fruits in the diet) which need to be strengthened in nutrition classes. The modified CADET could be an alternative instrument to assess the attitude and behavior of children.
The mothers' insights on children's attitudes and behavior as reported by the modified CADET were highly significant. Mothers are usually regarded as the ‘nutritional gatekeepers’ who hold responsibility for their family's food intake [42]. These mothers have the longest quality interaction with the children in terms of caring for and feeding them. They recognize their influence over their child's diet leading them to likely perceive positive food attitudes and behavior in their children, which may not always correlate with reality [42]. However, this study confirmed that the perception of mothers about their children's eating attitude and behavior was close to the actual foods commonly consumed by the children.
Again, there are various nutrition intervention programs implemented in the Philippines—by the government, private sector, and NGOs to address malnutrition among Filipino children and their families. Most of them provide supplementary food for children once a day. The importance of family involvement in improving the children's nutritional status should be emphasized. In conclusion, this study had shown that a package of nutrition intervention which comprised of feeding and nutrition classes, contributed to the substantial improvement of children's behavior and actual food intake of vegetable, milk, and sugar as measured by the modified CADET and the 24-h food recall.
Thus, the integration of interventions that combine feeding children following the Philippines' Pinggang Pinoy® recommendations and nutrition classes with the current Philippine SBFP of the DepEd in public elementary schools should be pursued. Subsequent intervention through nutrition classes should also highlight the role of the family in improving their children's food intake through various strategies. Lastly, a call for policies that will increase households' access to and consumption of fruits, vegetables, and other healthy foods is strongly recommended.
 XML Download