

 PDF
PDF Citation
 Print
Print


INTRODUCTION
As the number of overweight and obese people increases, more people are attempting to lose weight [12]. To help those willing to lose weight, many commercial weight loss programs (WLPs) have become available [3]. Commercial WLPs usually include diet management and exercise [4]. However, most programs' diet management focuses on limiting calorie intake and controlling nutritional balance rather than meal regularity, which is regarded as an important variable in obesity studies concerning public health [567].
Although many obesity studies have pointed out the importance of meal regularity [89], most limit their definition of meal regularity to meal skipping frequency. Therefore, to measure this, Likert scale-based survey methods were mostly used. Such surveys included questions such as the following: “Generally speaking, how many days did I eat breakfast between Monday and Friday?” [9]. Some empirical studies on meal regularity using longitudinal data based on the record of food diaries have been conducted [10]; however, the periods of the food diaries used in the analysis were too short to draw relevant and reliable results. Such limitations make it difficult to draw clear conclusions regarding the effects of meal regularity on weight loss success.
In this study, we conducted empirical analyses using data from food diaries. We defined “meal regularity” in terms of two concepts: meal time regularity (MTR) and calorie intake regularity (CIR).
MTR refers to how regularly people eat their meals (i.e., at certain times each day). For example, someone who always eats breakfast at 8 a.m. has greater breakfast time regularity than someone who eats breakfast at any time between 7 a.m. and 9 a.m. In recent studies, MTR was identified as a factor in weight loss, rather than other factors such as total calorie (energy) intake, diet, and energy expenditure [1112]. One study showed that keeping regular hours for meals increases clock gene expression and resets the circadian clock, which reduces risk factors for diseases such as obesity [13]. Similarly, Sherman et al. [14] found that rats that were fed a high-fat diet at regular times weighed much less than rats that were fed a high-fat diet at random times. Additionally, rats that were fed at regular times were lower in disease markers (e.g., arginase in the jejunum) than rats that were fed at random times. From these results, we can also conclude that keeping regular hours for meals decreases the negative effects of a high-fat diet in humans. Di Lorenzo et al. [15] and Karlsson et al. [16] also addressed the fact that shift workers who have difficulty keeping regular hours for meals tend to have a higher risk of becoming obese and contracting diseases.
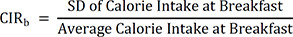
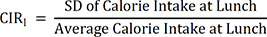
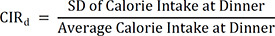
CIR refers to how regularly people consume a certain amount of calories at each meal. For example, someone who always consumes 500 kcal for breakfast is considered to have greater CIR for breakfast than someone who consumes anywhere between 400 and 600 kcal. The results of a previous study confirmed that both MTR and CIR reduce body mass index (BMI) [17]. Obese people tend to eat irregular amounts of food, keep irregular hours for meals due to binge eating, and have late-night meals, which leads to appetite loss in the morning [18]. Another study showed that calorie intake at breakfast easily becomes irregular, and increases in irregularity increase the risk of metabolic syndrome and waist circumference [11]. According to Jakubowicz et al. [19], even if the total calorie intake is the same, the amount of weight loss differs according to the calorie intake distribution among meals.
This study focused on the association between meal regularity (i.e., MTR and CIR) and weight loss. In particular, we investigated which factor was more significant for people attempting to lose weight and control meal regularity and actual calorie intake. This study provides guidelines regarding meal regularity for people who want to lose weight.
Go to : 
SUBJECTS AND METHODS
The WLP of this study
Subjects registered with the WLP tried to lose weight for at least four weeks. During the program period, participants attended the place where the WLP took place two or three times a week to manage their weight, such as equipment management or exercise. By committing to the WLP, the subjects were required to record information about food consumption using a mobile food diary application. In the diary, meal time, kinds of food, and amount of food were recorded. Subjects were also required to record any snacks, drinks, or alcohol consumed outside normal meal times. Because the data were recorded by the subjects themselves, it was not necessary to ask them to answer other survey questions about MTR and CIR. The recorded data were stored in a database, and the WLP's managers checked the reliability of the data daily.
Data collection
This study was based on the food diary data of participants in a commercial WLP that lasted 28–168 days (4–24 weeks) in 2015. Food diary data related to weight gain or loss were recorded by the subjects in real time. The study used food diary data from 900 subjects who filled in the food diary for at least 4 weeks (28 days). Data collected from the subjects was anonymized, and subjects signed a consent form permitting the use of their data for the analysis. This study was performed with approval from Gangneung-Wonju National University's Institutional Review Board (GWNUIRB-R2021-11).
The food diary data of 263 subjects were considered unreliable and/or irrelevant and thus excluded according to the following criteria: Only the daily data from food diaries that had complete records of breakfast, lunch, and dinner were used. In other words, daily data were used in which records of each of the three meals were recorded as “not eating” or “eating,” in addition to what kind of food was eaten at each meal. Only the food diary data of subjects who recorded more than four times a week while participating in the WLP were used. As a result, 637 of the 900 subjects' data were used. The average participation period in the WLP was 52.3 days, and the average number of daily meal records was 45.7 days, with an average rate of diary recording of 87.9% (Table 1).
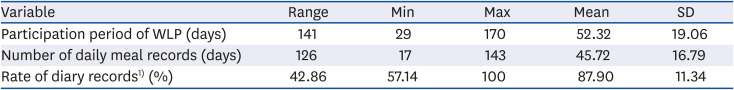
Table 1
Subject's participation period of WLP and daily meal records
WLP, weight loss program.
1)Rate of diary records = Number of daily meal records/Participation period of WLP.
![]()
All 637 subjects in this study were women. Women are more likely than men to try to lose weight [2021]. The resulting data collection limitations mean that most research on commercial WLPs has been conducted on women [22]. The 637 subjects ranged from 20–60 years of age, with an average of 33.2 ± 7.2 years.
Measures
Most weight loss studies define meal regularity as the frequency of meals and conduct surveys to record this frequency [823]. The present study calculated meal regularity, in terms of MTR and CIR, based on data from food diaries, which constitutes a new approach to defining meal regularity in the field of weight loss research. During the WLP, subjects recorded the time they consumed each meal, as well as the type and amount of food they consumed, in the food diary application. They did this by selecting food items presented in the application, which were based on information from the Korean Nutrition Society, including food classifications and calorie content [24]. The above data were used to derive meal times and calorie intake. The variables in this study were defined as follows:
Independent variables
1) MTR
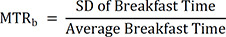
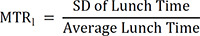
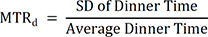
MTR for breakfast (MTRb), lunch (MTRl), and dinner (MTRd) was calculated as the coefficient of variation. The times at which meals were consumed were used to calculate the level of regularity. As these times were recorded in hours and minutes, minutes were divided by 60 for easier calculation (e.g., 7:30 = 7.5). A greater value for a variable indicates a greater degree of meal time irregularity.

Dependent variable: amount of weight loss (AWL)
Whenever subjects visited places where WLPs take place, their body weights (kg) were measured with weighing machines under the guidance of professional trainers. The amount of weight loss (AWL) was calculated in grams by subtracting the weight measured on the last day of the WLP from the weight measured on the first day.
Control variables
Control variables include factors that can affect weight loss, such as age (AGE); BMI on the first day of the WLP (BMIinitial); the number of in-person visits (VIT); the mean daily calorie intake from meals, including breakfast, lunch, and dinner (CALmeal); and the mean daily calorie intake from sources other than meals, including snacks, drinks, and alcohol (CALothers).
Statistical analysis
Independent t-tests were conducted to explore the differences between the regular and irregular subgroups. We also conducted multiple regression analyses to examine the effects of MTR and CIR on AWL. The statistical analysis comprised four regression models. Models 1–3 examined the effects of MTR at each meal (MTRb, MTRl, and MTRd) and CIR at each meal (CIRb, CIRl, and CIRd) on AWL. Model 4 examined the effects of CIRday on AWL.
In this study, models developed according to the type of meal (i.e., breakfast, lunch, and dinner) rather than MTR and CIR were used for the following reasons: Pilot analyses found that multicollinearity occurred in the initially suggested models depending on the two types of meal regularity. This is because the correlation coefficient between MTRb and MTRl was 0.385 (P < 0.001), the correlation coefficient between MTRb and MTRd was 0.432 (P < 0.001), and the correlation coefficient between MTRl and MTRd was 0.463 (P < 0.001). Similarly, the correlation coefficient between CIRb and CIRl was 0.490 (P < 0.001), the correlation coefficient between CIRb and CIRd was 0.552 (P < 0.001), and the correlation coefficient between CIRl and CIRd was 0.571 (P < 0.001). Eventually, 4 model tests were performed individually with each model, including each meal (breakfast, lunch, and dinner), to eliminate multicollinearity problems for this study. The IBM SPSS Statistics 23 program (IBM Corp., Armonk, NY, USA) and multivariable regression analysis were used. All the tests were 2-tailed, and statistical significance was defined as P < 0.05.
Go to :
RESULTS
General characteristics of subjects
Table 2 shows the general characteristics of the subjects according to obesity status. The characteristics of all 637 female subjects were as follows: age = 33.2 ± 7.2 years, height = 161.7 ± 4.8 cm, initial weight = 66.9 ± 10.1 kg, initial BMI = 25.6 ± 3.6 kg/m2, AWL = 7,137.9 ± 3,111.1 g, number of in-person visits = 22.3 ± 7.5, participation period of the WLP = 52.3 ± 19.1 days, breakfast time = 7.8 ± 0.7, lunch time = 12.6 ± 0.9, dinner time = 17.7 ± 1.2, breakfast calorie intake = 924.0 ± 401.8 kcal, lunch calorie intake = 877.2 ± 373.5 kcal, dinner calorie intake = 857.9 ± 374.0 kcal, daily calorie intake from others = 31.6 ± 46.0 kcal. Of the 637 participants, 49.1% were obese and 50.9% were not obese. In the obese group, the average age was 33.8 ± 7.6 years, the average height was 161.6 ± 4.5 cm, the average initial BMI was 28.4 ± 3.0 kg/m2, the average participation period in the WLP was 60.9 ± 19.9 days, and the average AWL was 8,724.7 ± 3,042.3 g. In the non-obese group, the average age was 32.6 ± 6.6 years, the average height was 161.9 ± 5.1 cm, the average initial BMI was 22.9 ± 1.3 kg/m2, the average participation period in the WLP was 44.0 ± 13.8 days, and the average AWL was 5,605.0 ± 2,306.9 g.
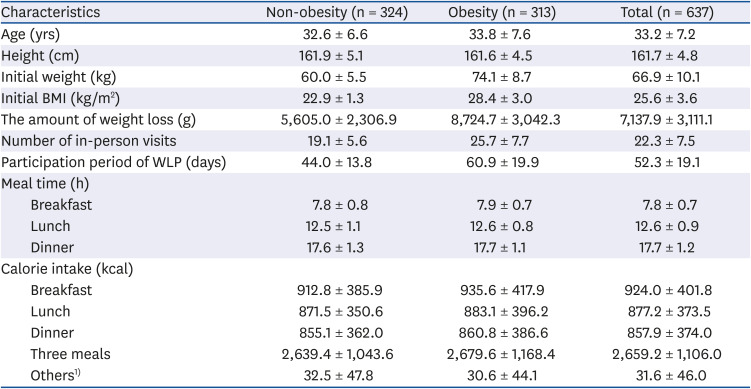
Table 2
General characteristics of 637 female subjects in WLP according to baseline obesity status
Values are stated as mean ± SE. Obesity status was divided as follows: obesity, BMI ≥ 25 kg/m2; non-obesity, BMI < 25 kg/m2. As the meal time is recorded in hours and minutes, a minute is divided into 60 for easier calculation. (e.g., 7:30 is 7.5).
WLP, weight loss program; BMI, body mass index.
1)The amount of calorie intake of others includes snacks, drinks, and alcohol.
![]()
Characteristics of the regular and irregular meal groups
The characteristics of the regular and irregular meal groups (according to MTR and CIR) are shown in Tables 3 and 4, respectively. We defined the regular meal time group (RMTG) as containing subjects who simultaneously satisfied the top 50% of MTR for each meal (breakfast, lunch, and dinner) and the irregular meal time group (IMTG) as containing subjects who simultaneously satisfied the bottom 50% of MTR for each meal. We defined the regular calorie intake group (RCIG) as containing subjects who simultaneously satisfied the top 50% of CIR for each meal and the irregular calorie intake group (ICIG) as containing subjects who simultaneously satisfied the bottom 50% of CIR for each meal.
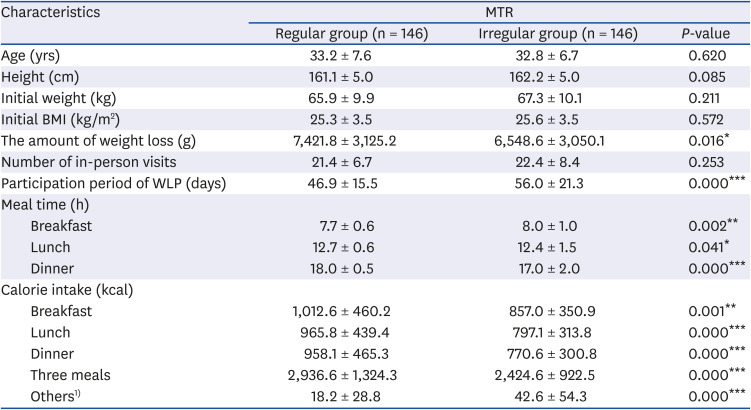
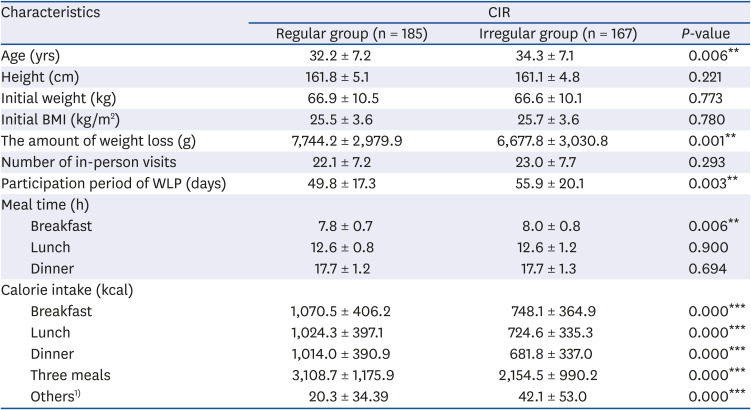
Table 3
General characteristics of subgroup subjects in WLP according to meal time regular status
Values are stated as mean ± SE. As the meal time is recorded in hours and minutes, a minute is divided into 60 for easier calculation. (e.g., 7:30 is 7.5). Regular group is subjects who simultaneously satisfy the top 50% of the MTR at each meal (breakfast, lunch, and dinner), while irregular group is subjects who simultaneously satisfy the bottom 50% of the MTR at each meal (breakfast, lunch, and dinner). P-values were derived from t-test.
WLP, weight loss program; MTR, meal time regularity; BMI, body mass index.
1)The amount of calorie intake of others includes snacks, drinks, and alcohol.
*P < 0.05, **P < 0.01, and ***P < 0.001.
![]()
Table 4
General characteristics of subgroup subjects in WLP according to calorie intake regular status
Values are stated as mean ± SE. As the meal time is recorded in hours and minutes, a minute is divided into 60 for easier calculation. (e.g., 7:30 is 7.5). Regular group is subjects who simultaneously satisfy the top 50% of the CIR of each meal (breakfast, lunch, and dinner) and three meals a day, while irregular group is subjects who simultaneously satisfy the bottom 50% of the CIR of each meal (breakfast, lunch, and dinner) and three meals a day. P-values were derived from t-test.
CIR, calorie intake regularity; BMI, body mass index; WLP, weight loss program.
1)The amount of calorie intake of others includes snacks, drinks, and alcohol.
**P < 0.01, ***P < 0.001.
![]()
In the RMTG and IMTG, the average AWL was 7,421.8 ± 3,125.2 g and 6,548.6 ± 3,050.1 g, respectively. In the RCIG and ICIG, the average AWL was 7,744.2 ± 2,979.9 g and 6,677.8 ± 3,030.8 g, respectively. Therefore, subjects in the RMTG tended to lose more weight than subjects in the IMTG (P < 0.05); Also, subjects in the RCIG tended to lose more weight than subjects in the ICIG (P < 0.01). Notably, the IMTG's participation period in the WLP was longer than that of the RMTG (MRMTG = 46.9, MIMTG = 56.0, P < 0.001); Also, the ICIG's participation period in the WLP was longer than that of the RCIG (MRCIG = 49.8, MICIG = 55.9, P < 0.01). Moreover, subjects in the RMTG and RCIG had higher calorie intakes at breakfast (MRMTG = 1,012.6, MIMTG = 857.0, P < 0.01; MRCIG = 1,070.5, MICIG = 748.1, P < 0.001), lunch (MRMTG = 965.8, MIMTG = 797.1, P < 0.001; MRCIG = 1,024.3, MICIG = 724.6, P < 0.001), and dinner (MRMTG = 958.1, MIMTG = 770.6, P < 0.001; MRCIG = 1,014.0, MICIG = 681.8, P < 0.001) than subjects in the IMTG and ICIG, respectively; however, their calorie intake outside the three main meals was lower (MRMTG = 18.2, MIMTG = 42.6, P < 0.001; MRCIG = 20.3, MICIG = 42.1, P < 0.001).
Meal time and calorie intake regularity
Three different regression models were proposed for each type of meal: breakfast (model 1: MTRb and CIRb), lunch (model 2: MTRl and CIRl), and dinner (model 3: MTRd and CIRd). Several control variables were added to the proposed models to determine the relevant effects of variations in meal time and calorie intake regularity on AWL. Table 5 shows the results of multiple regressions regarding MTR and CIR for breakfast, lunch, and dinner, respectively.
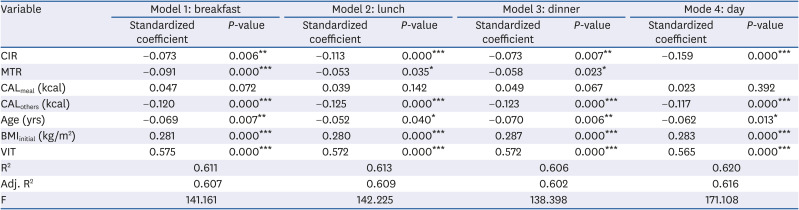
Table 5
Multiple linear regression models explain the amount of weight loss (g) with CIR and MTR as independent variables (n = 673)
Model 1 is the result of a multiple regression analysis of the effect of meal regularity for breakfast including MTRb and CIRb on AWL (g).
Model 2 is the result of a multiple regression analysis of the effect of meal regularity for lunch including MTRl and CIRl on AWL (g).
Model 3 is the result of a multiple regression analysis of the effect of meal regularity for dinner including MTRd and CIRd on AWL (g).
Model 4 is the result of a multiple regression analysis of the effect of meal regularity per day on AWL (g).
CIR, calorie intake regularity; MTR, meal time regularity; BMI, body mass index; AWL, amount of weight loss; CALmeal, mean of calorie intake from meals including breakfast, lunch, and dinner; CALothers, mean of calorie intake from others including snacks, drinks, and alcohol; BMIinitial, body mass index on the first day of the weight loss program; VIT, number of in-person visits.
*P < 0.05, **P < 0.01, ***P < 0.001.
![]()
A significant determinant of the AWL was MTR at breakfast (model 1: β = −2,576.526, P < 0.001), lunch (model 2: β = −1,511.447, P < 0.05), and dinner (model 3: β = −1,721.428, P < 0.05). CIR at each meal was also significant (model 1: β = −1,231.551, P < 0.01; model 2: β = −2,082.353, P < 0.001; model 3: β = −1,343.490, P < 0.01). As previously mentioned, a greater value indicates greater irregularity, so participants who ate their meals at regular times and consumed a consistent amount of calories every day lost more weight. While MTR had a significant effect on the AWL, daily calorie intake from meals (breakfast, lunch, and dinner) did not (model 1: β = 0.133, P > 0.05; model 2: β = 0.109, P > 0.05; model 3: β = 0.137, P > 0.05). Daily calorie intake from others (snacks, alcohol, and drinks) had negative effects on the AWL (model 1: β = −8.120, P < 0.001; model 2: β = −8.442, P < 0.001; model 3: β = −8.349, P < 0.001).
Age (model 1: β = −29.838, P < 0.01; model 2: β = −22.506, P < 0.05; model 3: β = −30.263, P < 0.01), initial BMI (model 1: β = 245.860, P < 0.001; model 2: β = 245.191, P < 0.001; model 3: β = 250.495, P < 0.001), and number of in-person visits (model 1: β = 239.605, P < 0.001; model 2: β = 238.619, P < 0.001; model 3: β = 238.274, P < 0.001) were also significant determinants of the AWL. Briefly, the AWL decreased as age increased, and the AWL increased as the initial BMI and the number of in-person visits increased.
Calorie intake regularity per day
We conducted another multiple regression (model 4) to examine the association between the CIR per day and the AWL. Again, we controlled for participants' age, initial BMI, number of in-person visits, daily calorie intake from meals, and daily calorie intake from sources other than meals. Table 5 shows the results. Participants who took in calories equally from each meal of a day lost more weight during the WLP (model 4: β = −3,675.510, P < 0.001). Age (model 4: β = −26.749, P < 0.05), initial BMI (model 4: β = 247.417, P < 0.001), and number of in-person visits (model 4: β = 235.480, P < 0.001) were also significant determinants for the AWL. In other words, the AWL decreased as age increased, and the AWL increased as the initial BMI and the number of in-person visits increased.
Go to :
DISCUSSION
Obesity and weight loss are still important issues in modern society, and many researchers have investigated effective strategies for losing weight [2526]. However, many weight loss methods focus on limiting calorie intake, which tends to be a harsh and unsustainable way to lose weight. Therefore, the aim of our study was to offer an alternative weight loss method: eating regularly, which has a positive effect on weight loss success. We found that the more consistent people are with eating each meal (breakfast, lunch, and dinner) at a certain time, the better they are at losing weight. The results of this study coincide with the most consistent results of the meal pattern study between irregular eating habits (e.g., skipping breakfast) and obesity [272829].
The findings also showed that people lost more weight when they ate a consistent amount at each meal. This finding is in line with studies suggesting that skipping breakfast increases a person's chances of overeating, which leads to weight gain [3031]. In particular, Jakubowicz et al. [32] explain these phenomena with “weight loss related genes,” which are disabled when people skip breakfast and eat lunch while blood sugar continues to rise after lunch.
Our findings have the potential to contribute to various practical and academic fields. First, eating meals at regular times and with consistent calorie content can be suggested as a strategy for sustainable weight loss instead of strategies that limit calories. Moreover, eating meals at regular times can not only help solve obesity problems but also improve public health by reducing the factors that cause various diseases, such as dyspepsia and hyperuricemia, as such regularity increases the expression of clock genes [33].
Second, this study expanded the definition of “meal regularity” to include three crucial metrics: MTR, CIR at each meal, and CIR per day. Many studies have shown that eating irregularly is correlated with obesity [89] and that eating regularly can have a significant effect on weight loss success [1213]. However, a precise definition of meal regularity was lacking. In addition, most studies have relied on fragmentary surveys of meal regularity, and few have consisted of empirical research [10]. This is one of the first studies to examine the effects of well-defined meal regularity on weight loss using the actual dietary records of people who have been on a WLP for 4 to 24 weeks.
Third, we identified two categories of calorie intake and used them as control variables: calorie intake from meals (breakfast, lunch, and dinner) and other calorie intake (snacks, drinks, and alcohol). Extremely reducing calorie intake does not improve weight loss; rather, it is more important to eat regularly in situations where calorie intake is appropriately restricted. According to our findings, subjects with a higher other calorie intake (i.e., those who snacked more) had less weight loss success. This is in line with many other studies that have shown that irregular snacking and drinking contribute more to obesity than normal meals [3435]. Therefore, avoiding irregular snacks, drinks, and alcohol is more important for losing weight than reducing the absolute amount of calories consumed at regular meals.
This study showed the importance of meal regularity; however, it had several limitations. For example, the effects of meal regularity on weight loss were only analyzed in situations in which subjects aimed to lose weight. Therefore, further studies should investigate whether meal regularity also results in weight loss in situations in which subjects aim to maintain their weight by consuming the recommended number of calories per day. Another limitation was that the amount of food was defined and analyzed as “calorie intake”; therefore, further studies should examine the regularity of the intake of nutrients (e.g., fat, protein, sodium, etc.). In addition, participants performing daily activities in parallel were the subjects of the study, so it is necessary to follow up on experimental studies in strictly controlled situations. Finally, the secondary data prevented the collection of information on diseases, smoking, menopause, and socioeconomic levels.
In conclusion, the present study found that the association between meal regularity (in terms of MTR and CIR) and weight loss was significant. The results indicate that it is important to consume consistent amounts of calories at regular times (i.e., at breakfast, lunch, and dinner) to achieve weight loss. Finally, according to the analysis, eating regularly tended to be more effective than drastically reducing calorie intake. Moreover, given the difficulty of maintaining long-term restrictions on calorie intake, meal regularity could be a crucial component of a sustainable alternative weight loss strategy.
Go to :
 XML Download