

 PDF
PDF Citation
 Print
Print


Introduction
Fixed restorations based on 3 mol % yttrium oxide stabilized tetragonal zirconia polycrystals (3Y-TZP) have become popular because its transformation toughening ability helps prevent crack propagation by increasing localized fracture resistance.
1
Notwithstanding the superior mechanical properties, the white color of zirconia restrict its use in highly esthetic areas. And that’s why zirconia restorations were first introduced in prosthetic dentistry as a core material and then layered by feldspathic porcelain. However, veneer chipping has been reported as frequent complication. The natural white color of zirconia with the veneer chipping problem has led to the development of tooth colored monolithic zirconia.
2
Recently, highly translucent monolithic zirconia with various shades has been introduced to eliminate the risk of chipping and achieve more natural looking properties.
3
However, using coloring metal oxide to obtain shade in 3Y-TZP has the potential to lead to crystallographic and microstructure changes that could in turn affect the mechanical properties of 3Y-TZP.
4
Previous studies have reported that there was significant difference in flexural strength between colored and uncolored zirconia.
5,6
Fracture toughness and strength was considerably sacrificed in highly translucent zirconia.
7
The processes that enhance translucency, and the added coloring elements, have been shown to affect the mechanical properties of the material. Strategies for improving the optical performance of 3Y-TZP include increasing yttria content, microstructure variation, reducing the alumina dominant and creating a nanometric microstructure.
8
Even small changes in these factors can cause significant differences in the microstructural and physical properties. Nevertheless, few studies investigated the influence of shade on the physical properties of highly translucent monolithic zirconia.
Therefore, the aim of this study was to evaluate and compare flexural strength and reliability of highly translucent colored zirconia. The null hypothesis was that there is no difference in flexural strength between colored and uncolored highly translucent zirconia.
Materials and Methods
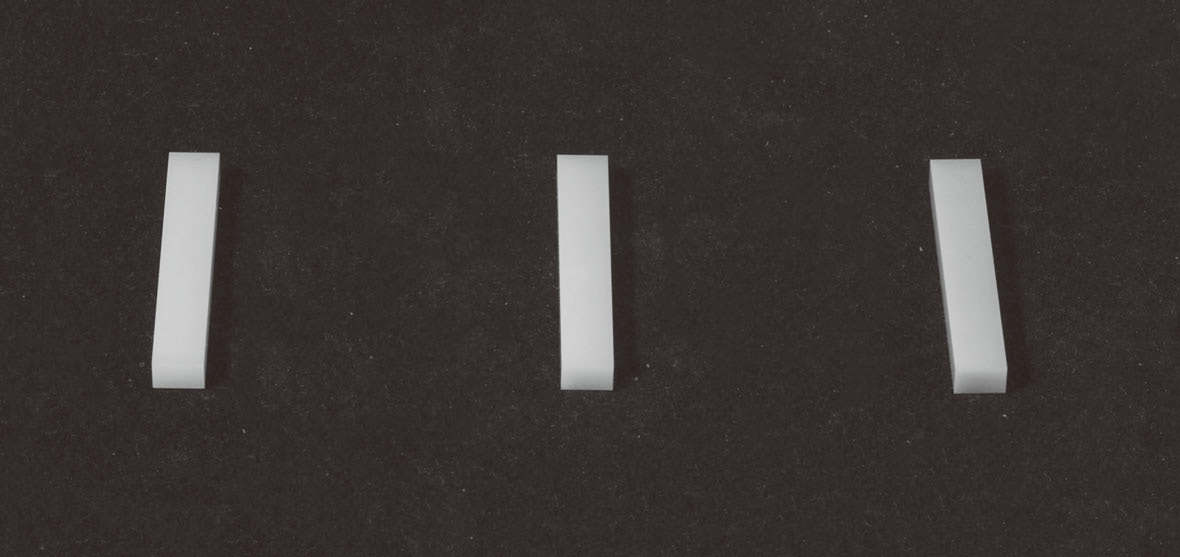
A total of 60 bar-shaped specimens (25 × 4 × 2.5 mm) were milled from presintered 3Y-TZP highly translucent zirconia blocks (Razor, UNC Int., Seoul, Korea) (Fig. 1) and three experimental groups were set up according to shade. Uncolored (A0) and colored (A1 and A3) blocks were used in this study. The specimens were prepared using an electrical high precision saw (IsoMet 1000 Precision Saw, Buehler Ltd, Lake Bluff, USA) under wet conditions and washed in tap water to remove the cutting debris. After that, specimens were finished manually with a ceramic polisher (Diapol, Eve Ernst Vetter GmbH, Keltem, Germany) with a low-speed handpiece under constant water irrigation. The dimensions of the specimens were measured with a digital caliper (SD500-200PRO, Sincon Corp., Seoul, Korea).
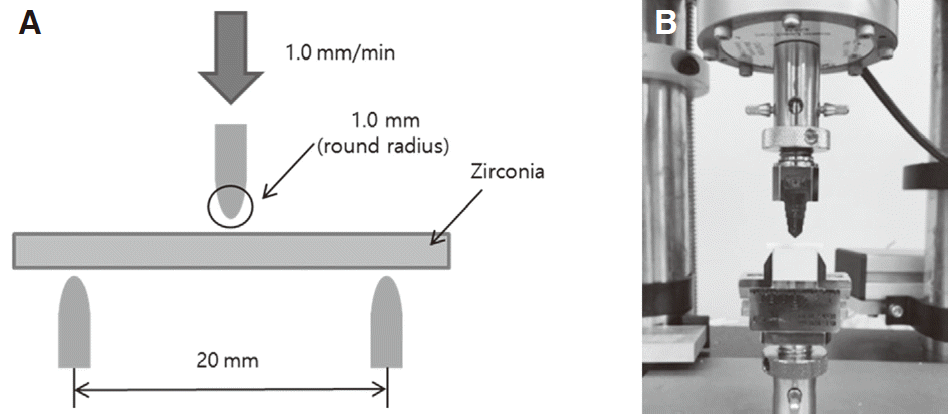
Specimens were loaded until fracture occurred in a universal testing machine (Instron 5848, Instron Corp., Canton, USA) according to ISO 6872 and previous studies.
9-11
The load was vertically applied with a steel knife edge rounded to a radius of 1.0 mm, centered on the specimen, at a crosshead speed of 1.0 mm/min (Fig. 2).
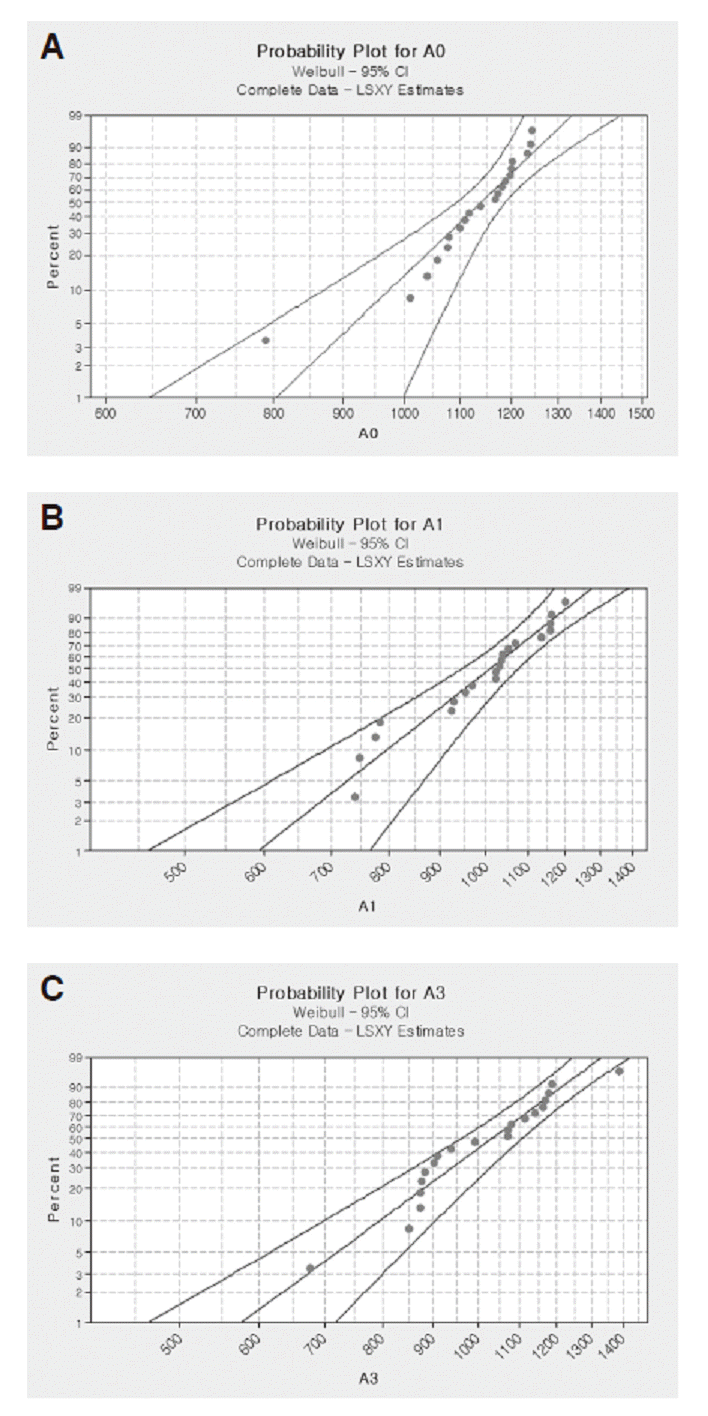
The variability of the flexural strength data was analyzed using a 2-parameter Weibull cumulative distribution function.
12-14
The following equation was used to calculate the Weibull monulus:
Pf(σ) = 1 - exp [-(σ/σ0)m],
where Pf(σ) is the probability of failure, σ is the fracture strength, σ0 is the characteristic parameter corresponding to the fracture probability of 63.2%, and m is the Weibull modulus. Weibull distribution graphs were obtained with software (Minitab ver18.0, Minitab LCC., USA).
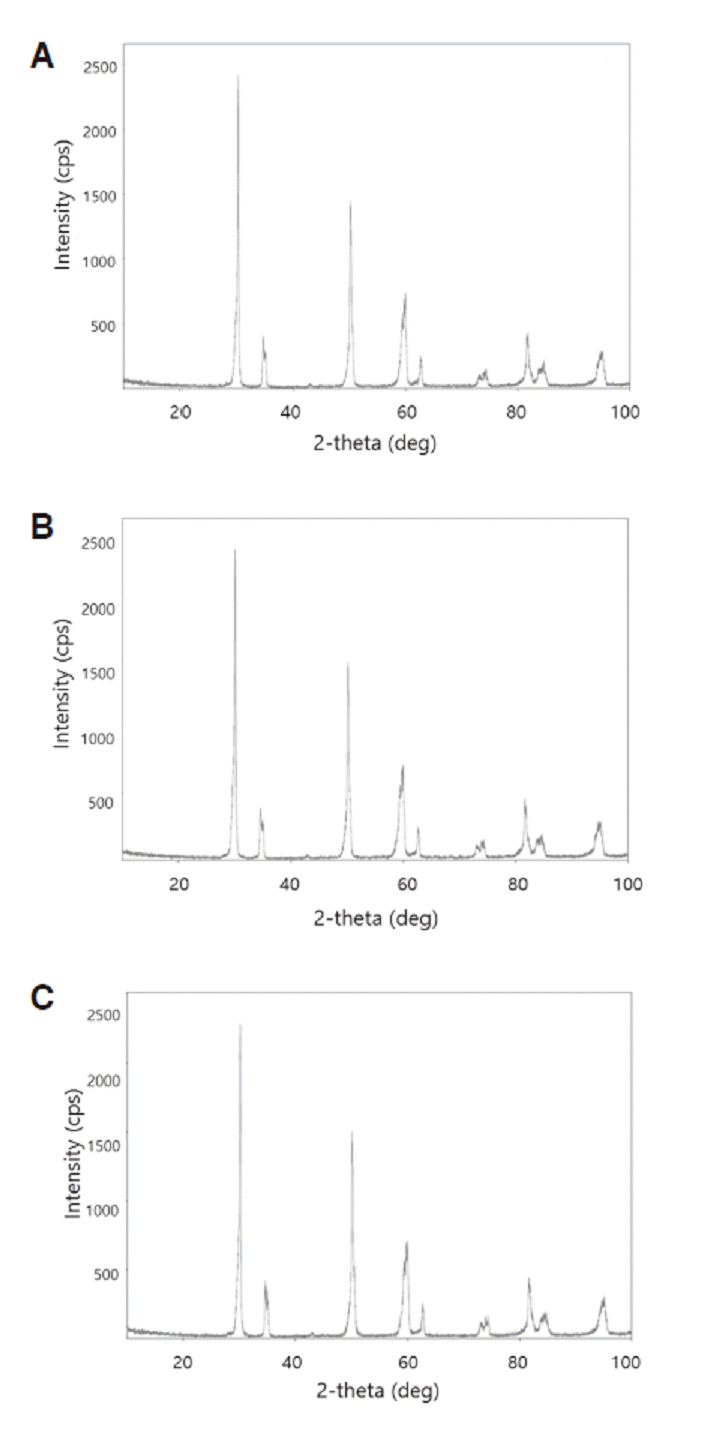
XRD patterns were carried out by using a diffractometer (Miniflex, Rigaku Corp., USA) within the 2θ range of 10 to 100 degrees, covering the positions of the highest peaks of tetragonal and monoclinic phases of ZrO2. Cukα radiation was generated at 40 kV and 40 mA. Mass fraction of the monoclinic phase (Xm) was calculated with the method suggested by Garvie and Nicholson
15
:
Xm = (Im[-111] + Im[111] / [Im[-111] + Im[111] + It[101]]),
where Xm is the mass fraction of the monoclinic phase, Im(-111) is the intensity of the monoclinic peak at 28.2 degrees, Im(111) is the intensity of the monoclinic peak at 31.5 degrees, and It(101) is the intensity of the tetragonal peak at 30.2 degrees.
The volume fraction of the monoclinic phase (Vm) was calculated with the method suggested by Toraya el al16:
Vm = 1.311Xm / (1 + 0.311Xm),
where Vm is the volume fraction of the monoclinic phase and Xm is the mass fraction of the monoclinic phase.
Statistical analysis was performed with software (SPSS 23.0, IBM Inc., Armonk, USA). The normality of distributions was explored by Kolmogorov-Smirnov test, and the groups were distributed normally. Flexural strength of uncolored and colored groups was evaluated with one-way ANOVA followed by the Tukey’s honestly significant difference (HSD) post hoc test. Statistical significance was set atP < 0.05.
Results
The mean of flexural strength of the three groups are presented inTable 1. The shade A0 group showed the highest mean flexural strength compared with those of A1 and A3, and the differences were of statistical significance (P < 0.05). No significant difference was found between A1 and A3 (P > 0.05) (Table 2).
The Weibull analysis was performed to evaluate the reliability of each group (Fig. 3). A higher Weibull modulus signifies higher reliability for specimen strength. The shade A0 (12.09) study group had higher reliability compared with A1 (7.97) and A3 (7.31) study groups.
On x-ray diffraction analysis of each group, typical peaks of tetragonal phase appeared in all groups (Fig. 4). Volume fraction (Vm) of the monoclinic phase was 2.9% for the A0 group, 3.2% for A1, and 4.6% for the A3 group.
Discussion
The present study evaluated the flexural strength and reliability of highly translucent colored zirconia. According to the results of the study, the null hypothesis that there is no difference in flexural strength between uncolored and colored zirconia was rejected.
Recently, the use of zirconia prosthesis with computer-aided design/computer-aided manufacturing (CAD/CAM) method has been increasing. Among dental ceramics, 3Y-TZP possesses excellent mechanical properties such as highest fracture resistance and fracture toughness, which contributes to its wide use in prosthodontic treatment that ranges from a single tooth restoration to full mouth rehabilitation.
17
Moreover, it shows a more than 90% success rate in over 10-year long-term clinical studies.
18,19
Factors affecting the translucency of zirconia include thickness, porosity, the density of specimen, size of the crystal, etc. It was reported that a small quantity of Al
2
O3 included in zirconia reduces the translucency due to the effect of light scattering.
20
Highly translucent zirconia with more than 40% translucency used in this study did not contain Al
2
O3, and it was comparable to typical highly translucent zirconia (Lava Plus High Translucency Zirconia, 3M ESPE, Seefeld, Germany) with more than 30% translucency.
On the flexural strength analysis using highly translucent monolithic zirconia in this study, the result of uncolored zirconia (1127.10 MPa) was significantly higher than shade A1 (995.71 MPa) and shade A3 (1016.42 MPa). Meanwhile, there was no statistically significant difference between A1 and A3. Considering that, the flexural strength of highly translucent monolithic zirconia in this experiment may be affected by coloring oxide, yet, the result of colored groups was acceptable for clinical use.21 Therefore, colored highly translucent monolithic zirconia may be used stably in a visible area requiring a high level of aesthetics.
Generally, previous studies suggested that the Weibull modulus of 5 to 15 is appropriate for dental ceramic.22 The Weibull modulus of the specimen used in this study is between 7.31 (shade A3) and 12.09 (shade A0). These results imply that the uncolored zirconia breaks steadily and has high reliability.
Based on the results of X-ray diffraction, we concluded that the addition of coloring oxides during fabrication of highly translucent zirconia does not affect the formation of tetragonal crystal phase. The result was consistent with previous studies.
23,24
The acceptable level of volume fraction of the monoclinic phase in dental zirconia is below 25%.
25
A lot of transformations into the monoclinic phase reduces mechanical stability by time and may affect crack-stopping or crack-retarding properties of zirconia. The volume fraction of the monoclinic phase in zirconia used in this study was 2.9%, 3.2% and 4.6% for shade A0, A1, and A3 respectively, all were within the acceptable level.
The present study measured the flexural strength and reliability of the bar-shaped specimen when a load is directed perpendicular to the long axis of the specimen. However, there is a limitation in applying the study result in clinical practice as the intraoral condition differs from the experimental environment. Therefore, future studies will need to focus on a highly translucent colored zirconia fabricated in crowns suitable for anterior, premolar, and molar region.
Conclusion
Within the limitation of the current study, the flexural strength of highly translucent monolithic zirconia was statistically significantly high in uncolored group compared with colored, but there was no significant difference between colored groups. Also, the uncolored group had higher reliability than colored study groups. Therefore, clinicians should be careful when using highly translucent colored zirconia to prevent breakage of veneering ceramic and enhance aesthetics.
 XML Download