Journal List > Ann Lab Med > v.42(4) > 1159781

Park, Roh, and Kim: Performance Evaluation of the Aptima Assays in Comparison with the cobas 6800 Assays for the Detection of HIV-1, HBV, and HCV in Clinical Samples

Abstract

Background

Accurate and consistent viral load (VL) quantitation of HIV type 1 (HIV-1), hepatitis B virus (HBV), and hepatitis C virus (HCV) is important for diagnosis and clinical monitoring. Assay results have to be concordant and compatible across laboratories. We evaluated the performance of three Aptima assays (Hologic, San Diego, CA, USA) and compared their VL values with corresponding cobas 6800 assay (Roche Diagnostics, Mannheim, Germany) results, using 840 clinical samples.

Methods

The correlation between VL results obtained using the two assays was evaluated in terms of analytical sensitivity, precision/reproducibility, linearity, and cross-reactivity. Agreement rates were determined using kappa statistics. The overall agreement of VL values was examined using Passing–Bablok regression analysis.

Results

All CVs were within 5%; the assays had good precision for detecting all three viruses. The linearity of quantitation assessed using three AccuSpan linearity panels (Seracare, Milford, MA, USA), was excellent for the Aptima assays. For HIV-1 and HCV, the results of both assays showed excellent agreement (κ=0.89 and 0.90, respectively) while for HBV, the results showed good agreement (κ=0.69). For analytical sensitivity, the VLs required for a 100% detection rate of HIV-1, HBV, and HCV were 20 copies/mL, 7.5 IU/mL, and 5.0 IU/mL, respectively. The results for HIV-1, HBV, and HCV obtained using both assays correlated strongly (R2=0.97, 0.93, and 0.95, respectively).

Conclusions

The cobas 6800 and Aptima assays, with fully automated and high-throughput molecular platforms for HIV-1, HBV, and HCV VL measurements, show good analytical performance and a strong correlation between results. The study results suggest that the assays can be used interchangeably for long-term monitoring of chronic infections.

INTRODUCTION

Viral load (VL) quantitation of HIV type 1, hepatitis B virus (HBV), and hepatitis C virus (HCV) is a part of the standard protocol for diagnosis, clinical monitoring, and treatment management [1-8]. In patients infected with HIV-1, the VL should be measured at diagnosis and at the initiation of antiretroviral therapy, and regularly between 6 and 12 months thereafter. Treatment success can be judged based on a VL remaining <50 copies/mL [9-11]. For HBV infections, several guidelines recommend monitoring the VL using highly sensitive nucleic acid amplification technologies every three months until the HBV DNA is undetectable, and every three to six months thereafter to detect persistent viremia and virological breakthrough [3, 7]. HCV RNA detection and VL quantification should be performed using a sensitive assay with a lower limit of detection (LOD) of 15 IU/mL. The endpoint of therapy is undetectable HCV RNA for 12–24 weeks after the end of treatment [5].
The assays used for monitoring VLs of HIV-1, HBV, or HCV must have a high sensitivity and accuracy. Infections with these viruses are chronic and require long-term treatment and monitoring, during which VL measurements may be performed at different laboratories or using different reagents and analyzers within the same laboratory. Providing results that are consistent, concordant, and interchangeable across laboratories and assays is necessary [11-13]. Various assays for the quantitation of HIV-1, HBV, and HCV in plasma or serum are commercially available, but reportedly have variable performance [9, 14]. Most of these assays use quantitative real-time PCR technology. The recently developed Aptima assay (Hologic, San Diego, CA, USA) involves three steps: target capture, target amplification via transcription-mediated amplification (TMA), and real-time detection of the amplicons using fluorescent probes; all these processes are automated and performed in a single tube on the Panther platform (Hologic). Previous comparative performance studies have examined quantitative real-time PCR technology-based assays against the Aptima assay [9, 11, 14-30]. However, few studies have compared the assays available for the fully automated, high-throughput molecular platforms, Roche cobas 6800 (Roche Diagnostics, Mannheim, Germany) and Panther [9, 11, 31, 32]. We evaluated the interchangeability of assay results for long-term monitoring of chronic infections to compare the performance of the Aptima and cobas 6800 assays, using samples sufficient for the determination of HIV-1, HBV, and HCV VL values. This is the first study to analyze more than 100 positive samples representing a sufficient analytical range for HIV-1, HBV, and HCV detection commonly used in clinical laboratories.

MATERIALS AND METHODS

Samples

Blood samples were collected from patients with HIV-1, HBV, or HCV infection. Plasma was obtained from these samples treated with EDTA to prevent coagulation. In total, 301, 300, and 239 plasma samples assayed using cobas 6800 between June and August 2020 were retested using the HIV-1, HBV, and HCV Aptima assays, respectively. The samples were stored at –70°C for up to four months before use in the Aptima assays. The research involving human samples complied with all the relevant national regulations, institutional policies, and the tenets of the Helsinki Declaration (as revised in 2013), and was approved by the Institutional Review Board of the Severance Hospital, Seoul, Korea (IRB No.: 1-2020-0019). The requirement for informed consent was waived due to the retrospective nature of this study, provided that all patient data were anonymized and that the study involved samples already available rather than prospectively collected.

Assay characteristics and evaluation

The characteristics of each assay are presented in Table 1. All the instruments and assays were used by trained operators in accordance with the manufacturers’ instructions.
The imprecision was evaluated according to CLSI guideline EP15-A3, and the inter- and intra-assay precision was determined [33]. Low- and high-concentration samples of positive control materials provided by each manufacturer were used. The control materials were measured in two replicates twice daily for 10 days to assess inter-assay precision. For intra-assay precision assessment, 20 replicates of high- and low-concentration positive control materials were used.
The linearity was evaluated according to CLSI guideline EP06-A, using the AccuSpan HIV-1 RNA Linearity Panel (Seracare, Milford, MA, USA; 2410-0221/Batch #01383902) with a concentration range of 2.10–8.35 log copies/mL, the AccuSpan HBV DNA Linearity Panel (PHD802 [2410-0162]/Batch #10439611) with a concentration range of 1.74–8.40 log IU/mL, and the AccuSpan HCV RNA Linearity Panel (PHW805 [2410-0166]/Batch #10338244) with a concentration range of 1.26–7.34 log IU/mL [34]. Each panel item was measured twice, and the mean values obtained were compared with the expected values indicated in the panel datasheets. Linear-fit and second- and third-order polynomial regression analyses were performed. A regression equation was obtained using the observed and expected VL values as dependent and independent variables, respectively, from the best-fitting model.
The clinical samples from the patients with HIV-1, HBV, or HCV infection requiring VL monitoring were assayed with the routinely used cobas 6800 assays in parallel with the Aptima assays of the Panther platform. The assay results were categorized as “Target not detected” (TND), “below the lower limit of quantitation” (<LLOQ), or “quantitated” based on the LLOQ value of each assay. Quantitative results from both assays were evaluated for correlation. HIV-1 drug resistance mutation and HCV genotyping data were collected for the relevant samples. HIV-1 drug resistance mutation was assessed using a sequence-based typing method and interpreted according to the HIVdb Program of the HIV Drug Resistance Database provided by Stanford University [35]. For HCV genotyping, the Roche cobas HCV GT kit was used on the Roche cobas 4800 automated platform. HBV genotyping was not performed because HBV genotype C prevails predominantly among chronic carriers of the virus in Korea, irrespective of their clinical stages of liver disease and geographic origin.
To assess the analytical sensitivity of the Aptima assays, the clinical samples were diluted with virus-negative plasma to obtain target concentrations of 20, 30, and 40 copies/mL for HIV-1, and of 5, 7.5, 10, and 15 IU/mL for HBV and HCV, based on the cobas 6800 results. Twenty replicates of each dilution were assayed within the same run. The lowest concentrations yielding a 100% detection rate and 100% quantitation rate were compared with the LOD and LLOQ reported by the manufacturer.
The potential cross-reactivity with other viruses was assessed using two independent samples with detected HIV-1, HBV, HCV, cytomegalovirus, Epstein–Barr virus, BK virus, and herpes simplex virus, but not the virus to be measured by the assay.

Statistical analysis

All statistical analyses were performed using the Analyse-it software, version 4.65 (Analyse-it Software, Leeds, UK). The agreement rates between the two assays were determined using the kappa statistics with 95% confidence intervals (CIs) (with κ values of 0.001–0.2, 0.201–0.4, 0.401–0.6, 0.601–0.8, and 0.801–0.999 representing slight, fair, moderate, substantial, and excellent agreement, respectively). The overall correlation of VL values for samples quantitated with both assays was examined pairwise using Passing–Bablok regression analysis, which included the calculation of a correlation coefficient (R2), as well as Bland–Altman analysis, which included the calculation of the mean difference and 95% CI of the assay agreement. HCV values stratified according to the genotype were examined using ANOVA. P<0.05 was considered statistically significant.

RESULTS

Precision

The coefficients of variation (standard deviation as a percentage of the mean) for all assays are summarized in Table 2. All % CVs were within 5%, indicating good assay precision, for all three viruses. For the Aptima assays, the inter-assay % CV values were slightly higher than the corresponding intra-assay values.
For the cobas 6800 assays, the % CV values for HIV-1 and HBV of the low-concentration positive control material were high when compared with those for HCV of low- and high-concentration positive control materials of the three viruses. For both low- and high-concentration positive control materials, the Aptima assays showed lower % CV values in the HIV-1 and HBV assays than did cobas 6800, whereas the cobas 6800 HCV assay yielded a lower % CV than the Aptima assays.

Linearity

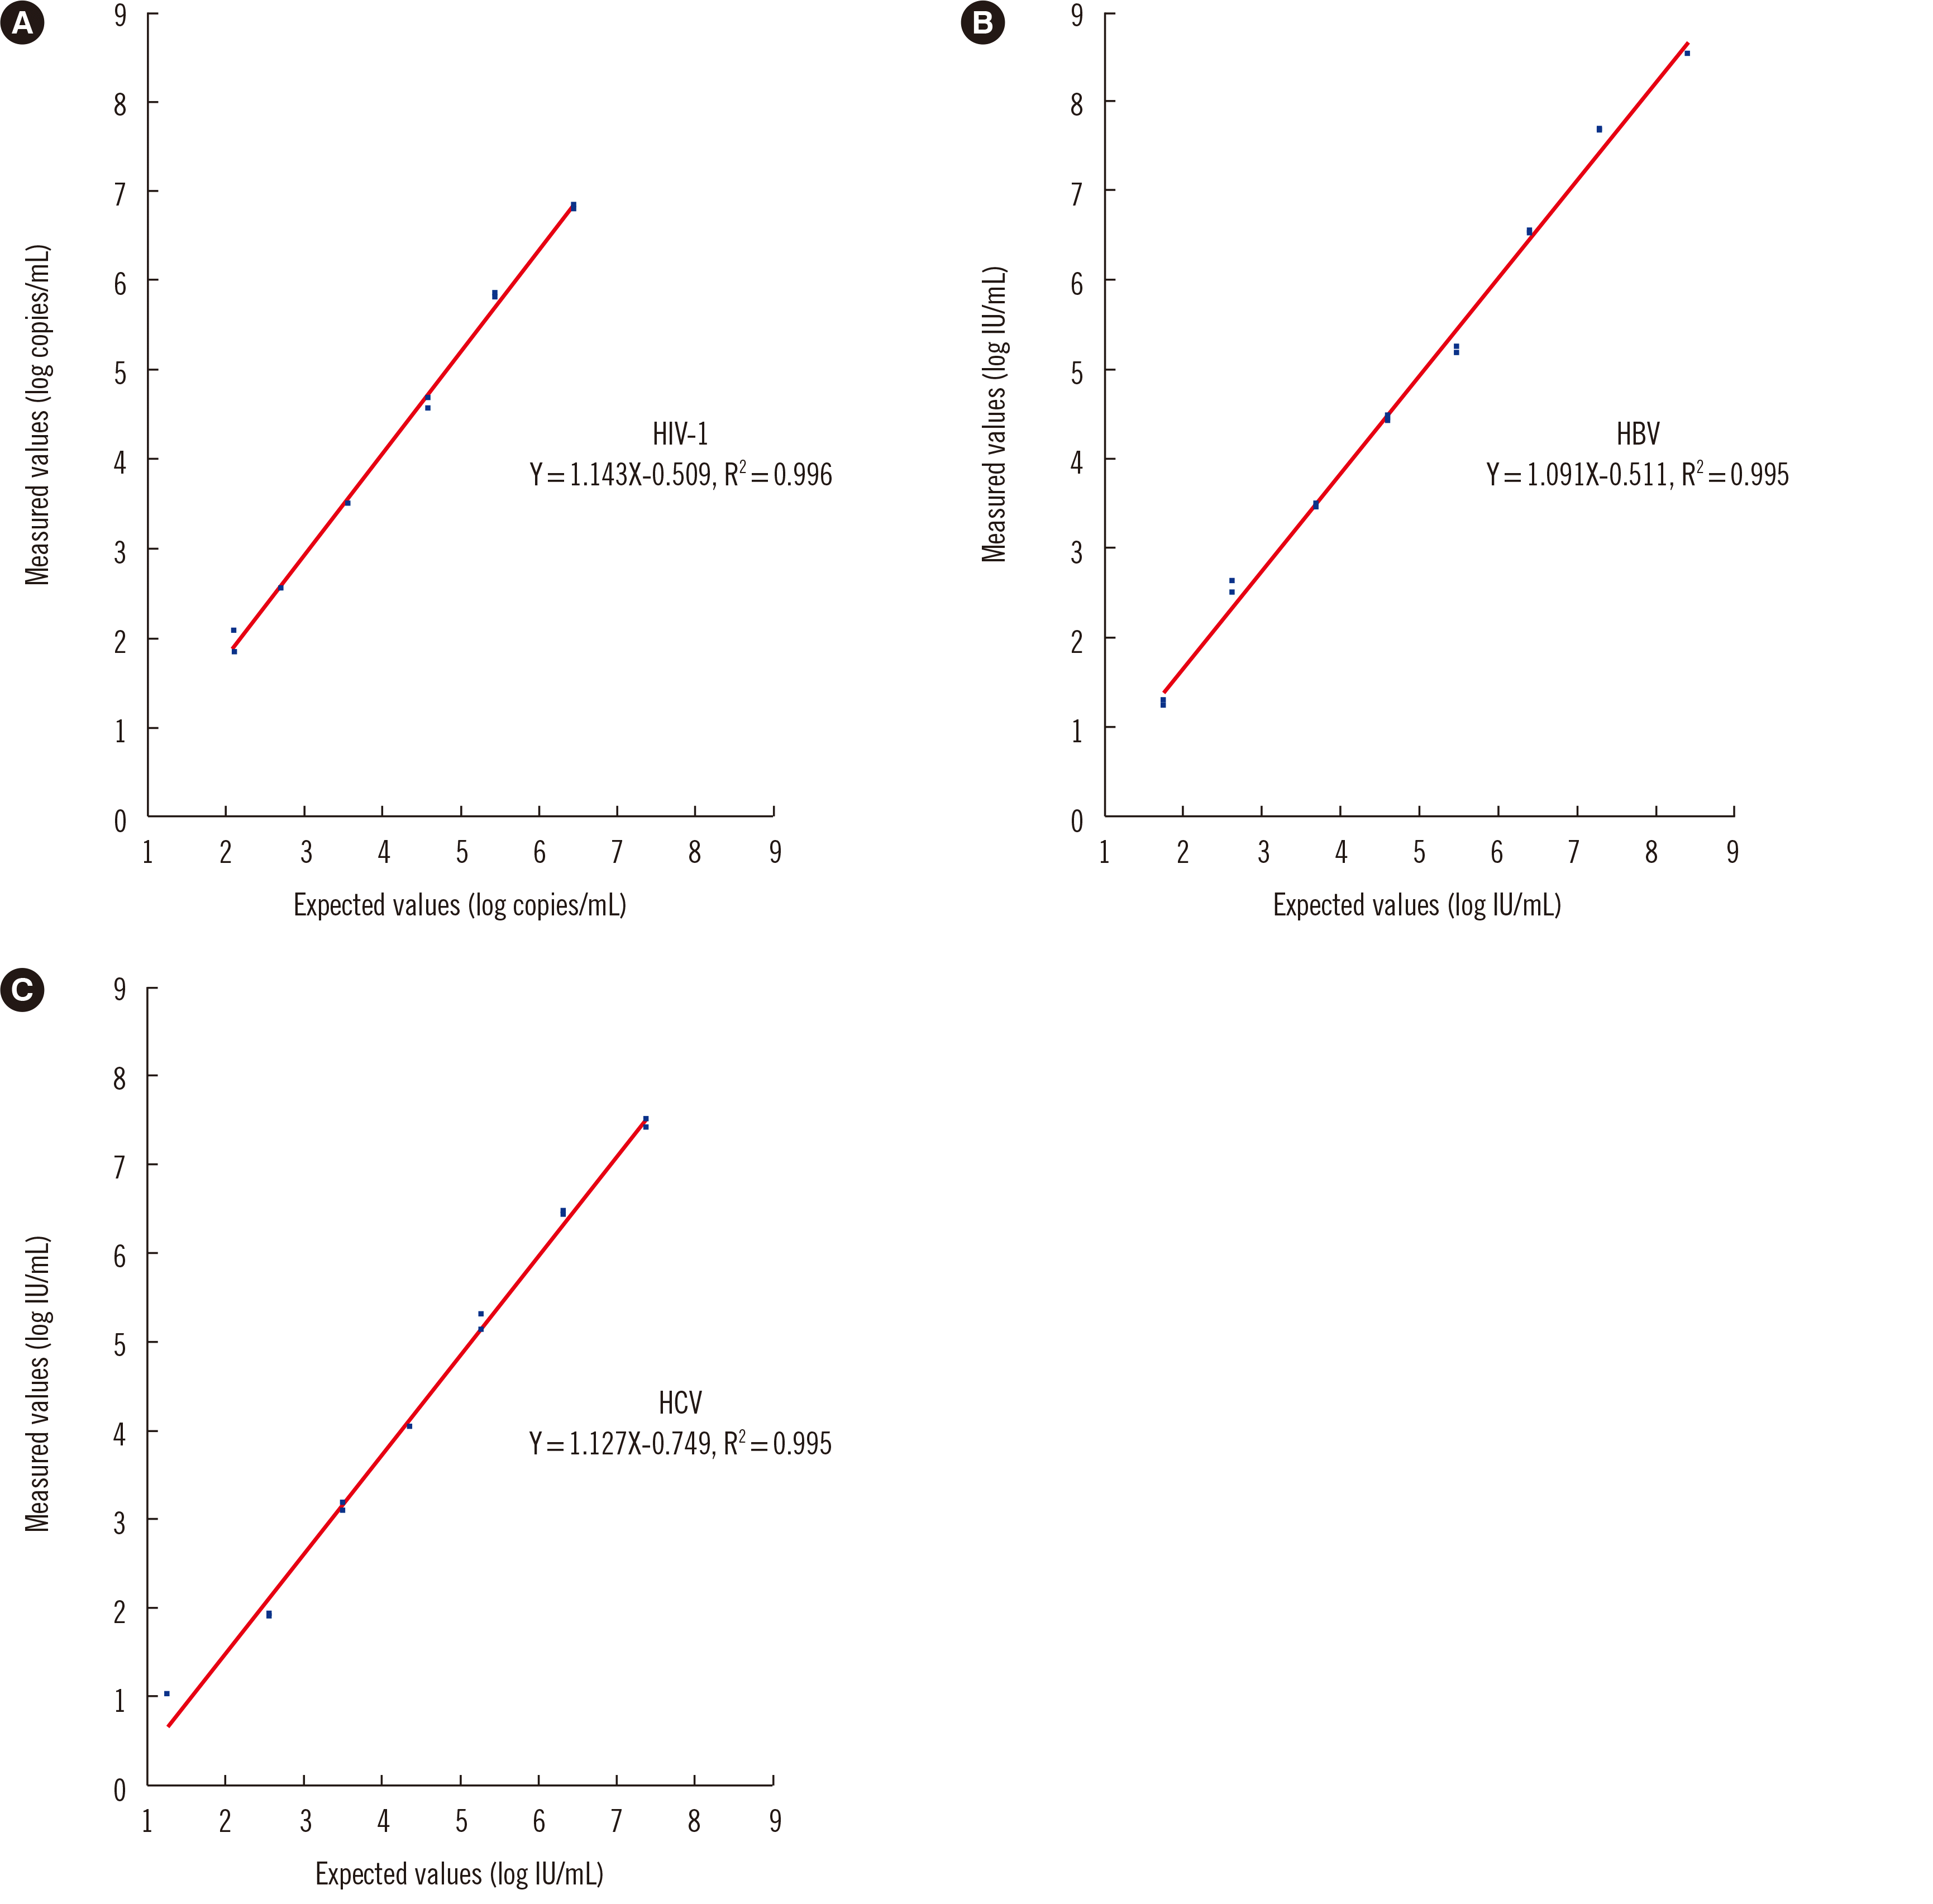
The linearity of quantitation as assessed using the AccuSpan linearity panels was excellent for the Aptima assays (R2=0.995–0.996) (Fig. 1).

Comparison of the Aptima and cobas 6800 assays using clinical samples

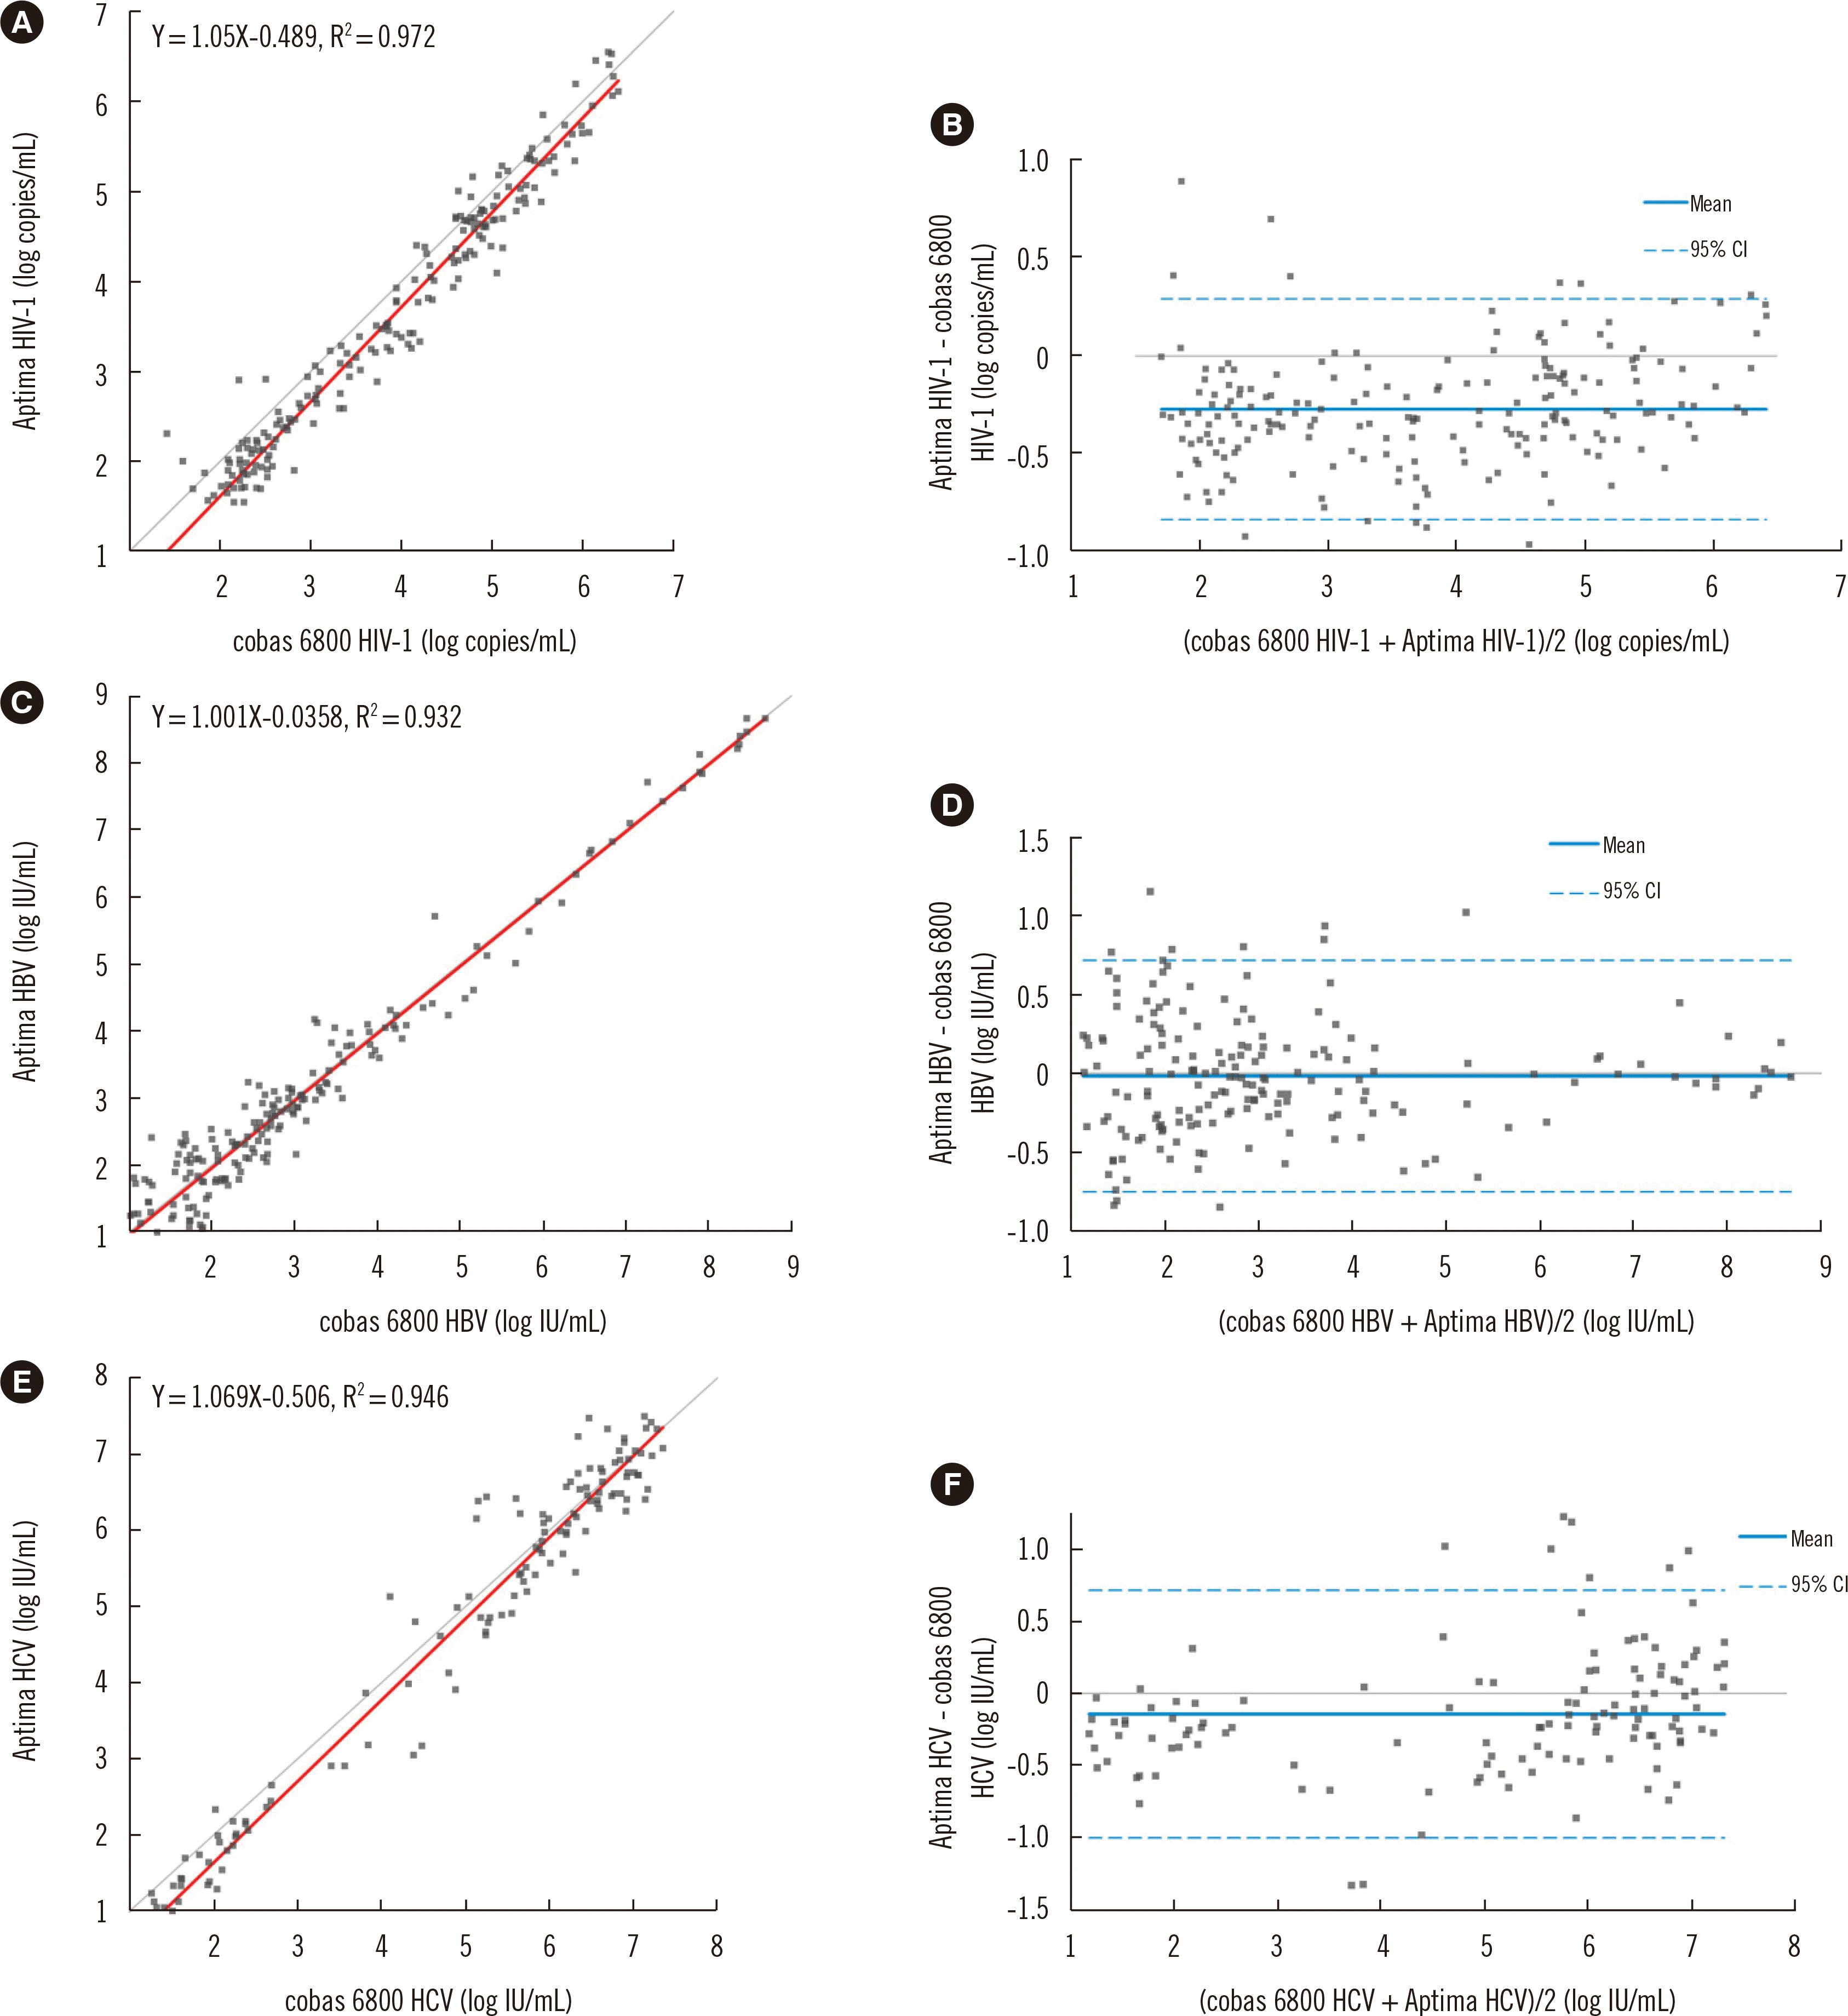
For HIV-1, the between-assay agreement was 94.68% (285/301) (κ=0.89; 95% CI, 0.83–0.94) (Table 3). Two samples were detected as quantitated (with 119 and 193 copies/mL, respectively) by the cobas 6800 assay and as TND by the Aptima assay. Three samples were detected as quantitated (VL=100, 110, and 133 copies/mL, respectively) by the cobas 6800 assay, whereas they were detected as <LLOQ by the Aptima assay. Eleven samples were detected as <LLOQ by the Aptima assay and as TND by the cobas 6800 assay. For 196/301 (84.05%) samples quantitated by both methods, the VL values ranged from 1.41 to 6.39 log copies/mL and from 1.54 to 6.54 log copies/mL in the cobas 6800 and Aptima assays, respectively. The HIV-1 results of both assays were strongly correlated (R2=0.97; Fig. 2A). Bland–Altman analysis indicated a mean difference in the titer (Aptima vs. cobas 6800) of –0.27 log copies/mL (95% CI, –0.84–0.29; Fig. 2B).
There were 49 patients with VL values of 50–200 copies/mL in at least one assay (Supplemental Data Table S1). The agreement rate for samples with low VL values (38%) was lower than that for the total samples (94.68%). The detection rates of anti-retroviral resistance mutations were similar among the VL groups, and no difference in VL values was observed between the detection (N=19) and non-detection groups (N=13) (for cobas 6800, the means±SDs for the detection and non-detection groups were 206.37±101.17 and 241.62±151.90 [P=0.44], respectively; the corresponding values in the Aptima assays were 116.79±169.58 and 110.54±50.37 [P=0.90], respectively). In the low VL value range, we observed no association between treatment resistance mutations and increasing VL values; the presence of mutations associated with antiretroviral drug resistance may have been due to repeatedly high VL values (Supplemental Data Table S2).
The HBV agreement rate between the assays was 84.33% (253/300) (κ=0.69; 95% CI, 0.63–0.76). One sample detected as quantitated by the cobas 6800 assay was detected as TND by the Aptima assay, and one sample detected as quantitated by the Aptima assay was detected as TND by the cobas 6800 assay. Both samples had low VL values (17 and 26 IU/mL). Seventeen samples quantitated by the cobas 6800 assay and detected as <LLOQ by the Aptima assay had a median VL value of 16.10 IU/mL (first quartile, 14.63 IU/mL; third quartile, 29.37 IU/mL; minimum, 10.3 IU/mL; maximum, 104.0 IU/mL). Most VL values were below the mean value (28.62 IU/mL), except for four results. Twenty-eight samples were detected as<LLOQ by the Aptima assay and as TND by the cobas 6800 assay. For 182/300 (60.67%) samples quantitated by both assays, the VL values ranged from 1.01 to 8.69 log IU/mL and from 1.00 to 8.66 log IU/mL in the cobas 6800 and Aptima assays, respectively. The HBV results of both assays were strongly correlated (R2=0.93; Fig. 2C). Bland–Altman analysis indicated a mean difference in titer (Aptima vs. cobas 6800) of –0.02 log copies/mL (95% CI, –0.75–0.71; Fig. 2D).
The HCV agreement rate between the assays was 94.98% (227/239) (κ=0.90; 95% CI, 0.85–0.96). Four samples quantitated with the Aptima assay yielded VL values near the LLOQ value (19, 16, 16, and 10 IU/mL). The cobas 6800 assay yielded two samples as TND and two as <LLOQ. Six samples were detected as quantitated by the cobas 6800 assay and as <LLOQ by the Aptima assay. Their VL values were 15.1, 17.2, 18.4, 32.9, 42.1, and 42.8 IU/mL. For 126/239 (52.72%) samples quantitated by both assays, the VL values ranged from 1.26 to 7.35 log IU/mL and from 1.00 to 7.49 log IU/mL in the cobas 6800 and Aptima assays, respectively. The HCV results of both assays were strongly correlated (R2 of 0.95, Fig. 2E). Bland–Altman analysis indicated a mean difference in titer (Aptima vs. cobas 6800) of –0.14 log copies/mL (95% CI, –1.00–0.72; Fig. 2F). Genotype information was available for 80/126 samples quantitated by both methods, with the following distribution: genotypes 1a, 1b, and 2 were detected in 1 (1.3%), 35 (44.8%), and 44 (55.0%) samples, respectively. The mean difference between the Aptima and cobas 6800 assays in terms of HCV values was similar for genotypes 1b and 2 (0.107 log IU/mL, 95% CI, –0.057–0.270; and 0.050 log IU/mL, 95% CI, –0.103–0.202; respectively; P=0.681) (Supplemental Data Figure S1).

Analytical sensitivity

The overall detection rates of the Aptima assays for the three viruses were similar (Table 4). The VLs yielding a 100% detection rate of HIV-1, HBV, and HCV were 20 copies/mL, 7.5 IU/mL, and 5 IU/mL, respectively. Although the HIV-1 assay quantitated 100% of the replicates at 30 copies/mL (a value similar to the LLOQ reported by the manufacturer), the HBV and HCV assays quantitated 50% and 85% of the replicates at 10 IU/mL, respectively.

Cross-reactivity

None of the viruses examined were detected by the Aptima assays. There was no evidence of cross-reactivity with other clinically important viruses.

DISCUSSION

The consistency of the assay results obtained from different laboratories and with different assays is paramount to the effective management of patients with chronic viral infections that require long-term treatment and monitoring [11-13]. The results produced by the cobas 6800 and Aptima assays for HIV-1 and HCV showed excellent agreement, and we found substantial concurrence between the assays for HBV, consistent with the results of previous studies [9, 11, 31, 32]. Overall, the results obtained with the cobas 6800 assays were slightly higher than those obtained with the Aptima assays, and the mean bias values for the three viruses were <–0.3 log.
Similarly, the results produced by the cobas 6800 and Aptima assays showed excellent agreement for the detection/non-detection of HIV-1 RNA in clinical samples (κ=0.89), and there was a good agreement between values obtained in samples quantitated by both assays (mean bias of –0.27 log). Five HIV-1 samples were detected as quantitated by the cobas 6800 assay and as TND or <LLOQ by the Aptima assay. Two of these five samples retained values below the lower LOD throughout the monitoring period. The samples detected as <LLOQ by the Aptima assay had values lower than those detected by the cobas 6800 assay. A viral blip, which is an isolated detectable VL observed after virologic suppression that returns to virologic suppression or unconfirmed result upon repeated testing, may have occurred in these samples [11]. Blips are not associated with treatment failure and are generally considered an artifact caused by random assay variation rather than clinically significant elevations in viremia [11].
Current therapy guidelines for HIV-1 define virologic failure as a VL repeatedly exceeding 200 copies/mL [1, 6, 10]. The present cases were not associated with treatment failure or a need to change treatment. Patients with VL values of 50–200 copies/mL may continue with the same treatment with more frequent monitoring; there is no consensus on how to manage patients with VL values in this range [1, 6]. The risk of emerging treatment resistance is likely low [1, 6, 10]. In such cases, confirming that VL values remain above the lower LOD and assessing treatment adherence and possible drug–drug or drug–food interactions are recommended.
The results produced by the cobas 6800 and Aptima assays showed good agreement for the detection/non-detection of HBV DNA in clinical samples (κ=0.69) and the values obtained from samples quantitated by both assays (mean bias of –0.02 log). Samples detected as <LLOQ by the Aptima HBV assay (45/300, 15%) were either classified as TND or quantitated by the cobas 6800 assay, resulting in a decrease in the estimate of inter-assay agreement. Twenty-eight samples were detected by the Aptima assay alone, which might have been due to the amplification of HBV RNA [32]. The VL values of the other samples were near the LLOQ (median VL of 16.10 IU/mL), and most were within the % CV of inter-assay precision.
Current guidelines for the monitoring of HCV-positive patients undergoing treatment recommend the use of a highly sensitive quantitative real-time HCV RNA assay with a LOD of 15 IU/mL and a LLOQ of 25 IU/mL; both the cobas 6800 and Aptima assays comply with these requirements [4, 5, 7]. Both assays had an excellent agreement for the detection/non-detection of HCV RNA in clinical samples (κ=0.90) and a good agreement of values in the samples quantitated by both assays (mean bias of –0.14 log). VL values of HCV genotype 3 have been associated with a high rate of under-reporting and high variance between assays [9, 14, 26]. The HCV genotypes detected were 1a (N=1), 1b (N=35), and 2 (N=44); there was no difference or significant variation in VL values between patients with genotypes 1b and 2 (Supplemental Data Figure S1).
In the quantitative comparison of the cobas 6800 and Aptima assays, several samples detected as <LLOQ or TND by one assay were quantitated by the other, with respect to HIV-1, HBV, and HCV VL values. In samples with VL values near the LLOQ, even those within the % CV of the allowable inter-assay precision, inconsistent results may be observed. As the two assays use different principles (TMA and real-time PCR), the probability of inconsistent results is higher than that observed for assays using the same principle. In addition, as the target regions of HIV-1 and HBV were different, more discrepancies were observed for these viruses than for HCV. Different LODs and linearity ranges may have contributed to the discrepancy in the results.
In the analytical sensitivity assessment, the lowest concentrations required for a 100% detection rate were 20 copies/mL, 7.5 IU/mL, and 5.0 IU/mL for HIV-1, HBV, and HCV, respectively, which are higher than the LODs reported by the manufacturer of the Aptima assays. Accurate assessment of the LOD requires precise dilutions close to the LOD concentration. For HBV and HCV, the quantitation rates were 50% and 85%, respectively, at the LLOQ level. The samples used for analytical sensitivity assessment were selected based on the cobas 6800 results, and upon comparison, the VL values of the Aptima assays were lower than those of cobas 6800, which we suspect to have influenced the low quantitation rate.
This study had some limitations. As the cobas 6800 system is routinely used in our laboratory, we collected the samples based on the assay results produced by this system, which may have affected the comparisons. The linearity and cross-reactivity were evaluated using the Aptima assays. HCV genotypes 3, 4, 5, and 6 were not detected. Future studies should compare the cobas 6800 and Aptima assays using samples assayed in parallel and assess assay sensitivity in HCV detection using samples with a wider range of genotypes than those detected in this study.
In summary, both the cobas 6800 and Aptima assays show good analytical performance for the determination of HIV-1, HBV, and HCV VL values. The results of this study, including the estimates of the correlation and agreement between the assay results obtained with these assays, suggest that the two assays can be used interchangeably for the long-term monitoring of chronic infections. Clinical laboratories should base their choice of assay system on factors such as the assay principle and type and the timeline for obtaining results.

Supplemental Materials

ACKNOWLEDGEMENTS

This study was supported by Anse (Seongnam-si, Gyeonggi-do, Korea), Korean representative of Hologic, San Diego, CA, USA.

Notes

AUTHOR CONTRIBUTIONS

Park Y: Formal analysis, Writing - Original draft, Reviewing and Editing; Kim S: Conceptualization, Methodology, Formal analysis, Writing - Reviewing and Editing, Supervision, Project administration; Roh J: Data collection, Resource acquisition. All authors take responsibility for the intellectual content of this manuscript and have approved its submission.

CONFLICTS OF INTEREST

No potential conflicts of interest relevant to this study are reported.

RESEARCH FUNDING

None.

REFERENCES

1. World Health Organization. 2016. Consolidated guidelines on the use of antiretroviral drugs for treating and preventing HIV infection: recommendations for a public health approach, 2nd ed [Internet]. World Health Organization;Geneva: Available from: https://www.who.int/publications/i/item/9789241549684. cited 2021 Dec 12.
2. AASLD/IDSA HCV Guidance Panel. 2015; Hepatitis C guidance: AASLD-IDSA recommendations for testing, managing, and treating adults infected with hepatitis C virus. Hepatology. 62:932–54. DOI: 10.1002/hep.27950. PMID: 26111063.
3. European Association for the Study of the Liver. Electronic address: easloffice@easloffice.eu, European Association for the Study of the Liver. EASL 2017 Clinical Practice Guidelines on the management of hepatitis B virus infection. J Hepatol. 2017; 67:370–98.
4. European Association for the Study of the Liver. Electronic address: easloffice@easloffice.eu; European Association for the Study of the Liver. EASL Recommendations on Treatment of Hepatitis C 2018. J Hepatol. 2018; 69:461–511.
5. European Association for the Study of the Liver. 2020; Electronic address: easloffice@easloffice.eu; Clinical Practice Guidelines Panel: Chair:, EASL Governing Board representative:, Panel members. EASL recommendations on treatment of hepatitis C: final update of the series☆. J Hepatol. 73:1170–218. DOI: 10.1016/j.jhep.2020.08.018. PMID: 32956768.
6. Ryom L, Boesecke C, Bracchi M, Ambrosioni J, Pozniak A, Arribas J, et al. 2018; Highlights of the 2017 European AIDS Clinical Society (EACS) Guidelines for the treatment of adult HIV-positive persons version 9.0. HIV Med. 19:309–15. DOI: 10.1111/hiv.12600. PMID: 29493093. PMCID: PMC5947127.
crossref
7. Terrault NA, Bzowej NH, Chang KM, Hwang JP, Jonas MM, Murad MH. 2016; AASLD guidelines for treatment of chronic hepatitis B. Hepatology. 63:261–83. DOI: 10.1002/hep.28156. PMID: 26566064. PMCID: PMC5987259.
crossref
8. Terrault NA, Lok ASF, McMahon BJ, Chang KM, Hwang JP, Jonas MM, et al. 2018; Update on prevention, diagnosis, and treatment of chronic hepatitis B: AASLD 2018 hepatitis B guidance. Hepatology. 67:1560–99. DOI: 10.1002/hep.29800. PMID: 29405329. PMCID: PMC5975958.
crossref
9. Aretzweiler G, Leuchter S, García-Álvarez M, Simon C, Marins E, Paxinos E, et al. 2019; Analytical performance of four molecular platforms used for HIV-1, HBV and HCV viral load determinations. Expert Rev Mol Diagn. 19:941–9. DOI: 10.1080/14737159.2019.1624162. PMID: 31159598.
crossref
10. Günthard HF, Aberg JA, Eron JJ, Hoy JF, Telenti A, Benson CA, et al. 2014; Antiretroviral treatment of adult HIV infection: 2014 recommendations of the International Antiviral Society-USA Panel. Jama. 312:410–25. DOI: 10.1001/jama.2014.8722. PMID: 25038359.
11. Wiesmann F, Ehret R, Naeth G, Däumer M, Fuhrmann J, Kaiser R, et al. 2018; Multicenter evaluation of two next-generation HIV-1 quantitation assays, Aptima Quant Dx and cobas 6800, in comparison to the RealTime HIV-1 reference assay. J Clin Microbiol. 56:DOI: 10.1128/JCM.00292-18. PMID: 30068537. PMCID: PMC6156314.
crossref
12. Wiesmann F, Naeth G, Sarrazin C, Berger A, Kaiser R, Ehret R, et al. 2015; Variation analysis of six HCV viral load assays using low viremic HCV samples in the range of the clinical decision points for HCV protease inhibitors. Med Microbiol Immunol. 204:515–25. DOI: 10.1007/s00430-014-0364-z. PMID: 25398515. PMCID: PMC4514908.
crossref
13. Hayden RT, Sun Y, Tang L, Procop GW, Hillyard DR, Pinsky BA, et al. 2017; Progress in quantitative viral load testing: variability and impact of the WHO quantitative international standards. J Clin Microbiol. 55:423–30. DOI: 10.1128/JCM.02044-16. PMID: 27852673. PMCID: PMC5277511.
crossref
14. Schalasta G, Speicher A, Börner A, Enders M. 2016; Performance of the new Aptima HCV Quant Dx assay in comparison to the Cobas TaqMan HCV2 test for use with the high pure system in detection and quantification of hepatitis C virus RNA in plasma or serum. J Clin Microbiol. 54:1101–7. DOI: 10.1128/JCM.03236-15. PMID: 26865682. PMCID: PMC4809922.
crossref
15. Manak MM, Hack HR, Nair SV, Worlock A, Malia JA, Peel SA, et al. 2016; Evaluation of Hologic Aptima HIV-1 Quant Dx assay on the Panther system on HIV subtypes. J Clin Microbiol. 54:2575–81. DOI: 10.1128/JCM.01350-16. PMID: 27510829. PMCID: PMC5035401.
crossref
16. Nair SV, Kim HC, Fortunko J, Foote T, Peling T, Tran C, et al. 2016; Aptima HIV-1 Quant Dx-A fully automated assay for both diagnosis and quantification of HIV-1. J Clin Virol. 77:46–54. DOI: 10.1016/j.jcv.2016.02.002. PMID: 26896710.
crossref
17. Sauné K, Raymond S, Boineau J, Pasquier C, Izopet J. 2016; Detection and quantification of HIV-1 RNA with a fully automated transcription-mediated-amplification assay. J Clin Virol. 84:70–3. DOI: 10.1016/j.jcv.2016.09.002. PMID: 27728849.
crossref
18. Schalasta G, Börner A, Speicher A, Enders M. 2016; Comparative evaluation of the Aptima HIV-1 Quant Dx assay and COBAS TaqMan HIV-1 v2.0 assay using the Roche High Pure System for the quantification of HIV-1 RNA in plasma. Clin Chem Lab Med. 54:493–9. DOI: 10.1515/cclm-2015-0522. PMID: 26351942.
crossref
19. Tabrizi SN, Costa AM, Su J, Lowe P, Bradshaw CS, Fairley CK, et al. 2016; Evaluation of the Hologic Panther transcription-mediated amplification assay for detection of Mycoplasma genitalium. J Clin Microbiol. 54:2201–3. DOI: 10.1128/JCM.01038-16. PMID: 27307453. PMCID: PMC4963517.
crossref
20. Chevaliez S, Dauvillier C, Dubernet F, Poveda JD, Laperche S, Hézode C, et al. 2017; The new Aptima HBV Quant Real-Time TMA assay accurately quantifies hepatitis B virus DNA from genotypes A to F. J Clin Microbiol. 55:1211–9. DOI: 10.1128/JCM.02219-16. PMID: 28202793. PMCID: PMC5377849.
crossref
21. Chevaliez S, Dubernet F, Dauvillier C, Hézode C, Pawlotsky JM. 2017; The new Aptima HCV Quant Dx Real-time TMA assay accurately quantifies hepatitis C virus genotype 1-6 RNA. J Clin Virol. 91:5–11. DOI: 10.1016/j.jcv.2017.03.020. PMID: 28380393.
crossref
22. Schønning K, Johansen K, Landt B, Benfield T, Westh H. 2017; Comparison of the Hologic Aptima HIV-1 Quant Dx assay to the Roche COBAS Ampliprep/COBAS TaqMan HIV-1 test v2.0 for the quantification of HIV-1 RNA in plasma samples. J Clin Virol. 92:14–9. DOI: 10.1016/j.jcv.2017.05.006. PMID: 28505569.
crossref
23. Schønning K, Pedersen MS, Johansen K, Landt B, Nielsen LG, Weis N, et al. 2017; Analytical and clinical performance of the Hologic Aptima HCV Quant Dx assay for the quantification of HCV RNA in plasma samples. J Virol Methods. 248:159–65. DOI: 10.1016/j.jviromet.2017.07.006. PMID: 28732692.
crossref
24. Worlock A, Blair D, Hunsicker M, Le-Nguyen T, Motta C, Nguyen C, et al. 2017; Analytical characteristics and comparative evaluation of Aptima HCV Quant Dx assay with the Abbott RealTime HCV assay and Roche COBAS AmpliPrep/COBAS TaqMan HCV quantitative test v2.0. Virol J. 14:66. DOI: 10.1186/s12985-017-0727-3. PMID: 28372576. PMCID: PMC5379753.
crossref
25. Longo S, Bon I, Musumeci G, Bertoldi A, D'Urbano V, Calza L, et al. 2018; Comparison of the Aptima HIV-1 Quant Dx assay with the COBAS AmpliPrep/COBAS TaqMan HIV-1 v2.0 test for HIV-1 viral load quantification in plasma samples from HIV-1-infected patients. Health Sci Rep. 1:e31. DOI: 10.1002/hsr2.31. PMID: 30623066. PMCID: PMC6266574.
crossref
26. May S, Adamska E, Tang JW. 2018; Evaluating the aptima HIV-1 quant Dx, HCV quant Dx and HBV quant assays against the Abbott HIV-1, HCV and HBV RealTime assays. J Clin Virol. 106:7–10. DOI: 10.1016/j.jcv.2018.06.015. PMID: 30007139.
crossref
27. Schalasta G, Börner A, Speicher A, Enders M. 2018; Evaluation of the Aptima HBV Quant assay vs. the COBAS TaqMan HBV test using the high pure system for the quantitation of HBV DNA in plasma and serum samples. Clin Chem Lab Med. 56:634–41. DOI: 10.1515/cclm-2017-0701. PMID: 29197859.
crossref
28. Schønning K, Johansen K, Nielsen LG, Weis N, Westh H. 2018; Analytical performance of the Hologic Aptima HBV Quant assay and the COBAS Ampliprep/COBAS TaqMan HBV test v2.0 for the quantification of HBV DNA in plasma samples. J Clin Virol. 104:83–8. DOI: 10.1016/j.jcv.2018.05.007. PMID: 29783147.
crossref
29. Mwau M, Mbugua J, Danda J, Handa A, Worlock A, Kim HC, et al. 2020; Performance evaluation of the Aptima HIV-1 Quant Dx assay for detection of HIV in infants in Kenya. J Clin Virol. 125:104289. DOI: 10.1016/j.jcv.2020.104289. PMID: 32097889.
crossref
30. Rossetti R, Smith T, Luo W, Taussig J, Valentine-Graves M, Sullivan P, et al. 2020; Performance evaluation of the Aptima HIV-1 RNA Quant assay on the Panther system using the standard and dilution protocols. J Clin Virol. 129:104479. DOI: 10.1016/j.jcv.2020.104479. PMID: 32531665. PMCID: PMC7395893.
crossref
31. Aretzweiler G, Leuchter S, Simon CO, Marins E, Frontzek A. 2019; Generating timely molecular diagnostic test results: workflow comparison of the cobas® 6800/8800 to Panther. Expert Rev Mol Diagn. 19:951–7. DOI: 10.1080/14737159.2019.1665999. PMID: 31526152.
crossref
32. Maasoumy Bz, Geretti AM, Frontzek A, Austin H, Aretzweiler G, Garcia-Álvarez M, et al. 2020; HBV-RNA co-amplification may influence HBV DNA viral load determination. Hepatol Commun. 4:983–97. DOI: 10.1002/hep4.1520. PMID: 32626831. PMCID: PMC7327219.
crossref
33. CLSI. 2014. Evaluation of precision of quantitative measurement procedure; approved guideline. Clinical Laboratory Standards Institute;Wayne, PA: 3rd ed. EP05A3.
34. CLSI. 2003. Evaluation of the linearity of quantitative measurement procedures: a statistical approach; approved guideline. EP06-A. Clinical and Laboratory Standards Institute;Wayne, PA:
35. Stanford University HIV Drug Resistance Database. HIVdb version 9.0. https://hivdb.stanford.edu/hivdb/. Updated on Feb 2021.

Fig. 1
Aptima results obtained with the AccuSpan Linearity Panels. The values are presented as log copies/mL for HIV-1 (A) and log IU/mL for HBV (B) and HCV (C) (N=2 per target concentration level).
alm-42-4-447-f1.tif
Fig. 2
Method comparison for HIV-1 (N=196), HBV (N=182), and HCV (N=126) VL assessments. (A) Passing–Bablok regression results for 196 quantitated HIV-1 clinical samples that were assayed with the Aptima and cobas 6800 assays. (B) Bland–Altman plot of the difference between the Aptima and cobas 6800 HIV results vs. the mean. The mean bias was –0.27 log copies/mL, with 95% CIs ranging from –0.84 to 0.29 log copies/mL. (C) Passing–Bablok regression for 182 quantitated HBV clinical samples that were assayed with both the Aptima and cobas 6800 assays. (D) Bland–Altman plot of the differences between the Aptima and cobas 6800 HBV results vs. the mean. The mean bias was –0.02 log copies/mL, with 95% CIs ranging from –0.75 to 0.71 log copies/mL. (E) Passing–Bablok regression results for 126 quantitated HCV clinical samples that were assayed with the Aptima and cobas 6800 assays. (F) Bland–Altman plot of the differences between the Aptima and cobas 6800 HCV results vs. the mean. The mean bias was –0.14 log copies/mL, with 95% CIs ranging from –1.00 to 0.72 log copies/mL.
Abbreviation: CI, confidence interval.
alm-42-4-447-f2.tif
Table 1
Characteristics of the Panther and cobas 6800 automated molecular platforms
Panther* Cobas 6800
Principle Transcription-mediated amplification Real-time quantitative PCR
Assay type Fully automated, random-access system Fully automated, batched system
Targets HIV-1 Pol, LTR regions Gag gene and LTR region
HBV Pol, surface (S) gene Pol, precore region
HCV 5´ UTR 5´ UTR
Sample type HIV-1 Plasma, DBS Plasma, PSC
HBV Plasma, serum Plasma, serum
HCV Plasma, serum Plasma, serum
Sample volume 1200 μL (primary tube), 700 μL (secondary tube) 650 μL
Sample processing volume 500 μL 500 μL
Limit of detection HIV-1 12 copies/mL 13.2 copies/mL
HBV 4.8 IU/mL (plasma), 5.9 IU/mL (serum) 2.7 IU/mL (plasma), 2.4 IU/mL (serum)
HCV 3.9 IU/mL (plasma), 3.4 IU/mL (serum) 8.5 IU/mL (plasma), 9.6 IU/mL (serum)
Linear assay range HIV-1 30–1 × 10⁶ copies/mL 20–1 × 10⁷ copies/mL
HBV 10–1 × 10⁹ IU/mL 10–1 × 10⁹ IU/mL
HCV 10–1 × 10⁸ IU/mL 15–1 × 10⁸ IU/mL
Time to results from start ~ 210 minutes for five results ~ 180 minutes for 96 results
Result timeline five results every 5 minutes 93-minute average time between plates

*The Panther platform was used for the Aptima assays; The Cobas 6800 platform was used for the cobas 6800 assays.

Abbreviations: Pol, polymerase; LTR, long terminal repeat; HIV, Human immunodeficiency virus; HBV, hepatitis B virus; HCV, hepatitis C virus; 5´ UTR, 5´ untranslated region; DBS, dried blood spot; PSC, plasma separation card.

Table 2
Intra- and inter-assay precision of the Aptima and cobas 6800 assays
Aptima cobas 6800


Intra-assay Inter-assay Intra-assay Inter-assay
Low-concentration positive control
HIV-1
Mean (log copies/mL) 2.91 2.91 2.38 2.35
SD (log copies/mL) 0.06 0.09 0.07 0.09
CV (%) 1.90 3.10 2.80 3.90
HBV
Mean (log IU/mL) 2.77 2.77 1.75 1.64
SD (log IU/mL) 0.04 0.06 0.08 0.07
CV (%) 1.35 2.21 4.71 4.32
HCV
Mean (log IU/mL) 2.32 2.32 2.93 2.96
SD (log IU/mL) 0.06 0.06 0.05 0.04
CV (%) 2.58 2.58 1.69 1.48
High-concentration positive control
HIV-1
Mean (log copies/mL) 5.20 5.20 5.51 5.51
SD (log copies/mL) 0.04 0.06 0.06 0.07
CV (%) 0.80 1.10 1.18 1.29
HBV
Mean (log IU/mL) 4.50 4.50 5.34 5.27
SD (log IU/mL) 0.04 0.05 0.08 0.11
CV (%) 0.87 1.11 1.43 2.11
HCV
Mean (log IU/mL) 5.41 5.41 7.01 7.03
SD (log IU/mL) 0.07 0.10 0.04 0.04
CV (%) 1.33 1.76 0.61 0.52
Table 3
Agreement between the results obtained using the Aptima and cobas 6800 assays in terms of detection and quantitation of HIV-1, HBV, and HCV in clinical plasma samples
cobas 6800 Aptima

TND < LLOQ Quantitated Total
HIV-1 TND 89 11 0 100
< LLOQ 0 0 0 0
Quantitated 2 3 196 201
Total 91 14 196 301
HBV TND 71 28 1 100
< LLOQ 0 0 0 0
Quantitated 1 17 182 200
Total 72 45 183 300
HCV TND 98 1 2 101
< LLOQ 1 3 2 6
Quantitated 0 6 126 132
Total 99 10 130 239

Abbreviations: TND, target not detected;<LLOQ, below the lower limit of quantitation.

Table 4
Analytical sensitivity of the Aptima assays assessed using clinical samples at different target concentrations
Concentration of target Detected N (%) Quantitated N (%)
HIV-1 (copies/mL) 20 20 (100) 11 (55)
30 20 (100) 20 (100)
40 20 (100) 20 (100)
HBV (IU/mL) 5 19 (95) 4 (20)
7.5 20 (100) 3 (15)
10 20 (100) 10 (50)
15 20 (100) 14 (70)
HCV (IU/mL) 5 20 (100) 10 (50)
7.5 20 (100) 13 (65)
10 20 (100) 17 (85)
15 20 (100) 19 (95)
TOOLS
Similar articles