Journal List > Int J Stem Cells > v.12(1) > 1158998

Zhang, Kasoju, Li, Ma, Yang, Cui, Wang, and Ye: Effect of Substrate Topography and Chemistry on Human Mesenchymal Stem Cell Markers: A Transcriptome Study

Abstract

Background and Objectives

The International Society for Cellular Therapy (ISCT) proposed a set of minimal markers for identifying human mesenchymal stromal cells (hMSCs) in 2007. Since then, with the growing interest of better characterising hMSCs, various additional surface markers have been proposed. However, the impact of how culture conditions, in particular, the culture surface, vary the expression of hMSC markers was overlooked.

Methods and Results

In this study, we utilized the RNA sequencing data on hMSCs cultured on different surfaces to investigate the variation of the proposed hMSC biomarkers. One of the three ISCT proposed positive biomarker, CD90 was found to be significantly down regulated on hMSCs culture on fibrous surfaces when compared to flat surfaces. The detected gene expression values for 177 hMSCs biomarkers compiled from the literature are reported here. Correlation and cluster analysis revealed the existence of different biomarker communities that displayed a similar expression profile. We found a list of hMSCs biomarkers which are the least sensitive to a change in surface properties and another list of biomarkers which are found to have high sensitivity to a change in surface properties.

Conclusions

This study demonstrated that substrate properties have paramount effect on altering the expressions of hMSCs biomarkers and the proposed list of substrate-stable and substrate-sensitive biomarkers would better assist in the population characterisation. However, proteomic level analysis would be essential to confirm the observations noted.

Introduction

Mesenchymal stromal cells (MSCs), the clonogenic fibroblastic colony-forming units, hold immense potential as cells of choice in tissue engineering and regenerative medicine applications. Though bone marrow was the first and widely recognized source tissue, the latest investigations have led to the discovery of a wide variety of MSCs-harbouring placenta, umbilical cord and virtually any vascularized tissue (1). MSCs can not only be differentiated into tissue-specific lineages but can also be trans-differentiated across lineages (2). Apart from such multipotency, the immunomodulatory property of MSCs is attracting attention (3). While these developments highlight the potential of MSCs, they also lead to some confusion in the field, majorly due to the identity paradox. To this effect, the International Society for Cellular Therapy (ISCT) proposed (a) plastic-adherence nature, (b) CD105+, CD73+, CD90+, and CD45, CD34, CD14 or CD11b, CD79α or CD19 and HLA-DR surface markers, and (c) tri-potency ability as the defining criteria to identify MSCs (4). Recently, a few others such as Stro-1, CD146 and CD49f were also proposed as candidate markers. However, source dependent differences left MSC identity still obscure. Besides, the discovery of culture conditions dependent effects on surface marker expression, such as induction of SSEA-4 by fetal calf serum (5), and suppression of CD49f by confluency (6), further enhanced the ambiguity over MSCs identity. Pham et al. showed that cryopreservation reduced the expression of CD73 (7). Lv et al. articulated these issues in great detail in their recent review (8).
Along with conventional culture conditions optimization studies, investigations on the use of biomaterials to help translate MSC therapy from bench to bedside are on the rise (9). It is an indisputable fact that the use of biomaterials in facilitating isolation (10), in enhancing in vitro expansion (11), in long-term storage (12), in modulating differentiation (13), and in aiding site specific delivery (14), has expanded the horizons of MSCs to the next level. In this regard, it is important to understand the underlying cell – biomaterial interactions since subtle alterations in substrate topography and chemistry influence the cell fate to a significant extent (1517). For instance, McMurray et al. discovered that a nano structured surface retains stem-cell phenotype and maintains stem-cell growth over eight weeks (18), while, Dalby et al. demonstrated the use of nano scale disorder to stimulate MSCs to produce bone mineral in vitro (19). Similarly, Benoit et al. reported that substrates functionalized with small molecules can control MSCs differentiation encapsulated in hydrogels (20), while, induction of osteogenic and adipogenic differentiation on amine functionalized surfaces in contrast to pristine samples shows the effect of surface chemistry on cell response (21). Whereas there is evidence on how biomaterials act in terms of controlling stem cell differentiation, there is little information on whether or not these biomaterials have any influence on surface marker expression in the context of MSCs expansion.
Such information is needed not just to ensure quality control of the expanded MSCs but to design next-generation biomaterials-based substrates for MSCs expansion. Inspired by observations of Zamparelli et al. (22) and Duffy et al. (23) on the effect of biomaterials on surface antigen expression in MSCs, here, we designed a study to unravel the effects of substrate topography and substrate chemistry on expression levels of surface markers in human bone marrow-derived MSCs (hbm-MSCs). However, unlike conventional flow cytometry or qRT-PCR methods, here we tested the gene expression levels by following the whole transcriptome shotgun sequencing, also known as RNA-sequencing (24, 25). This next-generation sequencing approach helps to (a) evaluate the stability and sensitivity of ISCT and few other known hMSCs markers, (b) identify potential gene networks or molecular pathways associated with these markers, and (c) screen for new substrate-stable and substrate-sensitive candidate markers. For this, we have prepared poly (L-lactide) (PLLA) based substrates with two variables of topography viz. flat (Fl) and fibrous (Fs) and two variables of chemistry viz. pristine (Pr) and aminated (Am). The flat PLLA surface (Fl-PLLA) represents a conventional two-dimensional culture substrate, whereas, the fibrous PLLA (Fs-PLLA) surface represents an advanced three-dimensional culture substrate. The pristine PLLA (Pr-PLLA) surface represents a hydrophobic surface that a majority of synthetic polymers exhibit, whereas, the aminated PLLA (Am-PLLA) surface represents a hydrophilic surface that a majority of natural polymers exhibit. The cell response on the test materials (Fl-Pr-PLLA, Fl-Am-PLLA, Fs-Pr-PLLA and Fs-Am-PLLA) was compared with that on a control plate (TCPS).

Materials and Methods

Surface material, cell culture and RNA extraction

The detailed information on surface preparation, cell culture and RNA extraction has been reported previously (26). A total of four synthesized surfaces and tissue culture plate were used for cell culture. The four surfaces were synthesized with poly (L) Lactic acid (PLLA), including two types of surface topography (flat – Fl or fibrous −Fs) and two types of surface chemistry (aminated – Am or non-aminated – Pr). The standard tissue culture polystyrene substrate was used as the control surface.
Human bone marrow-derived mesenchymal stem cells (hbm-MSCs, PoieticsTM, cat. no. PT-2501, Lonza UK), were cultured in a proprietary medium (cat. no. PT-3001, Lonza UK), supplemented with antibiotics (10 U/mL penicillin and 10 μg/mL streptomycin, Thermo Scientific, UK). Cells were routinely incubated in a CO2 (5%) incubator maintained at 37°C temperature, 95% relative humidity. hbm-MSCs (passage 3) were seeded onto various test and control substrates at a rate of 50,000 cells/well and cultured for 7 days with viability measured at day 3, 5 and 7 using the Alamar blue assay (Thermo Scientific, UK).
RNA extraction was done using the RNeasy Mini Kit and followed the supplier’s instructions (Qiagen, UK). RNA agarose gel electrophoresis and Nanodrop spectrophotometer (1000, Thermo Scientific) were used to check the quality and quantity of the extracted RNA (26). RNA was isolated at each time point; however, RNA Seq was done for day 3 sample to capture the substrate-induced early commitment of MSCs.

RNA sequencing

Total RNAs were extracted from all samples using a commercial extraction kit (RNeasy Mini kit, Cat No. 74106). Sequencing platform of BGI-500 (BGI, Shenzhen, China) was used to obtain gene expression profiles. SOAP-nuke was used to remove low quality reads. Quality control checks were performed to confirm sequencing saturation and gene mapping distribution. Fragments per Kilobase of Transcript per Million mapped reads (FPKM) value were used to express relative gene abundance. Genes with expression levels less than 1 across all samples were neglected in order to increase data set confidence.

Data analysis

Previously reported 177 hMSCs biomarkers were compiled from the literature (8, 27, 28), including proteoglycans, adhesion molecules, receptors, etc. The full list of genes is included in Supplementary Table S1. The expression levels for these biomarkers were checked against the samples cultured on different surfaces in this study. Hierarchical cluster analysis was conducted on the compiled biomarkers and the total sequenced genes, samples were grouped based on their pair wise differences.
Gene-wide correlation analysis was performed with p<0.01 and the Pearson coefficient (r) >0.9 or <−0.9. Normalized standard deviation, also known as coefficient of variation, was used to quantify the stability or sensitivity of gene expression across samples. The stability and sensitivity of the biomarkers was examined by evaluating the consistency of expression in samples cultured on the different types of surfaces. Differentially expressed genes were determined with greater than one-fold change in pair wise comparison and a false discovery rate less than 0.001.
The biomarker expressions and correlations were used to develop a network structure and was graphically represented using Cytoscape (29). Positive and negative correlations of each gene expression across samples was determined. The average expression levels for each gene and their ranked percentile determines the size of the node. Cluster analysis was conducted using Newman’s method, edge between-ness and modularity were determined as the method described in (30). The Octave-networks-toolbox was utilized (31). The modularity for the different number of communities were screened, the number of communities with the highest modularity was selected as the optimal clustering configuration. The optimal clustering configuration was processed using the Newman-Girvan algorithm to generate the distribution and the specific genes for each cluster. The clusters with more than five nodes/genes were considered as true clusters and further analysed.

Results and Discussion

General characteristics of materials and cell response

Details of the material characteristics such as morphological features of Fl-PLLA and Fs-PLLA before and after amination by SEM, confirmation of amine functionalization by FITC staining and ATR-FTIR was previously reported by our group (26). The diameter of electrospun fibres of Fs-PLLA scaffold used in the study was 603±197 nm (Mean±SD). There was no significant change in the fibre diameter after amine functionalization, as confirmed by SEM. Besides, qualitative and quantitative analysis of cell adhesion and proliferation on various substrates was also previously reported by our group (26). Briefly, the cellular adhesion and proliferation was relatively high on control TCP substrate compared to test PLLA substrates. This was apparently due to lack of RGD moieties on PLLA. Amongst the test substrates, significant changes in the overall cell response was noted amongst substrates varying in surface topography (Fs-PLLA and Fl-PLLA) than the surface chemistry (Pr-PLLA and Am-PLLA).

Analysis from the perspective of ISCT recommended markers

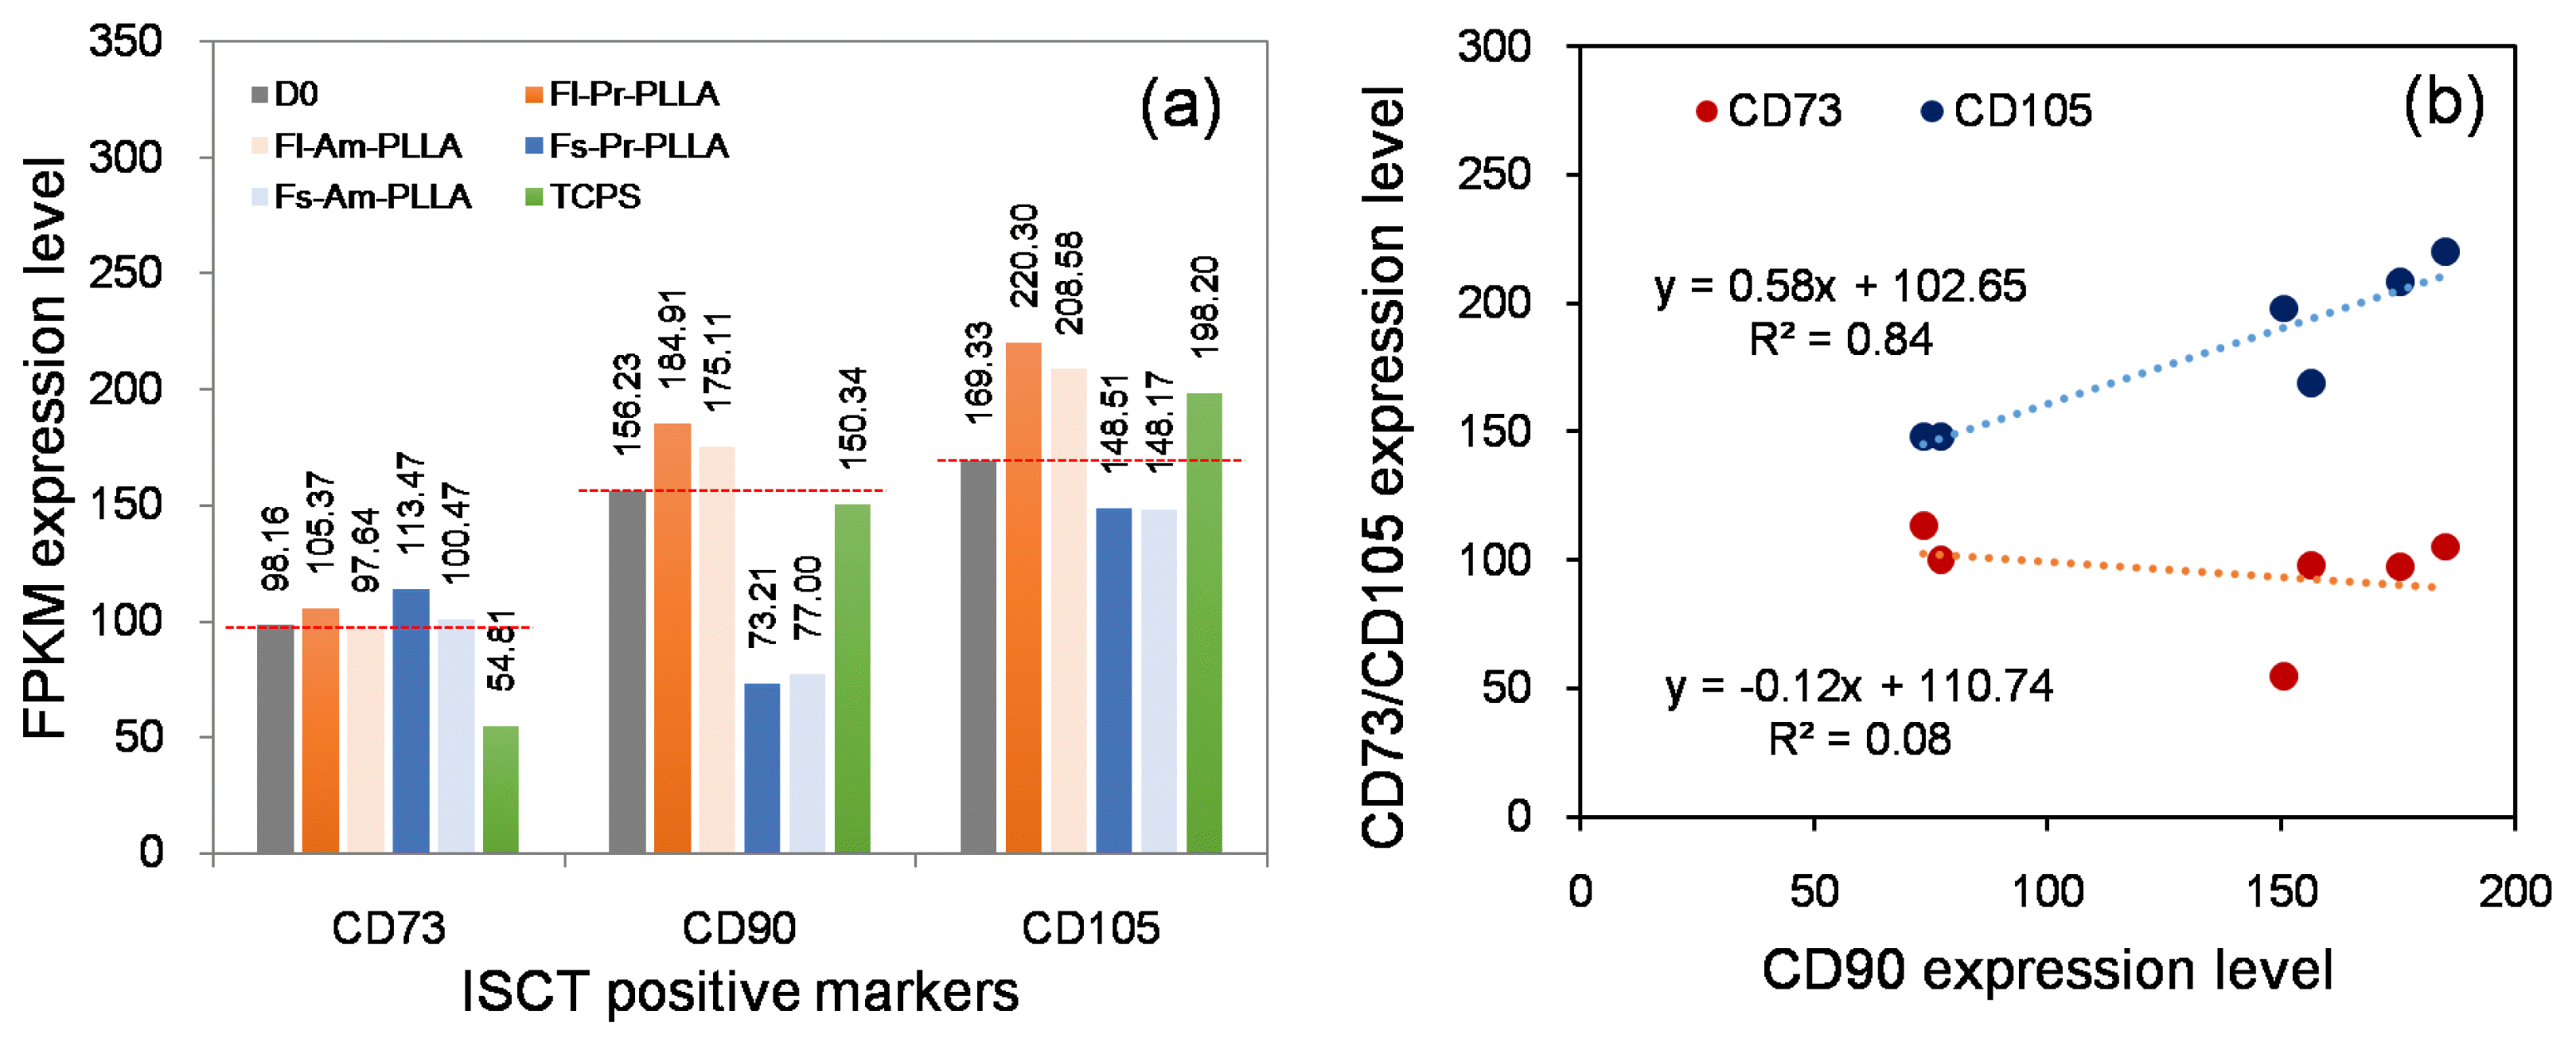
The set of surface markers proposed by ISCT has not only streamlined the scientific investigations on hMSCs, but has also assisted commercial organizations in characterising hMSCs-based products for clinical trials (32). Although there is variability in the marker set reported in the literature, in many cases, the ISCT-proposed set of markers is considered the gold standard (8). Following this trend, in the current study, we started off by investigating the expression profiles of ISCT-proposed markers. With no surprises, irrespective of the culture substrate properties, hMSCs expressed CD105, CD73 and CD90, and were negative for expression of CD45, CD34, CD14, CD19 and HLA-DR (Fig. 1; the expression levels of the negative markers were undetected or found to be negligible, thus are ignored). However, a close look at the relative expression levels revealed two compelling observations: firstly, the expression level of a given marker varied depending on the culture substrate. Typically, hMSCs cultured on flat substrates (Fl-PLLA) showed up regulated surface marker expression as compared to those cultured on fibrous substrates (Fs-PLLA). There was no visible distinction in the surface marker expression in hMSCs cultured on pristine (Pr-PLLA) and aminated (Am-PLLA) substrates. Although the substrate properties were known to modulate the hMSCs fate, little was known of their effects on the surface marker expression levels. Previously, Skardal et al. described that immune-histochemical (IHC) staining for surface markers such as CD90 and CD105 was strong for cells cultured on synthetic substrates with 2~5 kPa stiffness as compared to the cells cultured on stiffer (15, 50 kPa) substrates. Our observations not only support the findings of Skardal et al. but also provide quantitative evidence towards substrate-dependant effects on surface marker expression (33).
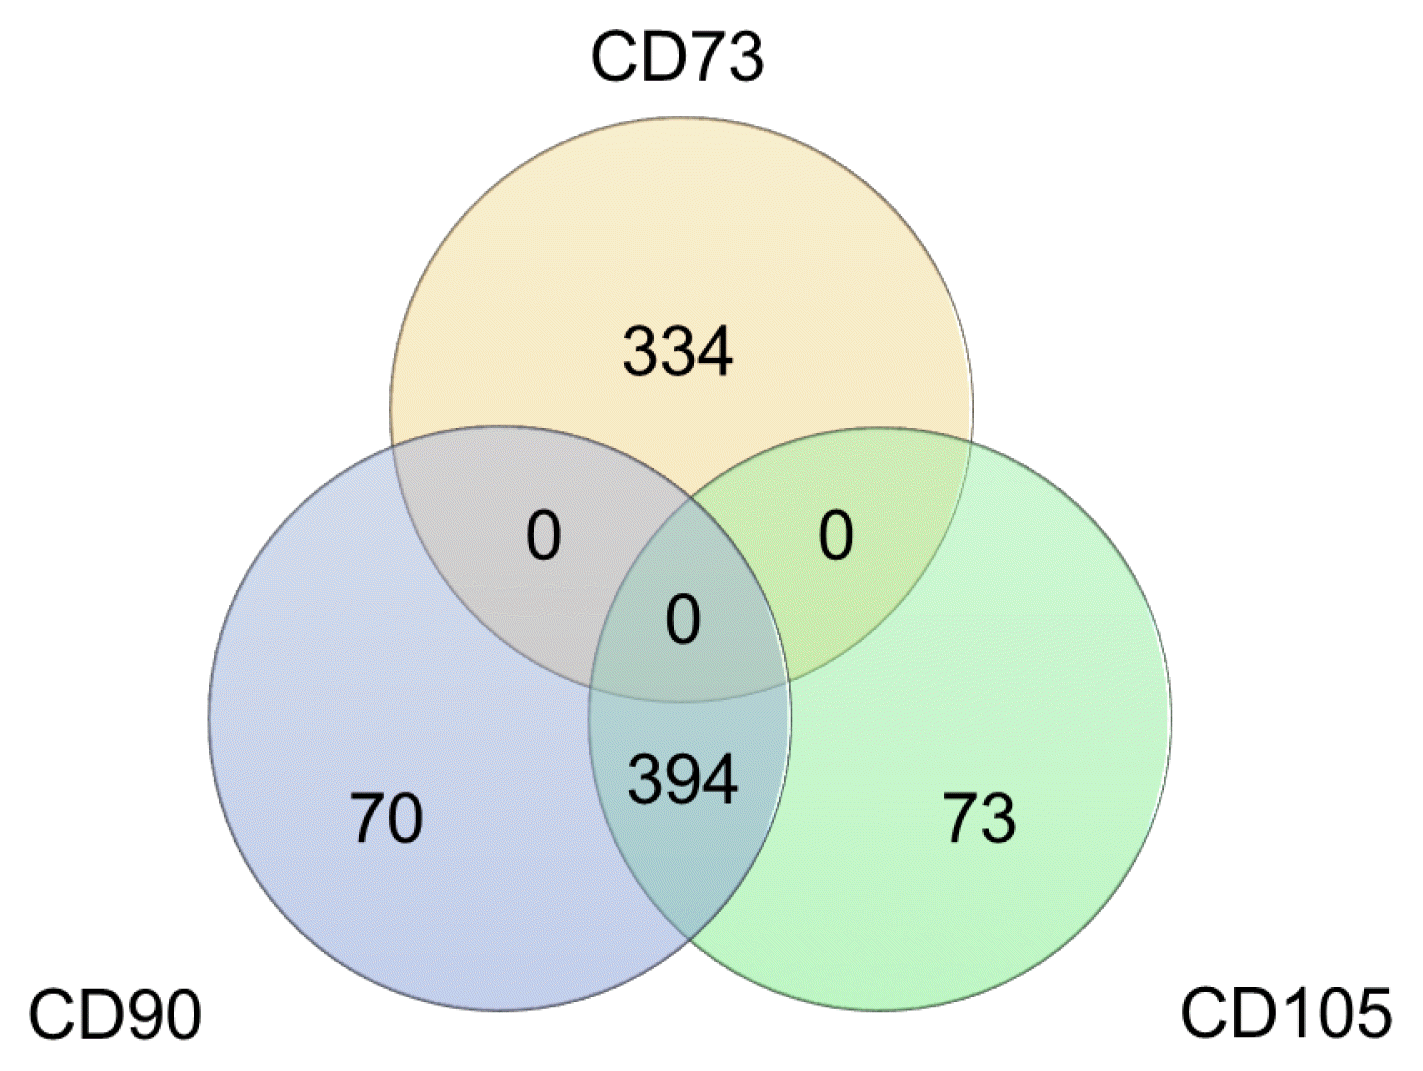
The second curious finding from Fig. 1 was that the overall expression levels of CD105 and CD90 were positively correlated (p=0.0186, r=0.916, Fig. 1) whereas correlation between CD73 and CD90 was not significant (p=0.305, r=−0.276, Fig. 1). Intrigued by this observation, we performed a correlation analysis. Out of 17,748 genes, identified by RNA-seq, across hMSCs samples cultured on five different surfaces, a total of 871 genes were found to have a positive or negative correlation. Of these, 464 genes were correlated with CD90, 467 genes with CD105 and 334 genes with CD73 (Fig. 2). It was again apparent that expression levels of CD105 and CD90 were interactive whereas the CD73 level was independent. Our results comply with those reported by Zamparelli et al. where rat bone marrow-derived MSCs cultured on PLLA substrates showed, using flow cytometry, an 82±8% CD90 positive population but only a 35±19% CD73 positive population (22), and by Skardal et al. where human amniotic fluid-derived MSCs cultured on synthetic substrates showed comparable IHC staining for CD105 and CD90 markers (33). Furthermore, in the current study, CD90 and CD105 shared over 84% (n=394) of their individually correlated genes, whereas CD73 showed no commonly correlated genes with either of the other two markers (Fig. 2). As evident from the NCBI Gene Database, although the genomic context is different, CD90 (THY1) and CD105 (ENG) encode proteins that are involved in cell communication, whereas CD73 (NT5E) encodes a protein that catalyses the conversion of extracellular nucleotides to membrane-permeable nucleosides. Such functional relations may perhaps explain why CD90 and CD105 were expressed correlatively. Additionally, based on a report by Colgan et al. suggesting a major involvement of CD73 in nucleotide metabolism during hypoxia and ischemia, it was most likely that the lower CD73 expression level in the current study may be attributed to the normoxic culture conditions (34).

Analysis from the perspective of a comprehensive list of markers reported in the literature

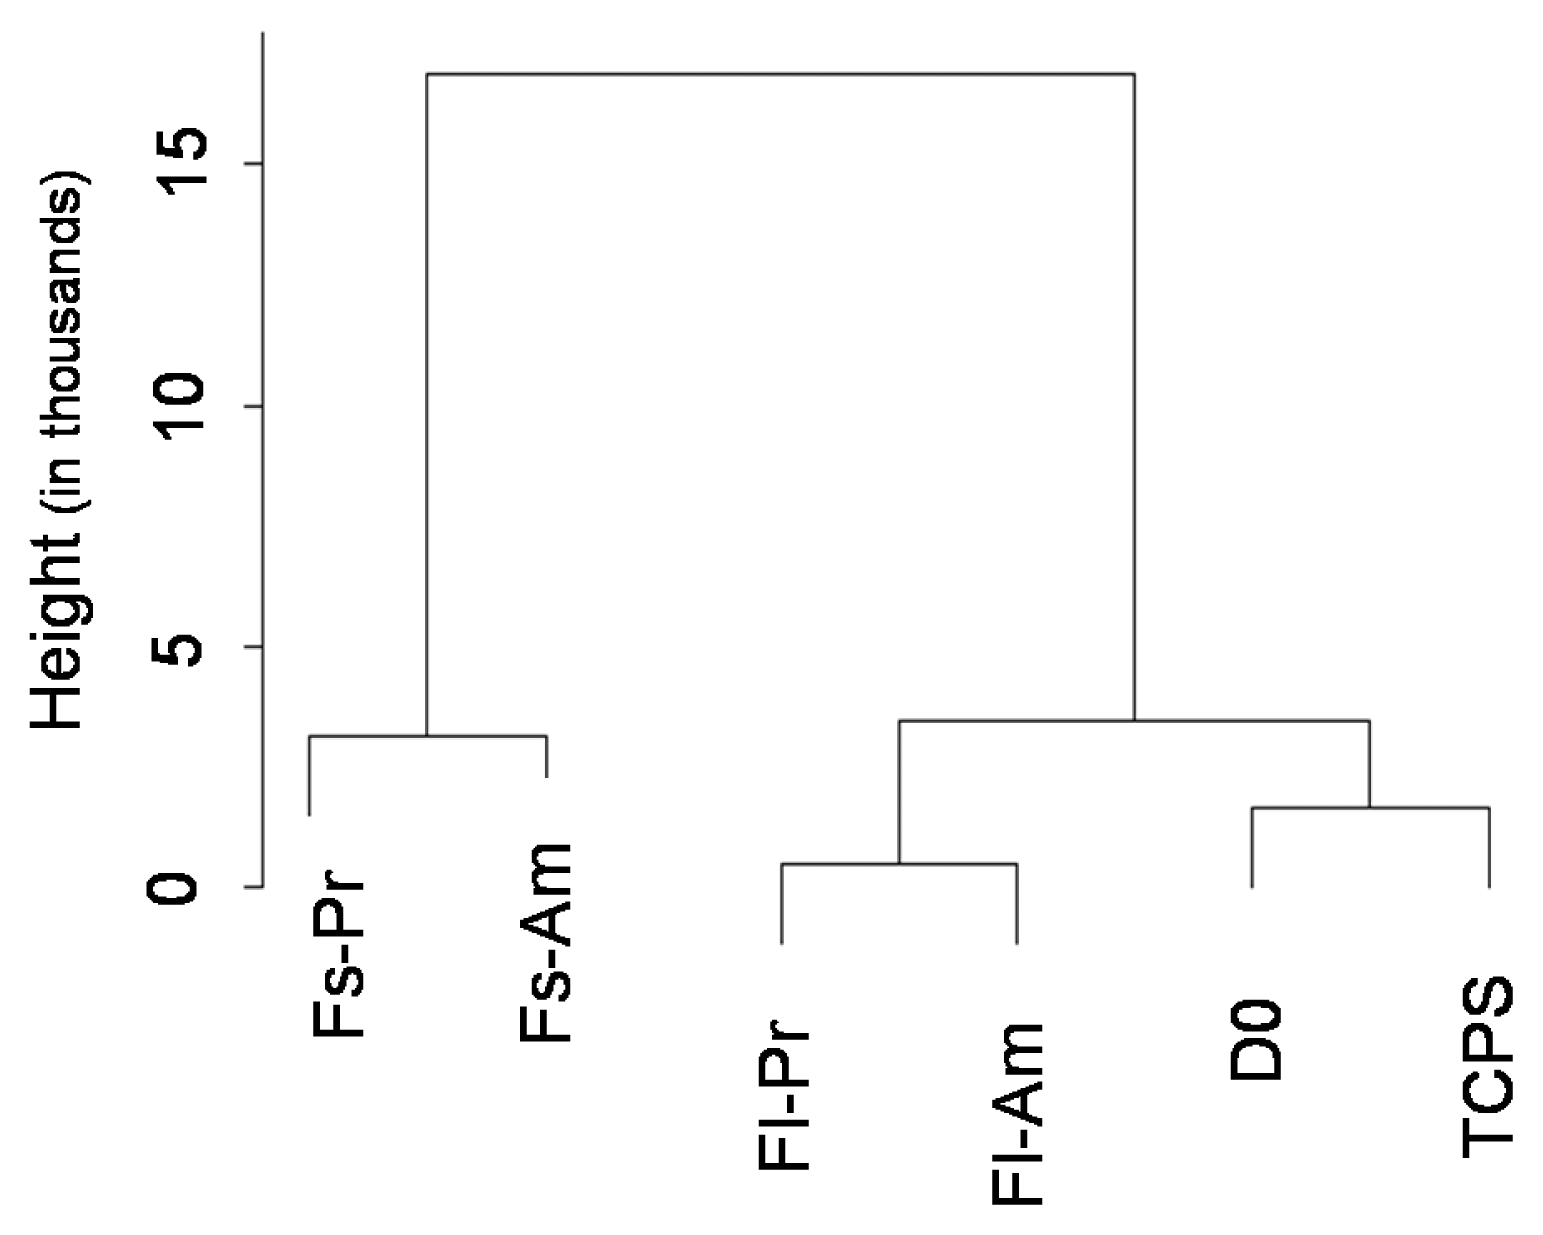
Of the three positive ISCT markers, CD90 and CD105 might be proposed as a substrate-sensitive marker, while CD73 appeared as a substrate-stable marker. However, we believe that the concept of substrate-sensitive/stable markers should be consolidated further, thus incorporation of additional markers is needed to propose a comprehensive set of biomaterials-specific markers for potential use in the field of MSCs-based regenerative medicine. The list of 177 hMSCs markers that were reported in various contexts from the literature is examined (Supplementary Table S1). Overall, the expression profiles between them vary to a significant extent. Preferential expressions of certain markers were observed, where, some markers exhibited stable expression and some showed sensitiveness to a change in culture surface conditions. Expression levels of these 177 biomarkers were subjected to principal component analysis (PCA) analysis and dendrogram analysis. As shown in Fig. 3, the effect of chemistry treatments on the gene expression profile was relatively smaller than that of surface topography induced changes, and the samples cultured on flat surfaces exhibited significantly smaller changes to the control cluster than those in the fibrous samples. This feature conformed to the gene expression patterns reported for all genes (26), strongly suggesting that the marker set genuinely represented the overall gene expression. To our knowledge, this study is the first of its kind reporting the effect of substrate topography and chemistry on the expression of 177 biomarkers reported in the literature.
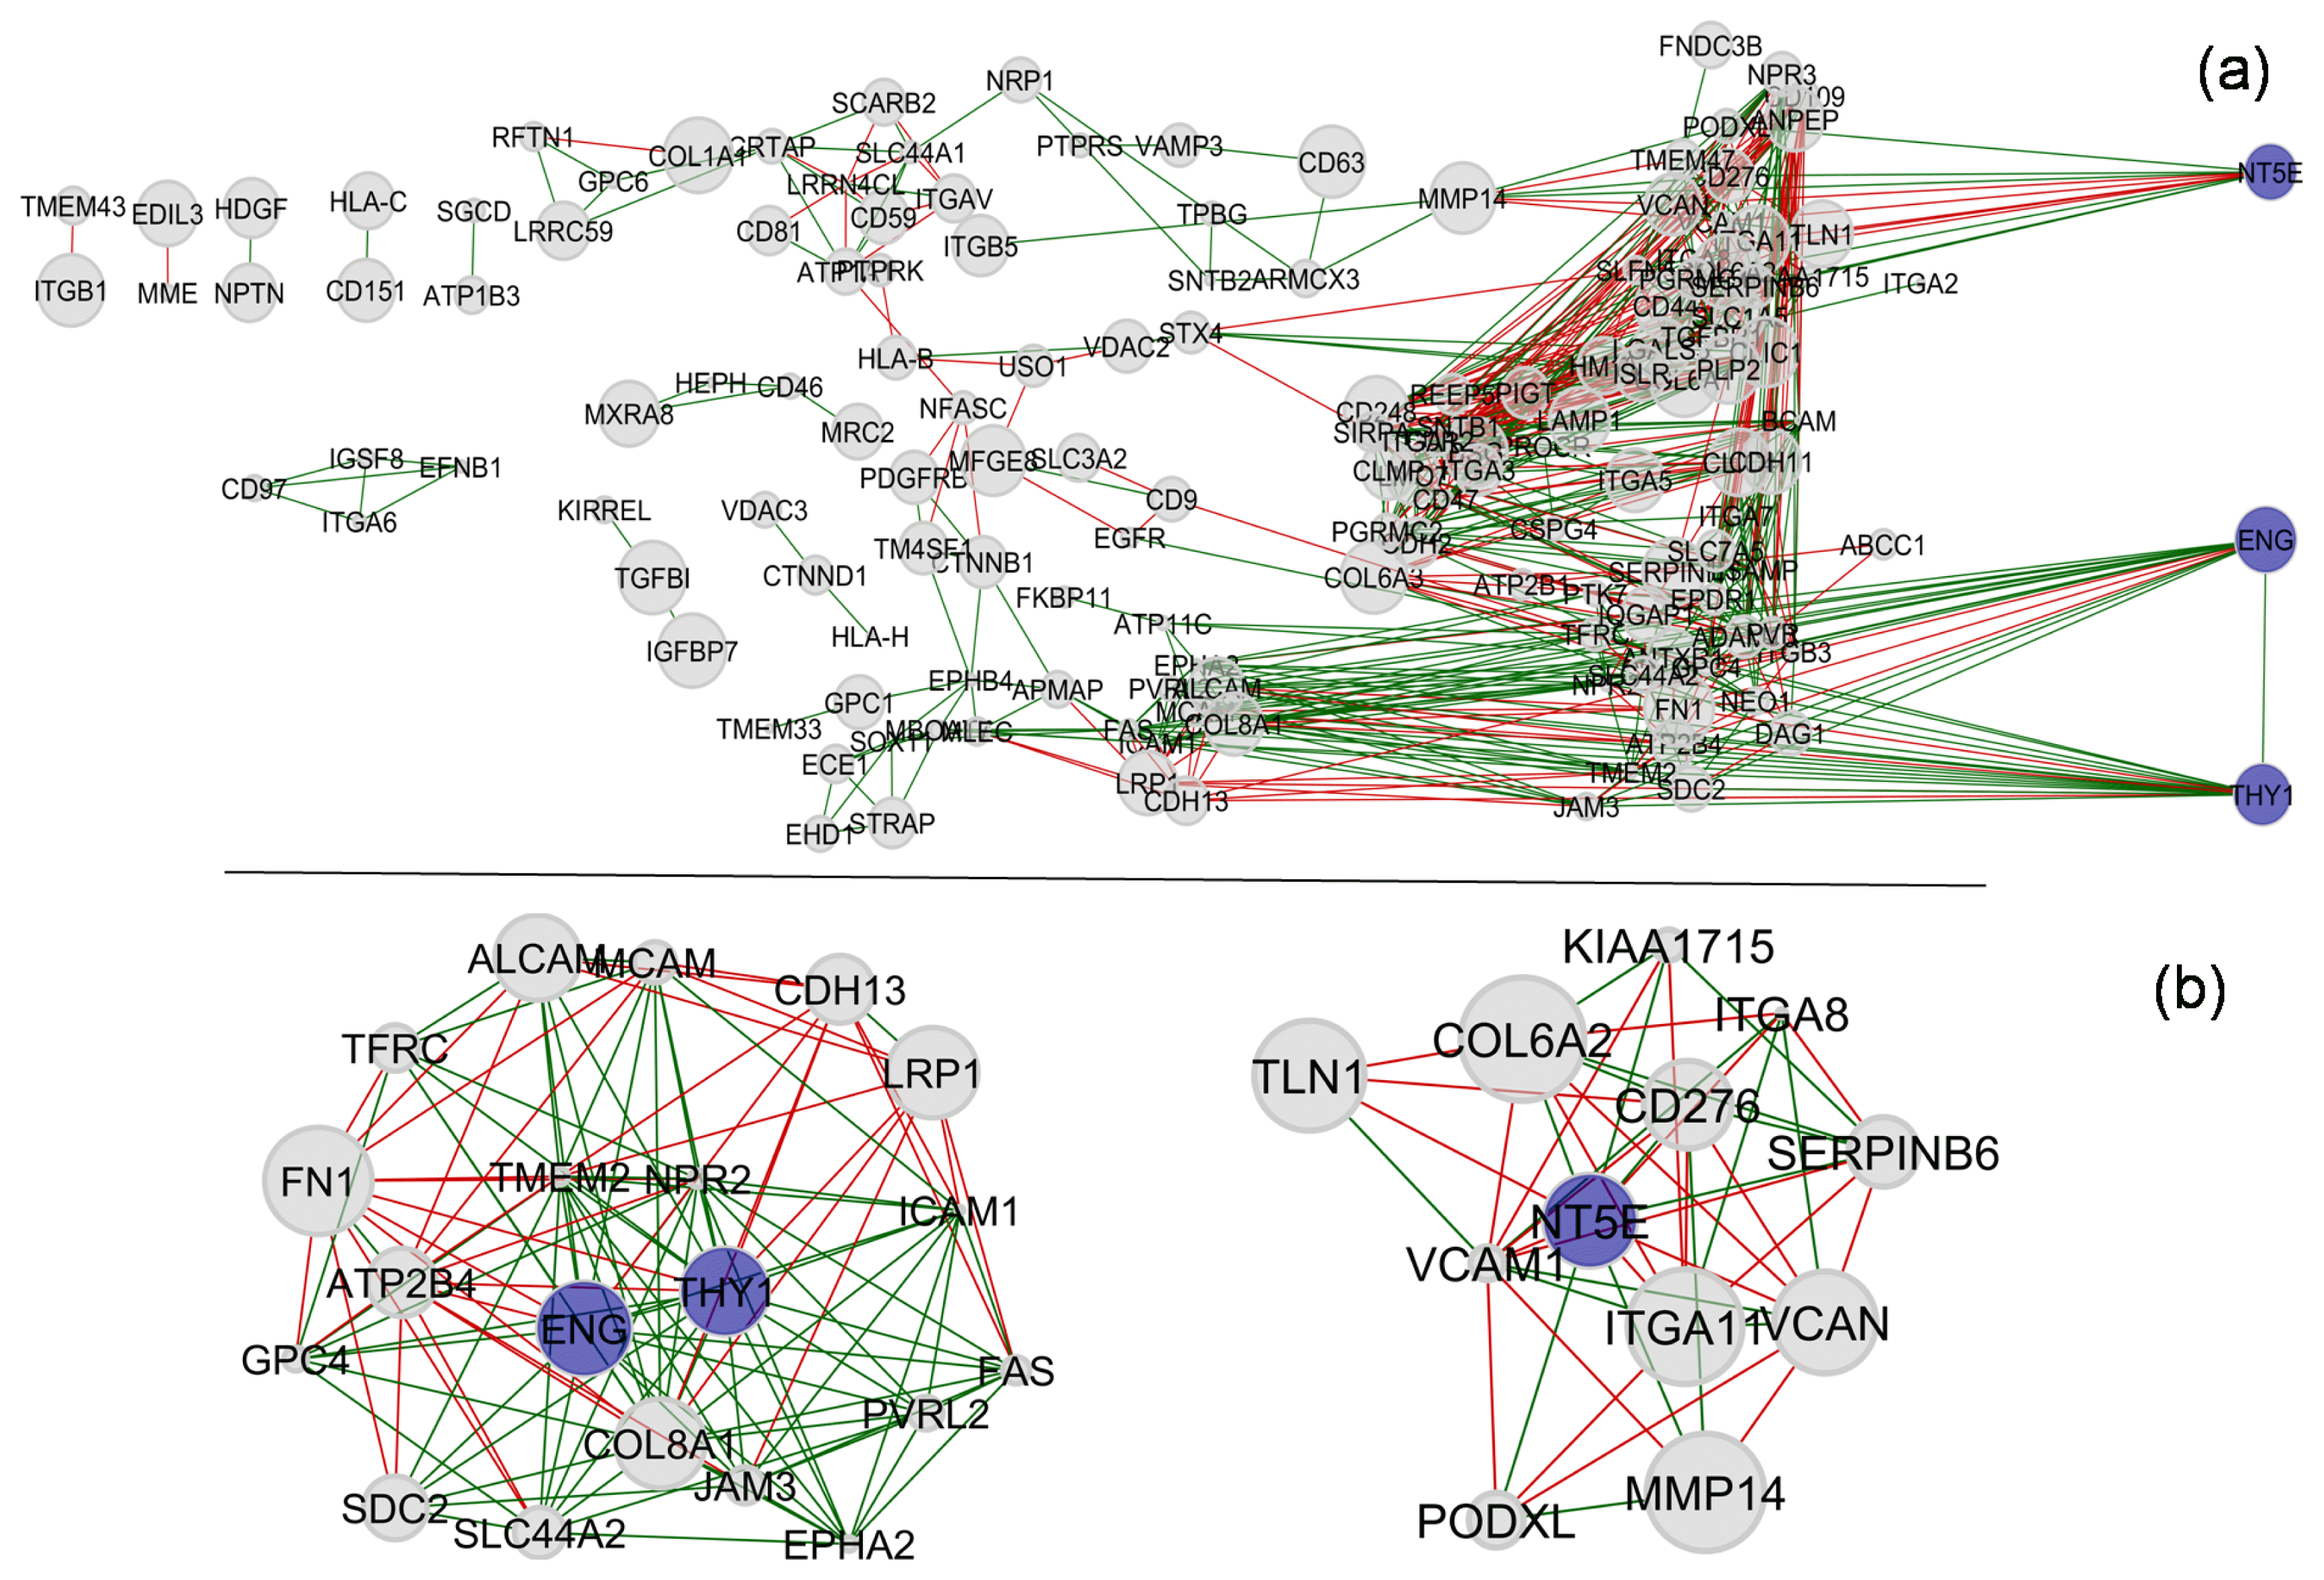
Proceeding further, we have performed a correlation analysis within these 177 biomarker gene expression levels to seek more insights (Fig. 4). Out of 177 marker genes, 22 genes were found without any significantly correlated pairs and therefore were excluded from the figure. Amongst the rest, both positive (represented by the green line) and negative (represented by the red line) correlations were discovered. The statistical relationships were not straight forward and intertwined for most of the genes. However, certain genes were found to correlate to only one or a few other genes. For easy reference, the results are interpreted with reference to the ISCT markers. As shown in Fig. 4a, the three ISCT markers have been rearranged to the right-hand-side of the figure to highlight their high degrees of connectivity within the network. Overall, the percentiles of the average expression levels across samples are represented by the size of the nodes. The three ISCT markers exhibited considerably significant levels of correlation. A positive correlation was identified between CD90 (THY1) and CD105 (ENG), whereas there was no correlation between CD73 (NT5E) and either of the other two. Further, the networks including these three markers and their first-degree-neighbours are isolated and presented in Fig. 4b. There are quite a few first-degreeneighbours of CD90 or CD105 which showed correlation within this network (Supplementary Table S2). However, none of the first-degree-neighbours of CD73 exhibited a correlation with those of CD90 or CD105. This may perhaps be due to the functional context of these genes as discussed earlier.

Findings on biomaterial-stable and sensitive markers

Besides the conventional ISCT markers, we examined the stability of the expressions for the 177 biomarkers as a result of being cultured on different biomaterials. The stability of the gene was quantified by the coefficient of variance (CoV) across samples. A smaller CoV entails a higher independence of this biomarker gene to the culture substrate. The top 10 genes with the lowest coefficient of variance are shown in Table 1. None of these top 10 genes was found to correlate to the three positive ISCT markers.
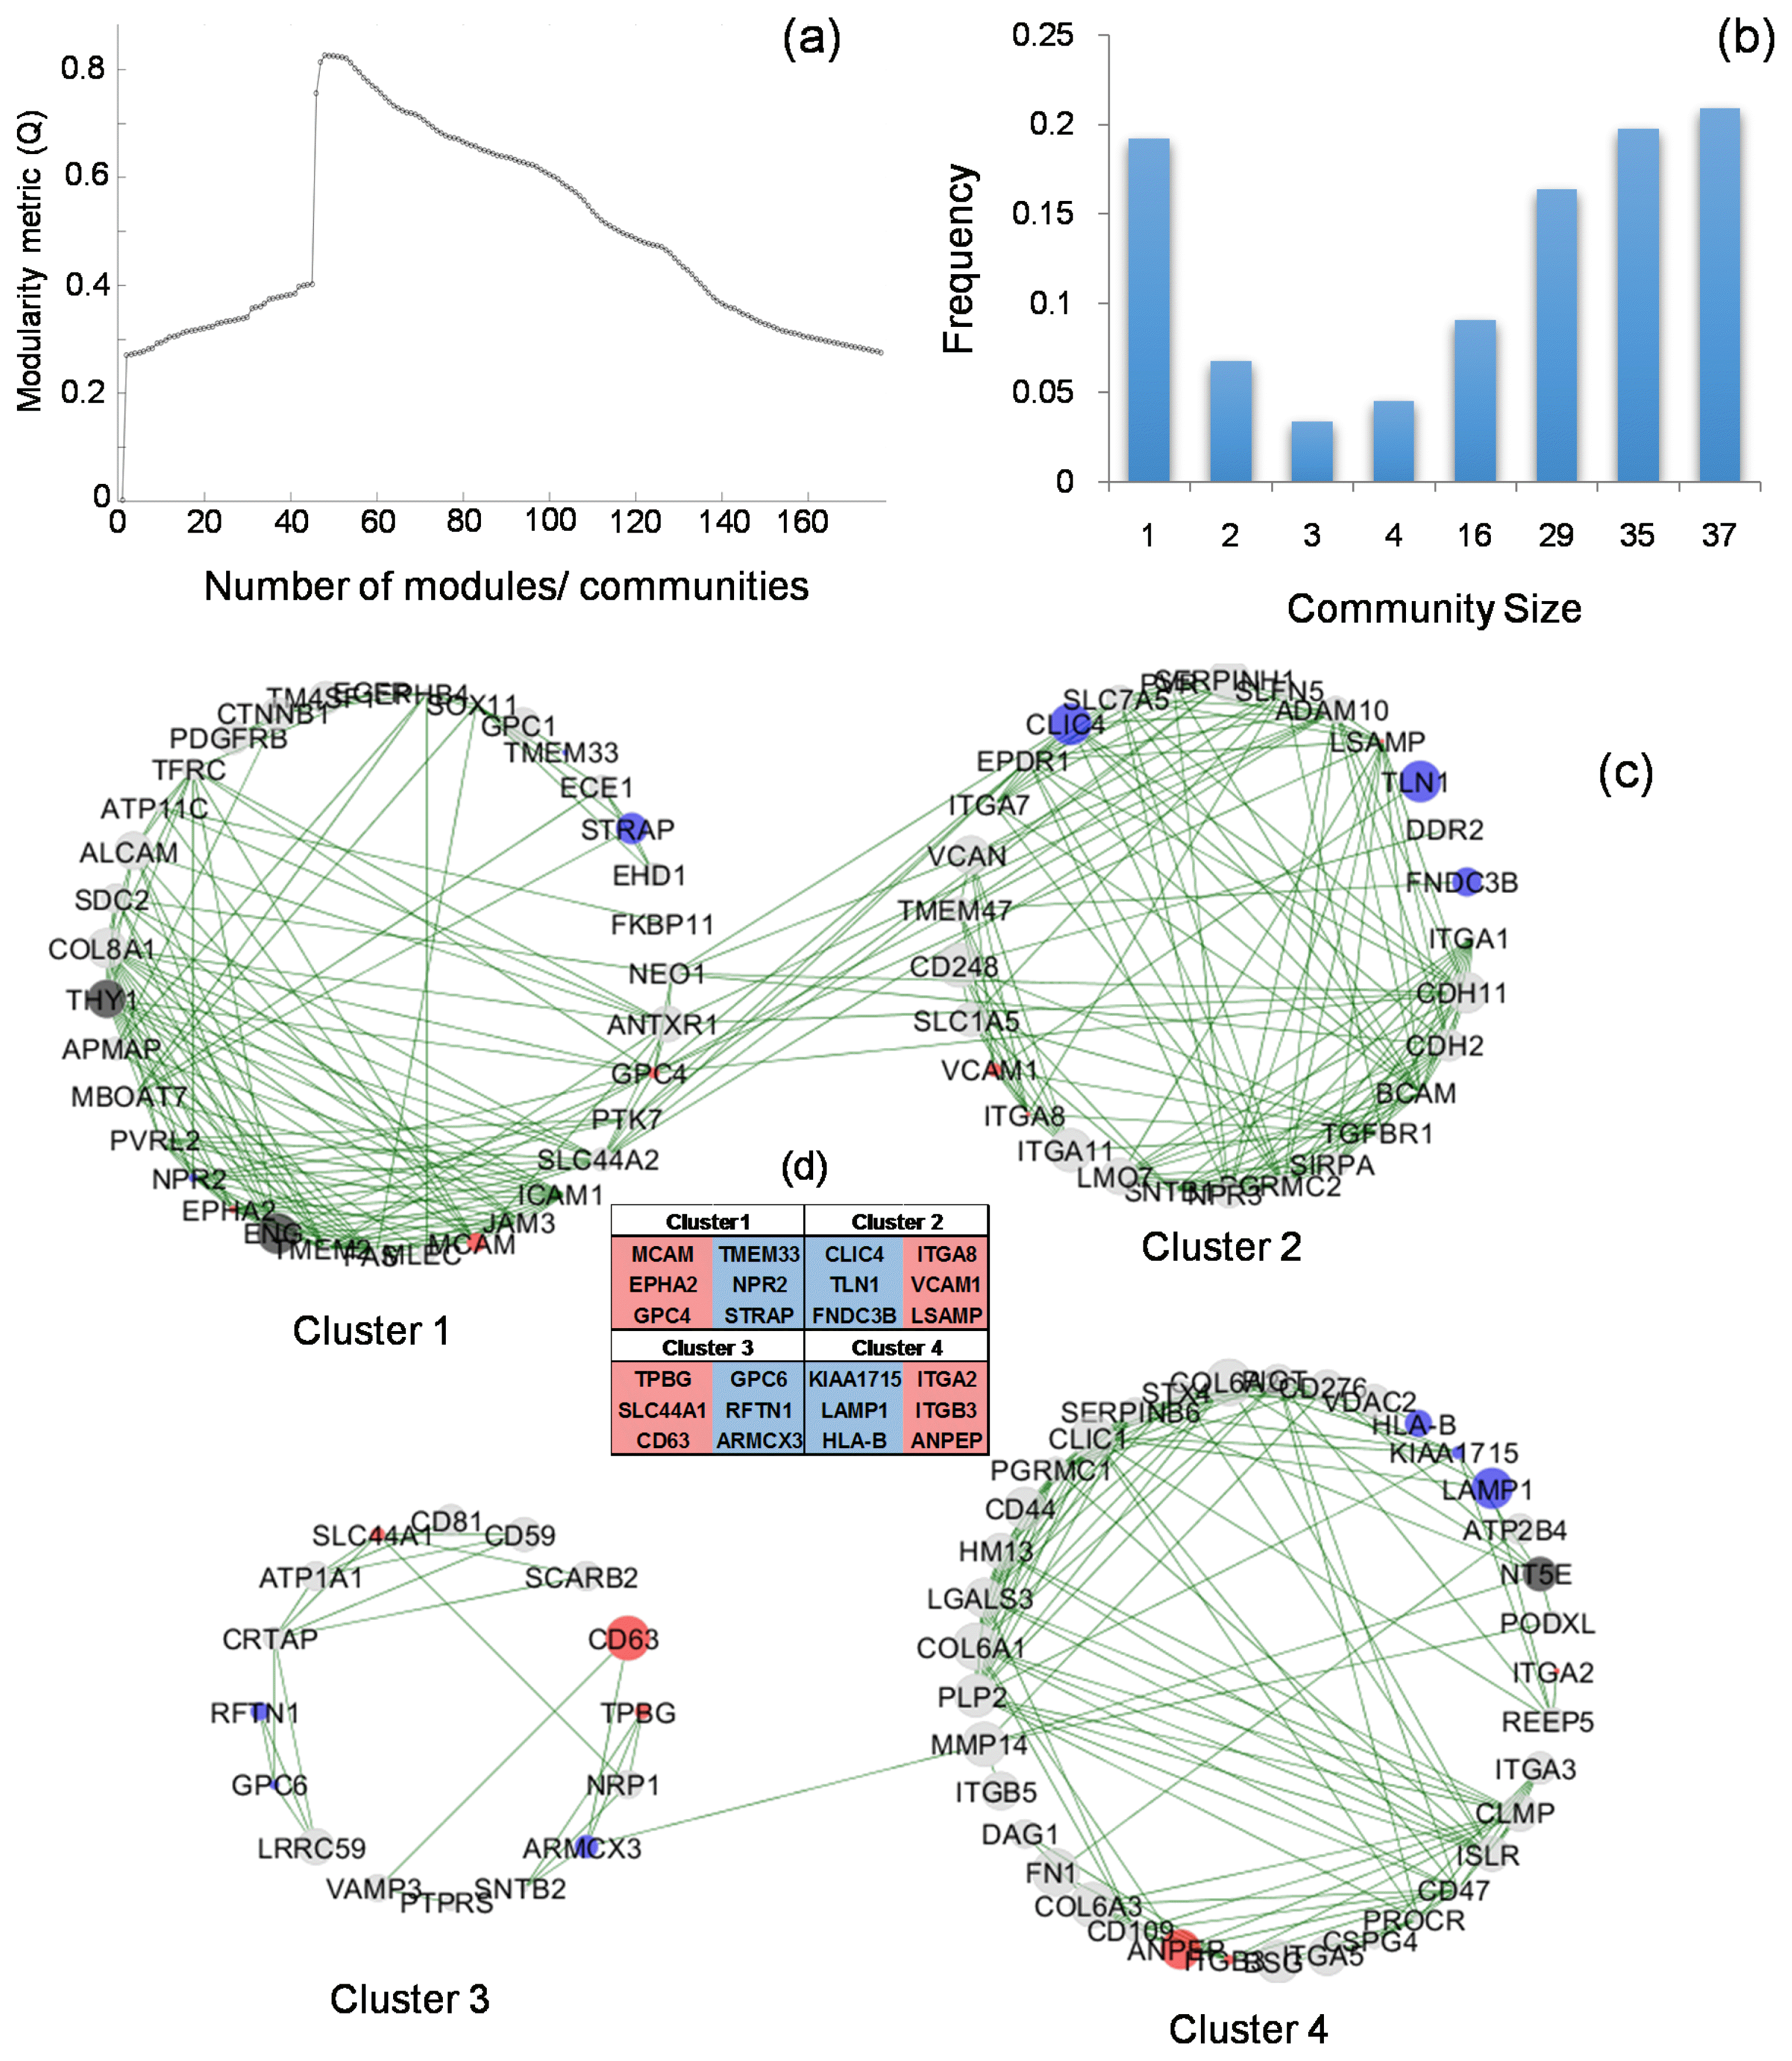
Furthermore, we examined the connectedness of the 177 expressed biomarkers. The positive correlation results from the previous analysis (section 3.2) were subjected to cluster analysis to identify the community groupings that maintain the highest level of network integrity. The grouping that yielded the highest network modularity (Q=0.82) was taken as the set of the most representative clusters (Fig. 5a). A total of 48 communities were identified in this network arrangement, among which four communities consisted of more than five genes. The frequency plot describing the number of genes in each cluster size is shown in Fig. 5b. The correlation between genes and clusters are shown in Fig. 5c. The list of genes in each of these four communities are closely correlated with each other, in other words, the expression of one marker gene is expected to represent that of the others; the top three most stably (in blue) or variably expressed (in red) genes from each of the communities are shown in Fig. 5d as potential marker genes. Representative genes (stably expressed genes in Fig. 5d) from each community can be selected to capture the expression pattern for that population of markers. Consistent with earlier findings, CD90 and CD105 belong to the same community, while CD73 belongs to another community, and there is no correlation detected between the CD73 community and the CD90/CD105 community.
To further investigate the surface sensible markers, we looked at the biomarkers that displayed greater dependency to a change in culture surfaces, in particular, a change in surface topography (between flat and fibrous surfaces). The 17 biomarkers that were found to be differentially expressed between the samples cultured on different topographies are shown in Table 2, including one of the ISCT markers, CD90 (THY1). Among these biomarkers, 13 displayed significant down-regulation when cultured on fibrous surfaces, whereas the other four experienced significant up-regulation.
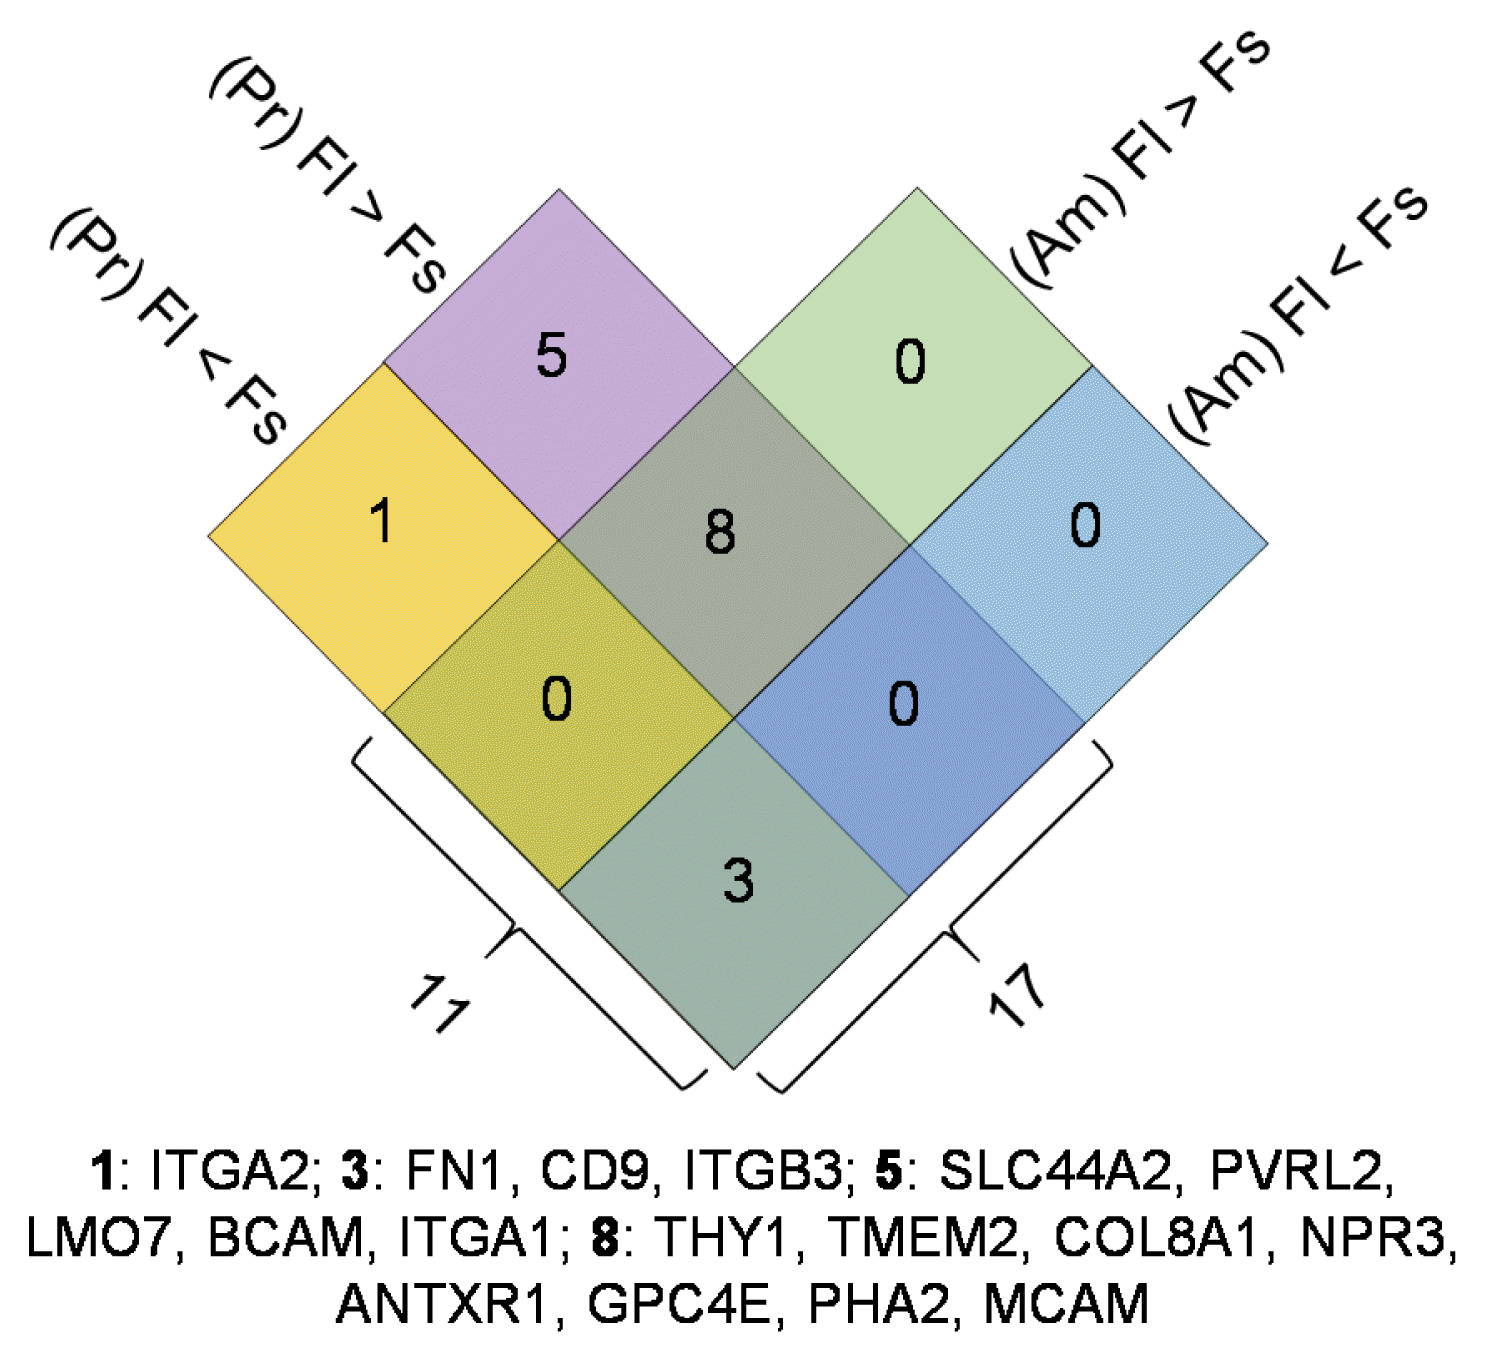
The impact of different chemistry substrates did not significantly alter the expression levels of any of the studied biomarkers. To further illustrate the interactions of surface topography and chemistry, a Venn diagram was prepared to show its differential regulation on both pristine (Pr) and aminated (Am) substrates, as presented in Fig. 6. The numbers of up- and down-regulated genes along with gene names are shown for each chemistry substrate. A total of 17 and 11 biomarkers were found to be differentially regulated by topography, on pristine-based and aminated substrate surfaces, respectively. Among which, nine biomarkers were consistently down-regulated on fibrous surfaces for both substrates, including CD90. The three biomarkers that were significantly up-regulated on fibrous surfaces for both substrates were FN1, CD9 and ITGB3. These 11 (eight down-regulated and three upregulated) genes provide strong evidence demonstrating the sensitivity of these biomarkers to a change in surface topography.

Conclusions

To conclude, we hypothesized that the transcriptome analysis of human bone marrow derived MSCs (hbm-MSCs) cultured on standard tissue culture-treated polystyrene (TCP) and poly (L-lactide) (PLLA) based artificial substrates with varying topography (Fl: flat and Fs: fibrous) and chemistry (Pr: pristine and Am: aminated) could offer novel insights into substrate-specific markers. Apart from ISCT proposed markers, we have identified and compiled 177 markers that are reported in the literature in various contexts. Comparative gene expression level analysis suggested that CD90 and CD105 showed comparable substrate-sensitive response whereas CD73 showed substrate-stable response. A correlative analysis found 871 genes, out of 17748, to be correlated with ISCT markers, of which, CD90 and CD105 showed comparable results that are distinct from CD73. Subsequently, a dendrogram of 177 markers suggested that chemistry induced changes on gene expression profile was relatively smaller than that of surface topography induced changes, and the samples cultured on flat surfaces exhibited significantly smaller differences than those in the fibrous samples. From the correlation analysis, the first-degree-connections of ISCT markers and the 177 markers found in the literatureshowed a correlation between CD90 and CD105 including its neighbors but no correlation with that of CD73 and its neighbors. Positive correlation results yielded a top-10 list of substrate-stable and sensitive markers for hMSCs studies in the context of biomaterials research. Furthermore, among the 48 communities identified from the cluster analysis, the 3 most representative and variable genes were reported for each cluster with greater than 5 genes. The study indicates that an omics approach can help analyse the variations in a comprehensive manner and perhaps give clarity on the MSCs identity in the context of biomaterial research. However, in order to confirm that the changes observed at the gene transcription level are reflected at the protein level, a proteomic analysis may be required.

Supplementary Information

Acknowledgments

We are grateful to China Regenerative Medicine International Limited, Hong Kong for funding this work.

Notes

Potential Conflict of Interest

The authors have no conflicting financial interest.

Author Contributions

NK, HY and HW conceived and designed the study. NK, BZ and JM performed the experiments. NK, BZ, QL, JM and HW performed data analysis. NK, BZ and HW wrote the manuscript. ZC, HW, HY and AY reviewed the manuscripts.

Supplementary Materials

Supplementary data including two tables can be found with this article online at http://pdf.medrang.co.kr/paper/pdf/IJSC/IJSC-12-s18102.pdf.

References

1. Ullah I, Subbarao RB, Rho GJ. Human mesenchymal stem cells - current trends and future prospective. Biosci Rep. 2015; 35. pii: e00191. DOI: 10.1042/BSR20150025. PMID: 25797907. PMCID: 4413017.
crossref
2. Song L, Tuan RS. Transdifferentiation potential of human mesenchymal stem cells derived from bone marrow. FASEB J. 2004; 18:980–982. DOI: 10.1096/fj.03-1100fje. PMID: 15084518.
crossref
3. Gao F, Chiu SM, Motan DA, Zhang Z, Chen L, Ji HL, Tse HF, Fu QL, Lian Q. Mesenchymal stem cells and immunomodulation: current status and future prospects. Cell Death Dis. 2016; 7:e2062. DOI: 10.1038/cddis.2015.327. PMID: 26794657. PMCID: 4816164.
crossref
4. Dominici M, Le Blanc K, Mueller I, Slaper-Cortenbach I, Marini F, Krause D, Deans R, Keating A, Prockop Dj, Horwitz E. Minimal criteria for defining multipotent mesenchymal stromal cells. The International Society for Cellular Therapy position statement. Cytotherapy. 2006; 8:315–317. DOI: 10.1080/14653240600855905. PMID: 16923606.
crossref
5. Suila H, Pitkänen V, Hirvonen T, Heiskanen A, Anderson H, Laitinen A, Natunen S, Miller-Podraza H, Satomaa T, Natunen J, Laitinen S, Valmu L. Are globoseries glycosphingolipids SSEA-3 and -4 markers for stem cells derived from human umbilical cord blood? J Mol Cell Biol. 2011; 3:99–107. DOI: 10.1093/jmcb/mjq041. PMID: 21149348.
crossref
6. Lee RH, Seo MJ, Pulin AA, Gregory CA, Ylostalo J, Prockop DJ. The CD34-like protein PODXL and alpha6-integrin (CD49f) identify early progenitor MSCs with increased clonogenicity and migration to infarcted heart in mice. Blood. 2009; 113:816–826. DOI: 10.1182/blood-2007-12-128702. PMID: 18818395. PMCID: 2630267.
crossref
7. Pham H, Tonai R, Wu M, Birtolo C, Chen M. CD73, CD90, CD105 and Cadherin-11 RT-PCR screening for mesenchymal stem cells from cryopreserved human cord tissue. Int J Stem Cells. 2018; 11:26–38. DOI: 10.15283/ijsc17015. PMID: 29843192. PMCID: 5984056.
crossref
8. Lv FJ, Tuan RS, Cheung KM, Leung VY. Concise review: the surface markers and identity of human mesenchymal stem cells. Stem Cells. 2014; 32:1408–1419. DOI: 10.1002/stem.1681. PMID: 24578244.
crossref
9. Zhang Z, Gupte MJ, Ma PX. Biomaterials and stem cells for tissue engineering. Expert Opin Biol Ther. 2013; 13:527–540. DOI: 10.1517/14712598.2013.756468. PMID: 23327471. PMCID: 3596493.
crossref
10. Mahara A, Yamaoka T. Continuous separation of cells of high osteoblastic differentiation potential from mesenchymal stem cells on an antibody-immobilized column. Biomaterials. 2010; 31:4231–4237. DOI: 10.1016/j.biomaterials.2010.01.126. PMID: 20185169.
crossref
11. Chen AK, Reuveny S, Oh SK. Application of human mesenchymal and pluripotent stem cell microcarrier cultures in cellular therapy: achievements and future direction. Biotechnol Adv. 2013; 31:1032–1046. DOI: 10.1016/j.biotechadv.2013.03.006. PMID: 23531528.
crossref
12. Sambu S, Xu X, Schiffer HA, Cui ZF, Ye H. RGDS-fuctionalized alginates improve the survival rate of encapsulated embryonic stem cells during cryopreservation. Cryo Letters. 2011; 32:389–401. PMID: 22020461.
13. Lee J, Abdeen AA, Kilian KA. Rewiring mesenchymal stem cell lineage specification by switching the biophysical microenvironment. Sci Rep. 2014; 4:5188. DOI: 10.1038/srep05188. PMID: 24898422. PMCID: 4046125.
crossref
14. Choi YS, Park SN, Suh H. Adipose tissue engineering using mesenchymal stem cells attached to injectable PLGA spheres. Biomaterials. 2005; 26:5855–5863. DOI: 10.1016/j.biomaterials.2005.02.022. PMID: 15949551.
crossref
15. Dalby MJ, Gadegaard N, Oreffo RO. Harnessing nano-topography and integrin-matrix interactions to influence stem cell fate. Nat Mater. 2014; 13:558–569. DOI: 10.1038/nmat3980. PMID: 24845995.
crossref
16. Walters NJ, Gentleman E. Evolving insights in cell-matrix interactions: elucidating how non-soluble properties of the extracellular niche direct stem cell fate. Acta Biomater. 2015; 11:3–16. DOI: 10.1016/j.actbio.2014.09.038. PMID: 25266503. PMCID: 5833939.
crossref
17. Jang HK, Kim BS. Modulation of stem cell differentiation with biomaterials. Int J Stem Cells. 2010; 3:80–84. DOI: 10.15283/ijsc.2010.3.2.80. PMID: 24855545. PMCID: 4021801.
crossref
18. McMurray RJ, Gadegaard N, Tsimbouri PM, Burgess KV, McNamara LE, Tare R, Murawski K, Kingham E, Oreffo RO, Dalby MJ. Nanoscale surfaces for the long-term maintenance of mesenchymal stem cell phenotype and multipotency. Nat Mater. 2011; 10:637–644. DOI: 10.1038/nmat3058. PMID: 21765399.
crossref
19. Dalby MJ, Gadegaard N, Tare R, Andar A, Riehle MO, Herzyk P, Wilkinson CD, Oreffo RO. The control of human mesenchymal cell differentiation using nanoscale symmetry and disorder. Nat Mater. 2007; 6:997–1003. DOI: 10.1038/nmat2013. PMID: 17891143.
crossref
20. Benoit DS, Schwartz MP, Durney AR, Anseth KS. Small functional groups for controlled differentiation of hydrogel-encapsulated human mesenchymal stem cells. Nat Mater. 2008; 7:816–823. DOI: 10.1038/nmat2269. PMID: 18724374. PMCID: 2929915.
crossref
21. Phillips JE, Petrie TA, Creighton FP, García AJ. Human mesenchymal stem cell differentiation on self-assembled monolayers presenting different surface chemistries. Acta Biomater. 2010; 6:12–20. DOI: 10.1016/j.actbio.2009.07.023. PMID: 19632360. PMCID: 2787851.
crossref
22. Zamparelli A, Zini N, Cattini L, Spaletta G, Dallatana D, Bassi E, Barbaro F, Iafisco M, Mosca S, Parrilli A, Fini M, Giardino R, Sandri M, Sprio S, Tampieri A, Maraldi NM, Toni R. Growth on poly(L-lactic acid) porous scaffold preserves CD73 and CD90 immunophenotype markers of rat bone marrow mesenchymal stromal cells. J Mater Sci Mater Med. 2014; 25:2421–2436. DOI: 10.1007/s10856-014-5259-4. PMID: 24997163.
crossref
23. Duffy CR, Zhang R, How SE, Lilienkampf A, De Sousa PA, Bradley M. Long term mesenchymal stem cell culture on a defined synthetic substrate with enzyme free passaging. Biomaterials. 2014; 35:5998–6005. DOI: 10.1016/j.biomaterials.2014.04.013. PMID: 24780167.
crossref
24. Kasoju N, Wang H, Zhang B, George J, Gao S, Triffitt JT, Cui Z, Ye H. Transcriptomics of human multipotent mesenchymal stromal cells: retrospective analysis and future prospects. Biotechnol Adv. 2017; 35:407–418. DOI: 10.1016/j.biotechadv.2017.04.005. PMID: 28450077.
crossref
25. Sargent A, Shano G, Karl M, Garrison E, Miller C, Miller RH. Transcriptional profiling of mesenchymal stem cells identifies distinct neuroimmune pathways altered by CNS disease. Int J Stem Cells. 2018; 11:48–60. DOI: 10.15283/ijsc17062. PMID: 29699382. PMCID: 5984058.
crossref
26. Li Q, Zhang B, Kasoju N, Ma J, Yang A, Cui Z, Wang H, Ye H. Differential and interactive effects of substrate topography and chemistry on human mesenchymal stem cell gene expression. Int J Mol Sci. 2018; 19. pii: E2344. DOI: 10.3390/ijms19082344. PMID: 30096912. PMCID: 6121573.
crossref
27. Niehage C, Steenblock C, Pursche T, Bornhäuser M, Corbeil D, Hoflack B. The cell surface proteome of human mesenchymal stromal cells. PLoS One. 2011; 6:e20399. DOI: 10.1371/journal.pone.0020399. PMID: 21637820. PMCID: 3102717.
crossref
28. Cho KA, Park M, Kim YH, Woo SY, Ryu KH. RNA sequencing reveals a transcriptomic portrait of human mesenchymal stem cells from bone marrow, adipose tissue, and palatine tonsils. Sci Rep. 2017; 7:17114. DOI: 10.1038/s41598-017-16788-2. PMID: 29214990. PMCID: 5719355.
crossref
29. Shannon P, Markiel A, Ozier O, Baliga NS, Wang JT, Ramage D, Amin N, Schwikowski B, Ideker T. Cytoscape: a software environment for integrated models of bio-molecular interaction networks. Genome Res. 2003; 13:2498–2504. DOI: 10.1101/gr.1239303. PMID: 14597658. PMCID: 403769.
crossref
30. Girvan M, Newman ME. Community structure in social and biological networks. Proc Natl Acad Sci U S A. 2002; 99:7821–7826. DOI: 10.1073/pnas.122653799. PMID: 12060727. PMCID: 122977.
crossref
31. Bounova G. Octave networks toolbox. Zendo. 2015; DOI: 10.5281/zendo.22398.
32. Mendicino M, Bailey AM, Wonnacott K, Puri RK, Bauer SR. MSC-based product characterization for clinical trials: an FDA perspective. Cell Stem Cell. 2014; 14:141–145. DOI: 10.1016/j.stem.2014.01.013. PMID: 24506881.
crossref
33. Skardal A, Mack D, Atala A, Soker S. Substrate elasticity controls cell proliferation, surface marker expression and motile phenotype in amniotic fluid-derived stem cells. J Mech Behav Biomed Mater. 2013; 17:307–316. DOI: 10.1016/j.jmbbm.2012.10.001. PMID: 23122714. PMCID: 3665276.
crossref
34. Colgan SP, Eltzschig HK, Eckle T, Thompson LF. Physiological roles for ecto-5′-nucleotidase (CD73). Purinergic Signal. 2006; 2:351–360. DOI: 10.1007/s11302-005-5302-5. PMID: 18404475. PMCID: 2254482.
crossref

Fig. 1
Expression levels of ISCT recommended hMSCs surface markers: (a) CD90 and CD105 showed substrate-sensitive response whereas CD73 showed substrate-stable response. CD90 and CD105 showed variations on expression levels that were higher than that of CD73. (b) The FPKM values for CD90 were plotted against the FPKM values of CD73 and CD105, line of best fit and R-square is shown in the figure.
ijsc-12-084f1.gif
Fig. 2
Genes correlated with the three positive ISCT recommended hMSCs markers: The total number of correlated genes with CD73 (334) was less than that with CD90 (464) and CD105 (467). CD90 and CD105 share over 84% of their individually correlated genes, whereas, CD7 3has no common genes with the other two markers.
ijsc-12-084f2.gif
Fig. 3
Substrate induced changes in expression of 177 hMSCs biomarkers compiled from the literature: Dendrogram shows that the expression levels of the biomarkers were significantly altered with respect to changes in topography in comparison with chemistry induced changes.
ijsc-12-084f3.gif
Fig. 4
Correlation analysis of gene expression levels of 177 hMSCs biomarkers compiled from the literature: (a) overall observation with reference to three ISCT markers highlighted and (b) first-degree-connections of ISCT markers suggested correlation between CD90 and CD105 including its neighbors but no correlation with that of CD73 and its neighbors. A negative correlation between two genes is shown by a red line and a positive correlation is shown by a green line. The size of the node represents the mean FPKM percentile for that particular gene.
ijsc-12-084f4.gif
Fig. 5
Cluster analysis of the 177 compiled hMSCs markers: (a) network modularity determination figure showing the configuration of 48 communities resulted in the highest modularity. (b) Gene frequency graph, the frequency (number) of genes that was allocated into the different size of communities, as a result of the optimal cluster configuration. (c) The clustered network consists of the circular subplots; each of the parameter circles represents a community/cluster. Each green line represents the positive correlation of the gene expressions. The interactions within each community are noticeably more than the interactions with other communities. The size of the node represents the average expression level of that gene. The three positive ISCT markers are highlighted in grey. The top three stable or variably expressed genes in each community are highlighted in (c) and the gene names in panel (d), in blue and red, respectively.
ijsc-12-084f5.gif
Fig. 6
Identification of hMSCs biomarkers that respond to changes in substrate topography: The number of differentially regulated genes (>for up-regulation and <for down-regulation) are shown in each block, along with the gene names listed. The two chemistry substrates are represented by Pr and Am. The underlined genes were also differentially expressed compared to those from TCP.
ijsc-12-084f6.gif
Table 1
List of biomaterials-stable hMSCs markers identified from the 177 biomarkers reported in the literature
Gene ID Gene Name D0 Fl-Pr Fl-Am Fs-Pr Fs-Am TCP CoV
1495 CTNNA1 117.4 120.1 124.3 117.8 127.6 119.3 0.03
10085 EDIL3 176.2 160.4 159.7 173.2 166.4 172.0 0.04
3916 LAMP1 195.8 187.7 193.8 203.4 194.5 177.4 0.05
6717 SRI 26.0 28.9 25.2 25.8 28.0 26.8 0.05
3490 IGFBP7 1375.9 1304.5 1208.1 1211.9 1166.4 1273.2 0.06
781 CACNA2D1 13.1 12.3 11.8 13.2 11.6 13.6 0.06
6443 SGCB 30.1 31.0 32.3 28.1 27.6 27.8 0.06
8910 SGCE 10.9 10.9 10.9 9.3 11.2 10.5 0.07
3688 ITGB1 810.3 787.9 801.8 942.6 834.5 819.7 0.07
9217 VAPB 8.9 9.0 9.8 7.9 8.7 9.0 0.07
Table 2
List of biomaterials-sensitive hMSCs markers identified from the 177 biomarkers reported in the literature
Gene ID Gene Name D0 Fl-Pr Fl-Am Fs-Pr Fs-Am TCP CoV
4162 MCAM 6.5 34.3 36.1 9.8 9.4 26.9 0.66
3690 ITGB3 10.7 5.6 5.4 17.8 13.9 3.3 0.60
1969 EPHA2 6.2 8.9 6.5 1.8 1.9 6.3 0.53
928 CD9 61.6 26.7 29.9 59.7 83.1 25.3 0.50
3672 ITGA1 4.6 2.6 3.2 1.2 1.7 4.3 0.48
3673 ITGA2 5.8 2.9 3.3 6.9 4.0 1.7 0.46
4059 BCAM 2.2 4.5 4.2 1.8 2.5 5.5 0.43
2239 GPC4 8.0 13.1 13.1 5.3 5.7 13.5 0.40
2335 FN1 7292.7 7148.9 7036.7 15578.7 14296.8 8124.2 0.40
84168 ANTXR1 73.6 121.5 135.6 54.5 60.2 129.1 0.39
4883 NPR3 42.6 51.5 54.2 25.5 24.3 67.7 0.38
1295 COL8A1 113.8 205.7 196.0 85.1 89.0 171.8 0.38
4008 LMO7 92.4 114.1 129.1 54.0 71.3 160.7 0.38
23670 TMEM2 5.5 9.1 8.8 3.3 4.1 7.5 0.38
7070 THY1 156.2 184.9 175.1 73.2 77.0 150.3 0.36
5819 PVRL2 17.7 22.6 17.7 9.4 9.1 16.9 0.34
57153 SLC44A2 29.9 39.2 35.2 19.3 20.4 36.5 0.28
TOOLS
Similar articles