Journal List > Cancer Res Treat > v.53(2) > 1154702

Boonsri, Yacqub-Usman, Thintharua, Myint, Sae-Lao, Collier, Suriyonplengsaeng, Larbcharoensub, Balasubramanian, Venkatraman, Egbuniwe, Gomez, Mukherjee, Kumkate, Janvilisri, Zaitoun, Kuakpaetoon, Tohtong, Grabowska, Bates, and Wongprasert: Effect of Combining EGFR Tyrosine Kinase Inhibitors and Cytotoxic Agents on Cholangiocarcinoma Cells

Abstract

Purpose

The potential of members of the epidermal growth factor receptor (ErbB) family as drug targets in cholangiocarcinoma (CCA) has not been extensively addressed. Although phase III clinical trials showed no survival benefits of erlotinib in patients with advanced CCA, the outcome of the standard-of-care chemotherapy treatment for CCA, gemcitabine/cisplatin, is discouraging so we determined the effect of other ErbB receptor inhibitors alone or in conjunction with chemotherapy in CCA cells.

Materials and Methods

ErbB receptor expression was determined in CCA patient tissues by immunohistochemistry and digital-droplet polymerase chain reaction, and in primary cells and cell lines by immunoblot. Effects on cell viability and cell cycle distribution of combination therapy using ErbB inhibitors with chemotherapeutic drugs was carried out in CCA cell lines. 3D culture of primary CCA cells was then adopted to evaluate the drug effect in a setting that more closely resembles in vivo cell environments.

Results

CCA tumors showed higher expression of all ErbB receptors compared with resection margins. Primary and CCA cell lines had variable expression of erbB receptors. CCA cell lines showed decreased cell viability when treated with chemotherapeutic drugs (gemcitabine and 5-fluorouracil) but also with ErbB inhibitors, particularly afatinib, and with a combination. Sequential treatment of gemcitabine with afatinib was particularly effective. Co-culture of CCA primary cells with cancer-associated fibroblasts decreased sensitivity to chemotherapies, but sensitized to afatinib.

Conclusion

Afatinib is a potential epidermal growth factor receptor targeted drug for CCA treatment and sequential treatment schedule of gemcitabine and afatinib could be explored in CCA patients.

Introduction

Cholangiocarcinoma (CCA) or bile duct cancer is a malignant transformation of the epithelial cells lining the biliary tract. While in North America and Europe, it is relatively rare (2–4/100,000 deaths), but rapidly increasing in incidence [1], in Asia, it is a very significant problem. In Isan province in Thailand, a region of 26M people, it is one of the most common cancers (up to 112/100,000 people) where the primary risk factor for development of CCA is infection with the parasitic flatworm (Opisthorchis viverrini [OV]). CCA has a very poor prognosis worldwide, with a high mortality rate as a consequence of a lack of tools for early diagnosis, a poor understanding of the molecular biology of the cholangiocyte transformation, and a consequent lack of effective drug therapies [2]. Tumor resection or, rarely, liver transplantation, are currently the only potentially curative treatment for CCA.
Gemcitabine and cisplatin combination have widely been used in advanced CCA and the combination is currently accepted as the standard treatment of care for first-line therapy in the United States and Europe. However, the outcome of using these drugs is still discouraging [3]. Recently, Hyung et al. [4] showed maintenance of gemcitabine and cisplatin combination is not associated with an improved survival outcome in advanced biliary tract cancer patients after progression.
Epidermal growth factor receptor (EGFR) or ErbB are effective therapeutic targets in many cancer types [5]. ErbB receptors and their downstream signaling pathways have been reported as key regulators of cancer cell proliferation, migration, metastasis, and angiogenesis and their high expression correlates with a poor prognosis [6]. ErbB receptors belong to the membrane-anchored receptor tyrosine kinase ErbB/human epidermal growth factor receptor (HER) family consisting of EGFR (HER1/ErbB1), HER2 (ErbB2), HER3 (ErbB3), and HER4 (ErbB4) [7]. Ligand activation of EGFR results in homo- and hetero-dimerization with other family members. This dimerization enables EGFR auto-phosphorylation, which results in the recruitment of signaling proteins to the receptor culminating in cell proliferation and survival. ErbB activates the RAS/RAF/mitogen-activated protein kinase/extracellular signal-regulated kinase (ERK) and AKT downstream effector pathways, culminating in cell proliferation and survival. Inhibitors of the ErbB receptors are currently being explored in clinical trials for CCA, including afatinib (NCT01679405) [8], lapatinib (NCT00107536) [9], gefitinib (NCT02836847), and erlotinib (NCT00033462) [8,9].
However, there is still a poor current understanding of the differential expression of ErbB receptor family either in tissues from CCA patients or in CCA cell lines [10]. The optimal response of chemotherapeutic drugs and specific target ErbB inhibitors is also not known, and particularly, the optimal combinations of chemotherapeutics and specific target ErbB inhibitors, or their synergistic effects and potential use in CCA cells. Here we aimed to identify the differential expression of the ErbB receptor family, and determine the efficacy of combining chemotherapeutic drugs with drugs targeting ErbB receptors family in CCA tissues and primary CCA cells, and CCA cells lines derived from patients who had OV infection.

Materials and Methods

1. Droplet digital polymerase chain reaction

RNA was extracted and purified from surgically resected tumor, four primary CCA cell lines (CCA-UK5, CCA-UK6, CCA-UK7, and CCA-UK9) and patient-matched, histologically tumor-free resected margin as a control. One microgram of total RNA was reverse transcribed using 500 ng Oligo-d(T) and 250 ng random primers and M-MLV reverse transcriptase (Takara Shuzo Co., Tokyo, Japan). One microliter of the total 20 μL cDNA was added to 1 μL Taqman Probe (EGFR, Hs01076092; HER2, Hs01001580; HER3, Hs00176538; and HER4, Hs00955522), and 8 μL ddH2O with 10 μL droplet digital polymerase chain reaction (ddPCR) super mix for probes (Bio-Rad, Hemel Hempstead, UK). Droplets were generated by adding 20 to 70 μL Droplet generation oil (Bio-Rad, Hemel Hempstead, UK) using a QX100 droplet generator (Bio-Rad, Hemel Hempstead, UK). Amplification was carried out using standard Taqman protocols (10-minute activation step, 95°C, 40 cycles of 30 seconds denaturation at 95°C, 1 minute annealing and elongation 60°C and final extension 98°C 10 minutes using a PCR thermal cycler (Bio-Rad, Hemel Hempstead, UK). Samples were analyzed using QX100 droplet reader (Bio-Rad, Hemel Hempstead, UK).

2. Immunohistochemistry

Immunohistochemistry was used to examine expression of EGFR family receptors in CCA patient tissues from tumours with different etiologies (OV related in the Thai group and nonOV in the UK group). Formalin-fixed-paraffin-embedded (FFPE) tumor samples from thirty patients were retrieved from the Department of Pathology, Ramathibodi Hospital, Mahidol University and Department of Pathology, Rajavithi Hospital, Bangkok, Thailand, and thirty patients from the Department of Pathology, Nottingham Universities Hospital Trust, for immunohistochemistry assessment. The tissues were histologically confirmed as mass forming CCA by the two pathologists of each institute (NL, CS and AZ, AM). OV-related CCA in Thai patients was diagnosed by the patient fulfilling one of these five criteria: (1) a history of previous positive stool examination for OV or its eggs; (2) identification of OV or its eggs in stool or bile; (3) demonstration of a typical bead-like cholangiogram; (4) demonstration of dilated peripheral small intrahepatic bile ducts, compatible with biliary parasitic disease on sonography, computed tomography or magnetic resonance image; and (5) histopathological evidence of OV in the hepatic resected specimen. Each case was tested using the following primary antibodies: anti-EGFR, anti-HER2, anti-HER3, and anti-HER4 antibodies. Serial 5-μm-thick sections of FFPE tissue were cut for a standard method for immunohistochemical analysis. The immunoreactivity was scored based on membranous and/or cytoplasmic staining [11] compared to positive control, as follows: no staining or faint staining in < 10% of tumor cells; 1+, weak perceptible membranous staining in ≥ 10% of tumor cells; 2+, moderate complete membranous staining in ≥ 10% of tumor cells; 3+, strong complete membranous staining in ≥ 10% of tumor cells [12,13]. Reference positive control tissue was normal placenta (for EGFR), receptor positive breast cancer for HER2 and HER3 and normal liver for HER4.

3. CCA cell lines and cultures

Cell lines used in this study included human CCA cell lines established from CCA tissue of Thai patients, HuCCA-1, KKU-M213, KKU-100, and KKU-M055 (obtained from the Japanese Cell Research Bank (HuCCA-1 [JCRB1657], KKU-M213 [JCRB1557], KKU-100 [JCRB1568], and KKU-M055 [JCRB1551]), and a normal cholangiocyte cell line, MMNK-1 [14,15]. All cell lines were cultured in RPMI supplemented with 10% fetal bovine serum and 2 mM L-glutamine (Sigma-Aldrich, Dorset, UK) in 5% CO2 atmosphere at 37°C. KKU-M213 cells harbor mutations of KRAS (p.G13C), TP53 (p.V31I), ERBB2 (p.N125D), and KKU-100 cells harbor mutations of KRAS (p.G12D) and TP53 (p.P72R). There is no mutation data for HuCCA-1 and KKU-M055. Mutation profile of CCA cell lines (the DepMap portal website; https://depmap.org/portal/cell_line/ACH-001538?tab=mutation; DepMap ID no. ACH-001538).

4. Western blot analysis

ErbB protein expression was examined in CCA cell lines. Protein extracted using NP-40 lysis buffer containing 1% (vol/vol) Triton X (Calbiochem, Darmstadt, Germany), 1× protease inhibitor (Roche, Mannheim, Germany), 50 mM NaF (Sigma-Aldrich, St. Louis, MO), 2 mM sodium orthovanadate (Sigma-Aldrich, Dorset, UK) and phenylmethylsulphonyl fluoride (Sigma-Aldrich) and quantified using Pierce BCA Assay Kit (Thermo Scientific, Basingstoke, UK). Twenty-five micrograms of protein was separated via sodium dodecyl sulfate polyacrylamide gel electrophoresis on 10% gels followed by wet transfer of the proteins to a nitrocellulose membrane using Bio-Rad transfer equipment (Bio-Rad, Hercules, CA), and transfer efficiency was confirmed by Ponceau S staining. The membranes were blocked in 5% BSA for 1.5 hours. Blots were then incubated with primary antibodies: anti-EGFR (Abcam, Cambridge, UK), anti-HER2, anti-HER3 (Cell Signaling Technology Inc., Beverly, MA), anti-HER4 (Abcam), and anti–α-tubulin antibodies (Cell Signaling Technology Inc.) at 4°C, overnight. The blots were then incubated with horseradish peroxidase–conjugated anti-rabbit or anti-mouse IgG secondary antibodies (Cell Signaling Technology Inc.) for 2 hours at room temperature and imaged using an Alliance Q9 mini Chemiluminescent gel imager (UVITEC, Cambridge, UK). The relative intensity of the protein band was quantified by ImageJ (from NIH website by Scion Corporation, Frederick, MD) and Image Studio (LI-COR).

5. Chemotherapeutic drugs and ErbB inhibitors

Chemotherapeutic drugs used in this study included gemcitabine, cisplatin, and 5-fluorouracil (5-FU). The specific ErbB inhibitors included afatinib, lapatinib, and erlotinib, all were purchased from Selleckchem (Houston, TX). The drugs were dissolved in cell culture grade dimethyl sulfoxide (DMSO) (AppliChem, Barcelona, Spain). Frozen DMSO stocks were prepared together with the drug to be used as vehicle. For cell lines, all drug treatments were performed at 60%–80% cell confluence.

6. Patient specimens and establishing close-to-patient 3D-tumor growth assay

Fresh surgical material from tumor resections at Nottingham University NHS Trust, was immediately placed into tissue transfer media (Dulbecco’s modified Eagle’s medium with 10% fetal bovine serum, 1% 0.2 M L-glutamate, 1% penicillin/streptomycin/amphotericin B, 0.1% 1 mg/mL hydrocortisone, 0.75% 1 mg/mL insulin) at 4°C, and processed within 4–6 hours. The majority of tissue was finely minced for immediate use and further portions were FFPE for immunohistochemistry, or stored in RNAlater (Ambion, Austin, TX) for subsequent analysis.
In vitro tumor cell growth was established from five patients, four of which we went on to investigate drug sensitivities (CCA-UK5, CCA-UK6, CCA-UK7, and CCA-UK9), and expanded with a layer of supporting feeder layer cells according to the method of Liu et al. [16] and as previously described by Saunders et al. [17]. A small amount of finely minced tumor tissue was enzymatically disaggregated by type II collagenase (100 U/mL, Invitrogen, Burlington, Canada) and dispase (2.4 U/mL, Invitrogen) in Hank’s balanced salt solution without calcium or magnesium (Sigma-Aldrich, Dorset, UK) at 37°C under constant rotation. Cells were removed at hourly intervals until the tumor was completely disaggregated. Cells were allowed to settle on the feeder layer, and expanded. If fibroblasts (assumed cancer associated fibroblasts [CAFs]) were seen amongst the epithelial population, they were harvested using differential trypsinisation, and subsequently grown separately. Cell number and viability were determined using trypan blue exclusion.
The CCA cells were harvested and employed for close-to-patient three-dimensional tumor growth assays. Briefly, cells were resuspended in 9 mg/mL ice-cold Cultrex basement membrane extract (Trevigen, Gaithersburg, MD), diluted in modified RPMI-1640 containing phenol red-free and 6 mmol/L D-Glucose at pH 6.8) (Life Technologies, Inc., Rockville, MD). CCA cells (confirmed by human-specific antibodies) were suspended in basal membrane extract in the presence or absence of the CAFs or human bone-marrow-derived mesenchymal stem cells (MSCs, Sciencell, UK). Cells were then plated into low adherent, black-walled, clear bottom 384-well plates at 6,250 tumor cells±CAFs/MSCs. Drugs at 0.1, 1, 10, and 100 μM were added in six replicates on day 3. Drugs used in combination were premixed and serially diluted together before adding to the assay. Drug exposure was for 96 hours before final endpoint readings. An AlamarBlue assay (Invitrogen); 10% (v/v) was added for 1 hour at 37°C to monitor cell growth daily using fluorescent plate reader (FLUOstar Omega, BMG Labtech). Drug sensitivity was calculated as a percentage of a matched untreated control and IC50 were determined using GraphPad Prism 8 (GraphPad Software, Inc., La Jolla, CA), nonlinear curve fit of y=100/(1+ 10(Log1C50-X)×HillSlope).

7. Cell growth inhibition assay

The proliferative effect of specific ErbB tyrosine kinase inhibitors (afatinib, lapatinib, and erlotinib) (Selleckchem) on human CCA cells was determined by MTT assay. In brief, CCA cells (HuCCA-1, KKU-M213, KKU-100, and KKU-M055) were grown overnight in 96-well plates at density of 5×10³ cells/well, then incubated with different concentrations of specific ErbB tyrosine kinase inhibitors (0.1, 1, and 10 μM) for 48 hours. Cells (HuCCA-1 and KKU-M213) were also incubated with the chemotherapeutic drugs: gemcitabine, cisplatin, 5-FU (Selleckchem) at 0.1, 1, and 10 μM for 48 hours. Cells without drug treatment were used as a control group and 0.1% DMSO treated cells were used as a vehicle control group. After incubation, 100 μL of MTT solution (0.5 mg/mL, Sigma-Aldrich, St. Louis, MO) was added to each well and incubated for a further 4 hours at 37°C in the dark. Subsequently, 100 μL of DMSO (Merck, Darmstadt, Germany) was added to each well and absorbance of the sample was measured at OD490 nm by a Versamax microplate reader using SoftMax Pro 4.8 analysis software (Molecular Devices, San Jose, CA). The IC50 value was calculated based on the nonlinear regression curve fit method by GraphPad Prism 6.0 software (GraphPad Software, Inc.). The greatest best-fit curve was used for calculation and R2 value was more than 0.8.

8. Drug combination treatment and combination index

The drug combination study was performed in HuCCA-1 and KKU-M213 cells by using a fixed concentration of gemcitabine (0.1 μM) combined with cisplatin, 5-FU, or with specific ErbB inhibitors (afatinib, lapatinib, and erlotinib) at 0.1, 1, and 10 μM. Interactions between the different drugs were evaluated using the combination index (CI) as described by Chou [18]. The CI for each fraction-affected value (Fa-CI) representing the percentage of proliferation inhibited by a drug. A plot of CI values and Fa-CI for each drug-pair was generated using the CompuSyn software (ComboSyn, Inc., Paramus, NJ; available for free download from http://www.combosyn.com. A CI interpreted as: CI value < 1.0, synergistic; 1.0, additive and > 1.0, antagonistic.

9. Cell cycle analysis

Cell cycle distribution was analyzed using flow cytometry. HuCCA-1 and KKU-M213 cells were cultured and starved with serum-free media overnight. Cells were treated with a single treatment of gemcitabine (0.1 μM) or afatinib (0.1 μM) for 24 hours. Concurrent treatment with gemcitabine and afatinib (G+A) and sequential treatments of gemcitabine (6 hours) followed with afatinib (18 hours) (G→A) and an inverted order with the same interval (A→G) were also performed. Cells were harvested and prepared for flow cytometry by incubated with propidium iodide (Sigma-Aldrich, St. Louis, MO). DNA content of cells was determined using a flow cytometer (BD FACSCanto model, BD Biosciences). The protein samples were applied to western blotting and incubated with the following primary antibodies: anti-cyclin D1, anti-cyclin E (Santa Cruz Biotechnology, Inc., Santa Cruz, CA), and anti α-tubulin antibodies (Cell Signaling Technology Inc.).

10. Statistical analysis

Experiments were performed in triplicate. Data are presented as means±standard error of mean and statistically analyzed using GraphPad Prism program ver. 6 (GraphPad Software, Inc.) by one-way ANOVA followed by Tukey’s multiple comparison tests and within-treatment group comparisons were performed using paired t test (2-tailed). Difference with p-values less than 0.05 were considered statistically significant.

Results

1. Expression of ErbB receptor family in CCA tissues

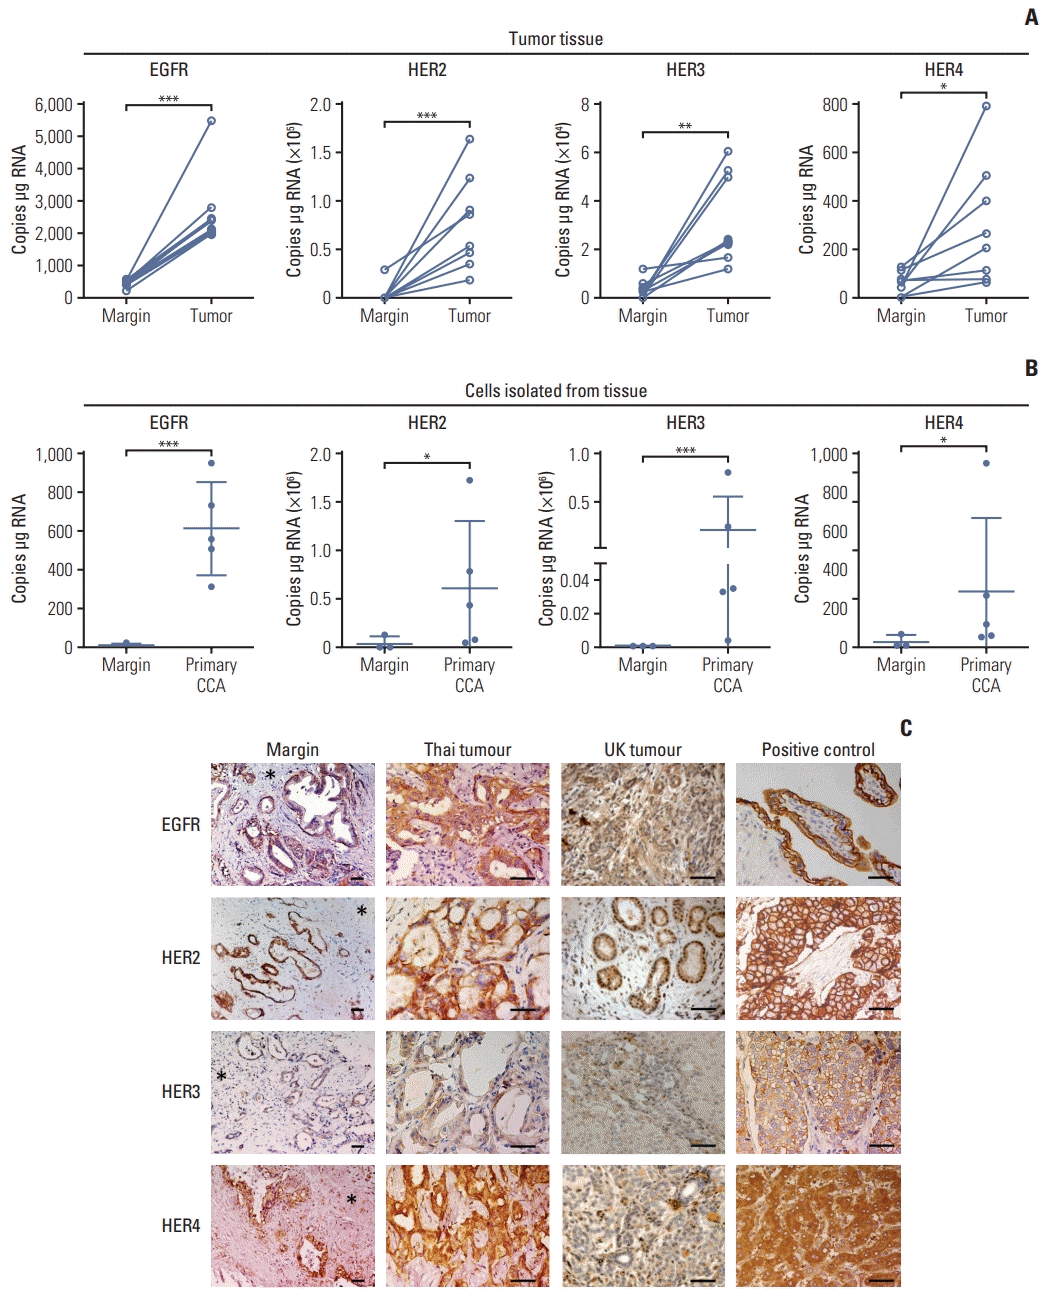
mRNA expression of ErbB receptors by ddPCR revealed high expression of EGFR, HER2 HER3, and HER4 (Fig. 1A) in tumor tissues compared with tissue resection margin, and in tumor cells isolated from primary tissues compared with normal cells isolated from the margin (Fig. 1B). Immunohistochemistry of all tissue sections from both OV positive patients from Thailand and presumed OV negative patients from the UK patients (compared due to different etiologies) were positive for all ErbB family receptors; however, they showed different intensities (Table 1, Fig. 1). Immunoreactive staining intensity was scored relative to that of a reference positive control. Compared with histologically normal tissues taken from the resection margin of the CCA all ErbB receptors had expression that was more intense in tumor cells from CCA patients from both Thailand and the UK (Fig. 1C). All CCA cases showed positive staining for EGFR with most showing moderate or strong staining (Table 1). CCA tissues from both Thailand and the UK were weakly to moderately stained for HER2 (Table 1). HER3 was weakly stained in both Thailand and the UK CCA tissues. HER4 was strongly stained in Thailand and the UK tumors. Notably, these findings highlighted that EGFR, HER2, and HER4 are highly expressed in CCA tumors irrespective of whether they come from - UK patients not exposed to OV, or from fluke-induced Thai cancers. We confirmed that the high expression of ErbB was preserved in immortalized CCA cell lines (S1A Fig.). ErbB expression was investigated in 4 CCA cell lines derived from patients with CCA associated with fluke infection including KKU-M213, HuCCA-1, KKU-100, and KKU-M05 and a cholangiocyte cell line, MMNK-1. Immunoblotting showed that KKU-M055 cells expressed low levels of all the ErbB receptors while KKU-M213, HuCCA-1, and KKU-100 cells highly expressed EGFR, HER2, and HER3 proteins (S1B Fig.). The relative expression levels of EGFR, HER2, and HER3 proteins were found to be HuCCA-1 > KKU-M213 > KKU-100 > KKU-M055 while for HER4 this was HuCCA-1 > KKU-M213 > KKU-M055 and KKU-M100. We also determined mRNA expression of ErbB at transcription level and found that the mRNA transcript of EGFR and its family members, HER2, HER3, and HER4 in these CCA cell lines were not consistent with the protein expression, while all ErbB receptors were equally expressed in MMNK-1 cells (S1D Fig.).

2. Sensitivity of CCA cells to treatment with specific ErbB tyrosine kinase inhibitors and chemotherapeutic drugs

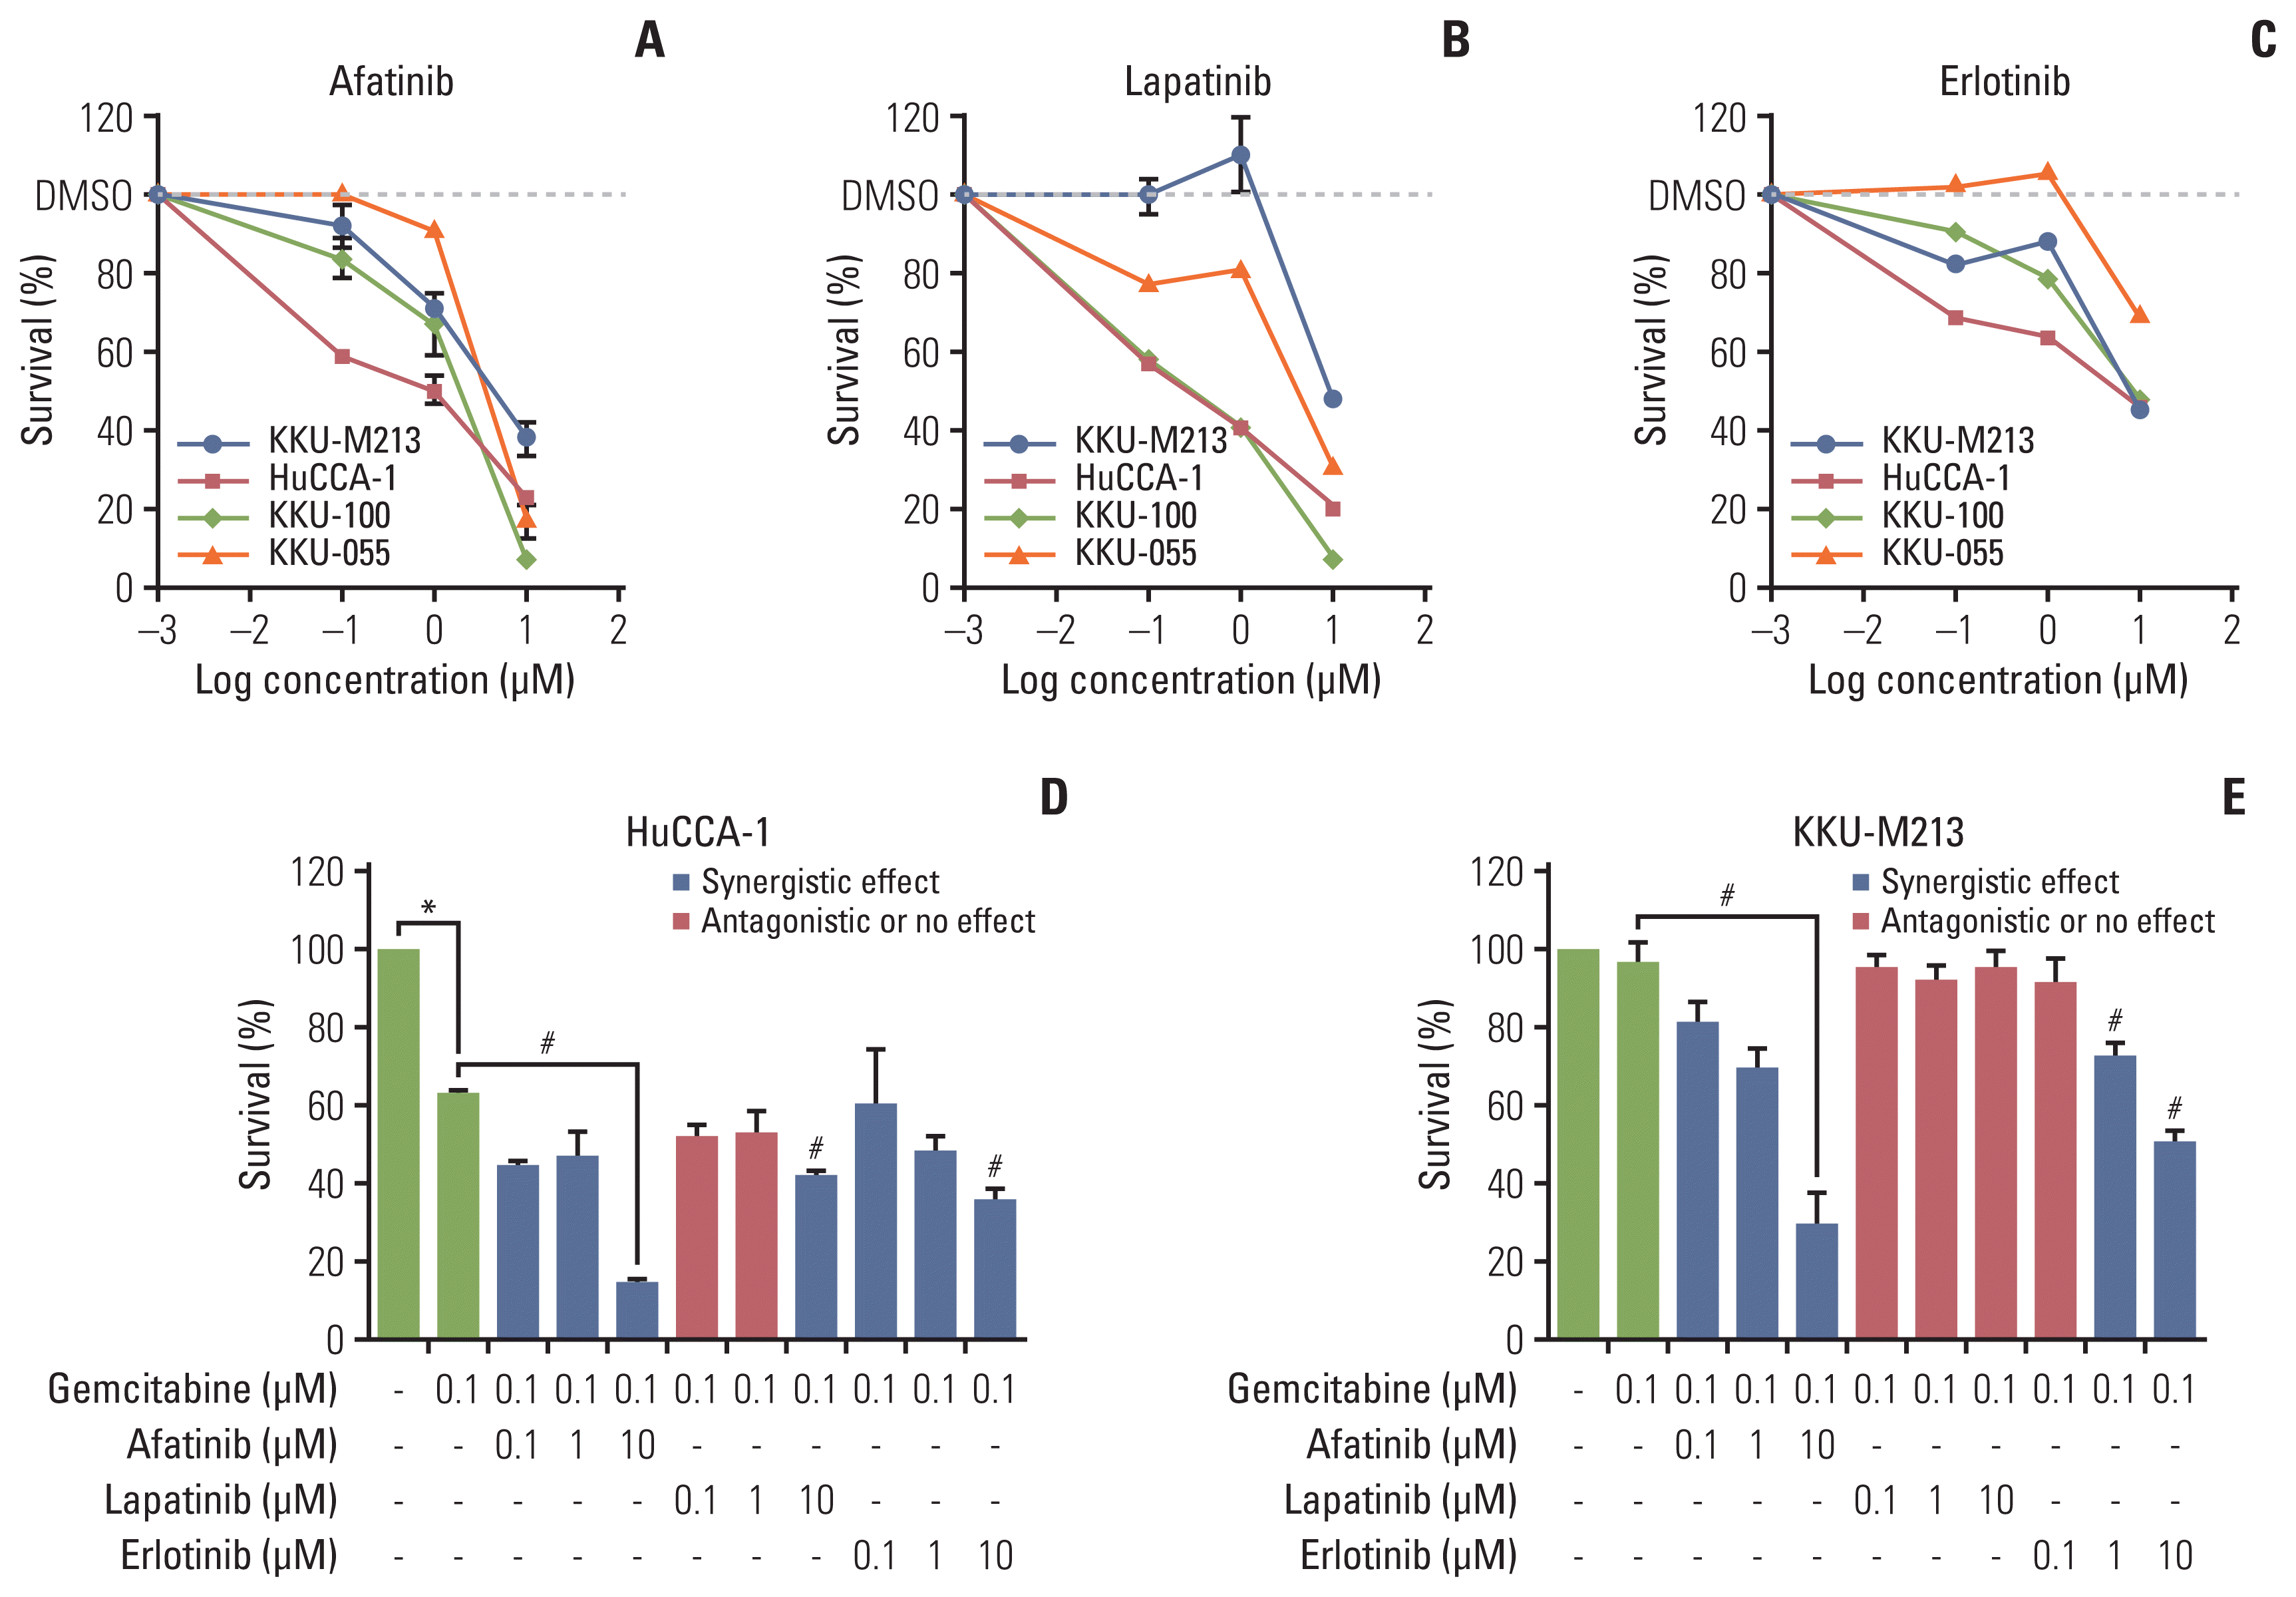
We then investigated the effects of ErbB inhibitors on the growth of CCA cell lines. All three inhibitors (afatinib, lapatinib, and erlotinib) were cytotoxic in a dose-dependent manner (Fig. 2A–C) with IC50 values ranging from 0.31–23.65 μM (Table 2). The HuCCA-1 cells were the most sensitive to all drug treatments: afatinib (IC50=0.73 μM), lapatinib (IC50=0.32 μM), and erlotinib (IC50=4.52 μM). KKU-M213 exhibited the least sensitivity to all drugs: afatinib (IC50=4.31 μM), erlotinib (IC50=8.06 μM), and lapatinib (IC50=11.14 μM). There was no apparent correlation between the response to the treatments of ErbB inhibitors (IC50 values) and the expression of ErbB proteins (S2 Fig.). The most sensitive HuCCA-1 cells and the least sensitive KKU-M213 cells were selected for further experiments.

3. Effect of combined treatment of ErbB inhibitors with gemcitabine in HuCCA-1 and KKU-M213 cells

To determine whether ErbB inhibitors could in addition to existing therapies we examined the effect of ErbB2 inhibitors in the presence of effective cytotoxic agents. We first confirmed the sensitivity of HuCCA-1 and KKU-M213 cells to chemotherapeutic drugs (gemcitabine, cisplatin, and 5-FU). This confirmed that HuCCA-1 cells were more sensitive to gemcitabine than (IC50=0.76 μM) 5-FU (IC50=4.64 μM), or cisplatin (18 μM) (S3A Fig.) while KKU-M213 showed less sensitivity to all three drugs: gemcitabine (IC50=14.73 μM), 5-FU (IC50=15.68 μM) and cisplatin (16 μM) (S3B Fig.). We further determined the interaction effect of combining gemcitabine with cisplatin or gemcitabine with 5-FU. There was an antagonistic effect of adding cisplatin to gemcitabine in HuCCA-1 (S3C Fig.), and KKU-M213 cells (S3D Fig.) with the computed CI values > 1 (S3E and S3F Fig.), whereas, gemcitabine (0.1 μM) combined with 5-FU (0.1, 1, and 10 μM) showed a significant additive effect on growth inhibition in both cell lines in a dose-dependent manner (S3C and S3D Fig.), with the computed CI values < 1 (S3E and S3F Fig.).
As gemcitabine seemed the most likely to provide additional benefit, we therefore determined the effect of gemcitabine combination with tyrosine kinase ErbB inhibitors (afatinib, lapatinib, and erlotinib) at a fixed ratio (0.1: 0.1, 1, 10 μM) and the efficacy of combination treatment was evaluated in the least and most sensitive cell lines (KKU-M213 and HuCCA-1). In HuCCA-1 cells, a synergistic effect was observed when afatinib (0.1, 1, and 10 μM), lapatinib (10 μM), or erlotinib (10 μM) were combined with 0.1 μM gemcitabine compared to gemcitabine alone (Fig. 2D). In KKU-M213, a synergistic effect was observed when afatinib (0.1, 1, and 10 μM) or erlotinib (1 and 10 μM) was combined with 0.1 μM gemcitabine while gemcitabine combined with lapatinib showed no beneficial effect (Fig. 2E). Combined treatment of gemcitabine with either afatinib or erlotinib showed a CI value toward synergism in both HuCCA-1 (S4A Fig.) and KKU-M213 cells (S4B Fig.). In contrast, the combined treatment of gemcitabine and lapatinib mostly produced antagonistic effect (very high CI values) (S4A and S4B Fig.). These results indicated that the growth inhibitory effect of gemcitabine was enhanced by the addition of afatinib and erlotinib but not lapatinib.
We chose afatinib to further investigate a synergistic effect of the combined treatments using three different approaches: (1) concurrent treatment of gemcitabine (0.1 μM) with afatinib for 24 hours (G+A), (2) sequential treatment of gemcitabine (6 hours) followed with afatinib for 18 hours (G→A) and (3) inverted treatment with afatinib then gemcitabine (A→G) with the same interval (Fig. 3). Cells were also treated with gemcitabine alone (0.1 μM) or afatinib alone (0.1, 1, or 10 μM) for comparison. The results demonstrated that a single treatment of gemcitabine for 24 hours at 0.1 μM slightly decreased cells viability while afatinib at 1 and 10 μM significantly decreased viability of both HuCCA1 (Fig. 3A) and KKU-M213 cells (Fig. 3B). For HuCCA1 cells, only a concurrent treatment of 0.1 μM gemcitabine and 0.1 μM afatinib showed a beneficial additive effect compared to their respective dose of afatinib; however, growth inhibition was small. Increasing the concentration of afatinib did not enhance the additive effect. Sequential treatment (G→A) showed an additive effect to 0.1 μM afatinib alone. While an additive effect for inverted treatment (A→G) was observed using afatinib at 0.1 and 1 μM. Moreover, the sequential treatment using 0.1 μM afatinib with gemcitabine in both G→A and A→G showed similar levels of growth inhibition (Fig. 3A). For KKU-M213 cells, all concurrent treatments of gemcitabine and afatinib showed no additive effect to afatinib. Additive effect was followed with 0.1 μM afatinib (G→A) and the reverted order (A→G) at afatinib 0.1 and 1 μM (Fig. 3B).

4. Effect of gemcitabine and afatinib combination treatment on cell cycle

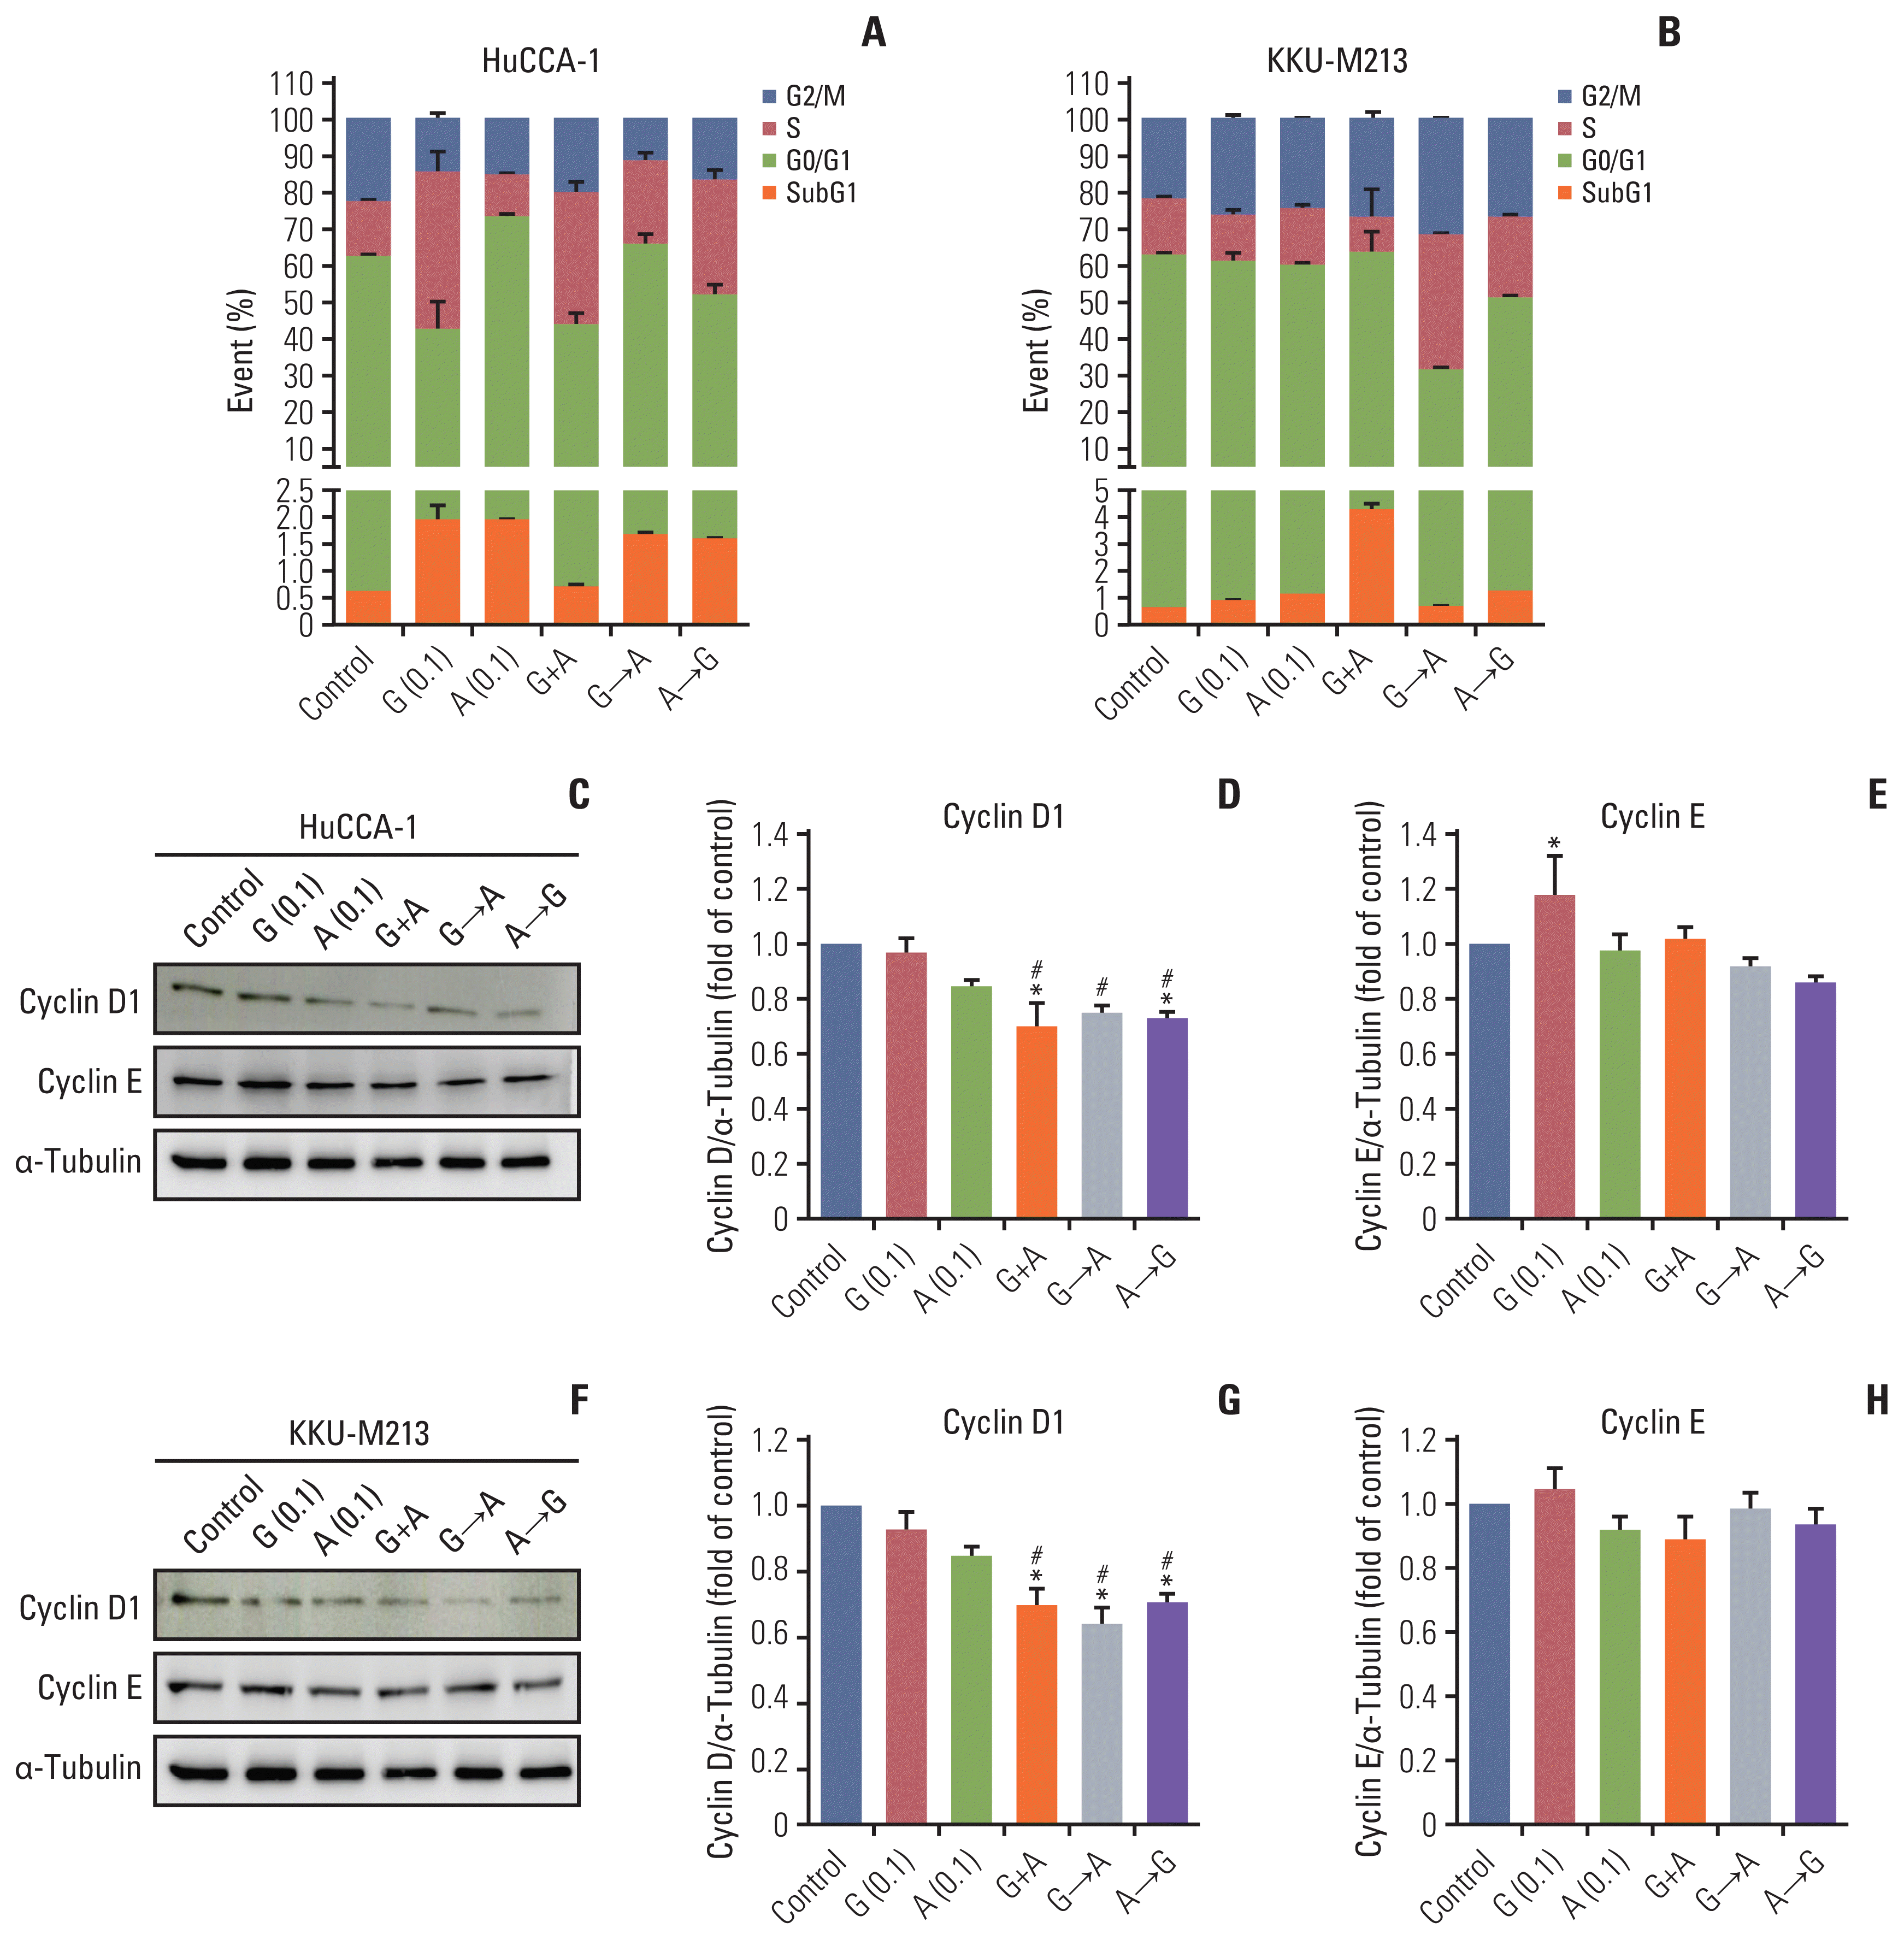
We performed cell cycle analysis to determine whether the result of the synergistic effect of gemcitabine combined with afatinib resulted from cell cycle arrest or apoptosis. The cell cycle distribution of HuCCA-1 and KKU-M213 cells after single drug treatment, concurrent or sequential treatments of gemcitabine (0.1 μM) and afatinib (0.1 μM) for 24 hours are shown in Fig. 4. Treatment of HuCCA-1 cells with gemcitabine alone increased cells accumulated in the subG1 (apoptotic/dead cells) and S phases consistent with inhibition of DNA synthesis, and this was associated with decreased cell viability (Fig. 4A) while with afatinib treatment alone, cells accumulated in subG1 phase. Concurrent treatment of gemcitabine and afatinib (G+A) increased cell accumulation in S phase. Both sequential treatments of G→A and A→G induced accumulation in the subG1 and S phases, accompanied by decreased cells in G2/M phase compared to control (Fig. 4A).
For KKU-M213 cells, either gemcitabine or afatinib single treatment showed no significant effect on cell cycle distribution compared to untreated control cells. Concurrent treatment of gemcitabine and afatinib significantly increased cells in subG1 population associated with a decrease in G0/G1 and S phases. Sequential treatments of either G→A or A→G significantly increased cells accumulation in S phase (Fig. 4B). These results support the hypothesis that concurrent treatment forced the majority of cells to undergo cell death while sequential treatment resulted in S-phase arrest.
We next determined the expression of cyclin D1 and cyclin E cell cycle regulators. Western blot analysis showed that treatment with gemcitabine had no effect on cyclin D1 but upregulated cyclin E in HuCCA-1 cells (Fig. 4C–E). Afatinib single treatment slightly decreased levels of cyclin D1 in both HuCCA-1 (Fig. 4C and D) and KKU-M213 cells (Fig. 4F and G). The combination treatments of gemcitabine and afatinib (G+A, G→A, A→G) significantly decreased expression of cyclin D1 (Fig. 4C, D, F, and G) but not cyclin E compared to control and gemcitabine alone in both cells (Fig. 4C, E, F, and H).

5. Sensitivity of ErbB inhibitors in primary CCA cells

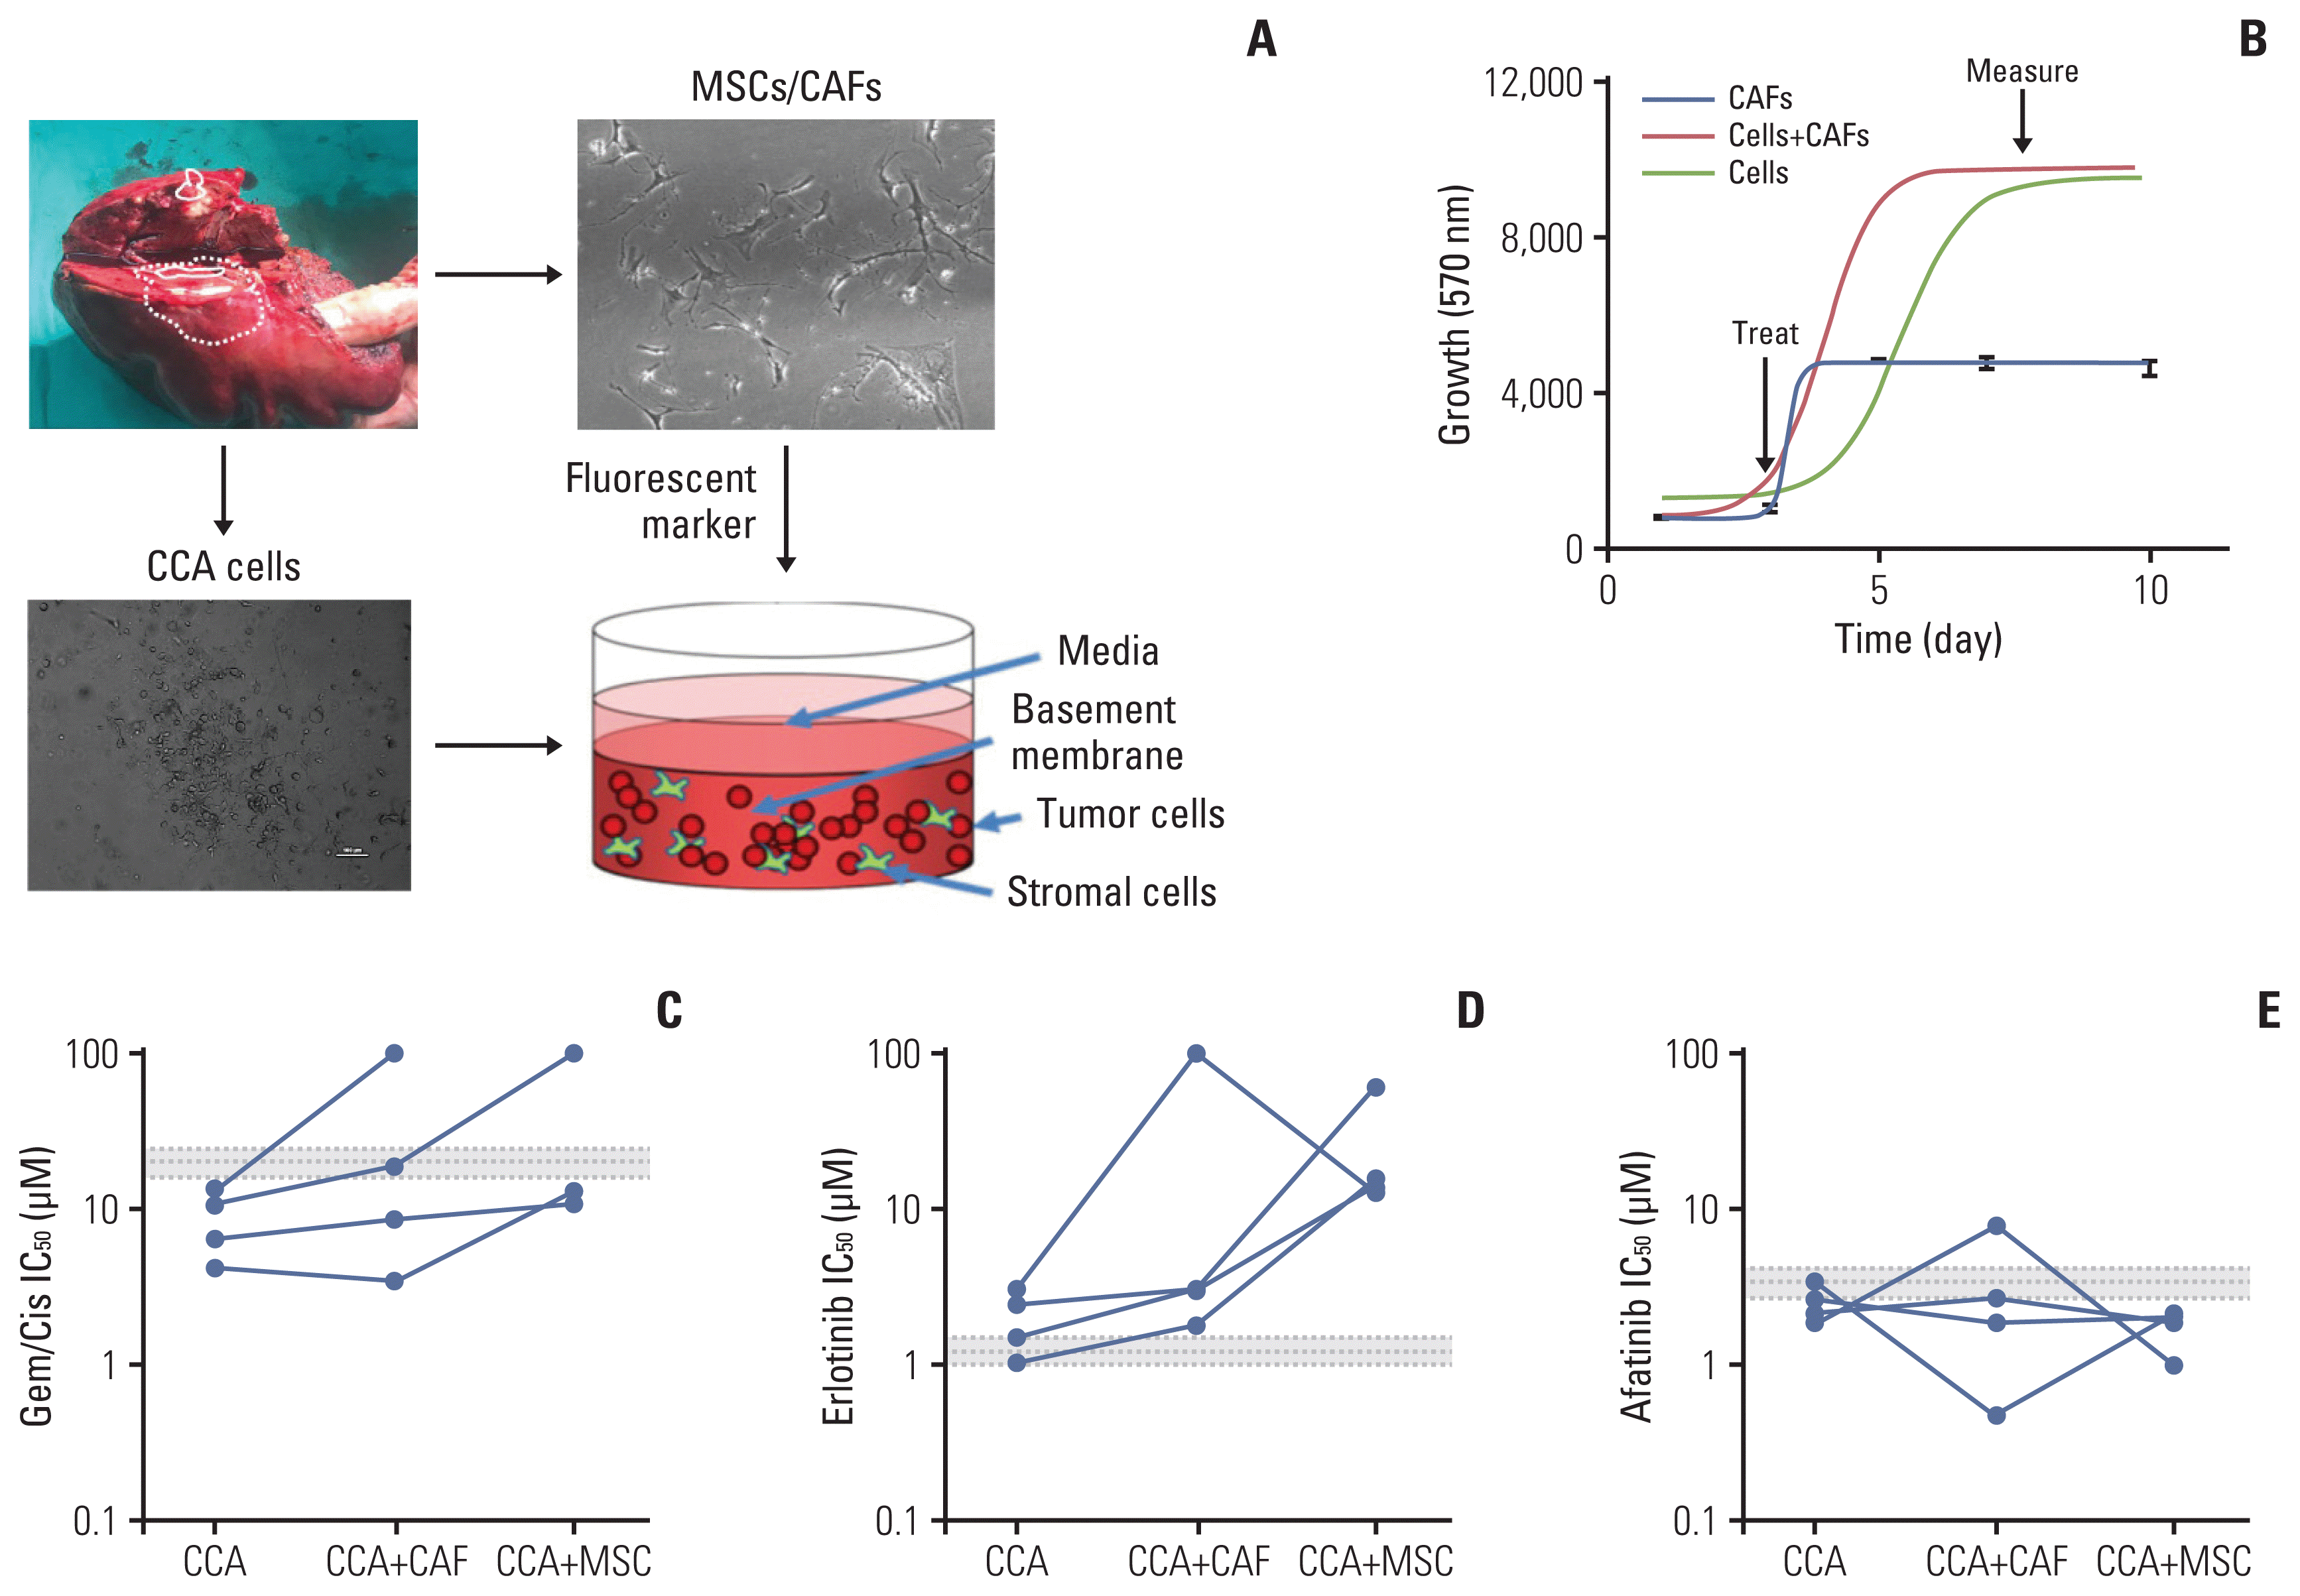
We next assessed the response to ErbB inhibitors in primary CCA cells isolated from patients, in a 3D setting, in the presence of either CAFs or MSCs (Fig. 5A). Cells were grown in 3D 96 well plates, and then treated after growth and cell survival measured (Fig. 5B). While all four cell lines tested showed a sensitivity to gemcitabine/cisplatin treatment that was below the mean peak serum concentration (mPSC) for patients undergoing treatment with these agents, the addition of CAFs or MSCs increased the resistance to these treatments, and in two cases to above the mPSC, indicating that while cells from these two tumors might appear to be sensitive on their own, one would predict that they would be insensitive to treatment clinically (Fig. 5C). When cells were treated with erlotinib, they appeared to be borderline sensitive or insensitive by themselves, and addition of CAFs or MSCs made them much less sensitive (i.e., resistant) to erlotinib treatment (Fig. 5D). In contrast, all four cell types were sensitive (IC50 less than or equal to the mPSC) for Afatinib, and three of the four were highly sensitive (IC50 less than 80% of the mPSC) in the presence of CAFs, and all four were highly sensitive in the presence of MSCs (Fig. 5E). These results suggest that not only are primary CCA cells sensitive to afatinib, they are potentially more so in a tumor relevant setting (in the presence of other stromal cells).

Discussion

In this study, we show that CCA cells, a very aggressive malignant biliary epithelial cell transformation, resistant to chemotherapy both in vivo and in vitro [19] are highly sensitive to some ErbB inhibitors. We provide evidence that the panEGFR-TK inhibitor afatinib is a promising treatment in CCA alone or in combination with gemcitabine. We also show the expression level of ErbB family in UK and Thai CCA tissues, UK primary cells, and different Thai CCA cell lines. Our study showed that CCA tissues from IHCC patients highly expressed EGFR, HER2, HER3, and HER4 from weak to strong levels. All ErbB receptors were consistently highly expressed in primary CCA cells and CCA cell lines. Two of four cell lines highly expressed EGFR, HER2, and HER3. One cell line HuCCA-1 cells also highly expressed HER4. Our results are consistent with a previous study by Yang et al. [20]; however, their cohorts study revealed HER2 was strictly expressed in extrahepatic CCA. Interestingly the expression pattern was remarkably consistent between the Thai and UK groups—despite differences in etiology (the presence of OV infection as a risk factor) and likely ethnic differences (although ethnicity data was not collected from the UK or Thai patients, the influence of ethnicity is likely to be minimal relative to the difference in etiology).
We investigated the growth response of a panel of CCA cell lines to treatment with ErbB inhibitors: afatinib, lapatinib, and erlotinib. There was no correlation of the ErbB expression with IC50 of drugs that target ErbB. Others have also reported a lack of a close correlation between varying degrees of EGFR expression in tumor cells and their sensitivity to EGFR tyrosine kinase inhibitor (TKI) inhibitors [6]. Additionally, there was no statistically significant association between EGFR or HER2 expression and the anti-tumor effect of the dual EGFR/HER-2 TKI lapatinib [21]. These findings suggest that ErbB receptor expression levels are not likely to be useful as predictive biomarkers to identify a drug response in vitro.
Of the four CCA cell lines, two high ErbB proteins expressing CCA cell lines showed different sensitivity to all the drugs tested, HuCCA-1 cells showed the greatest growth-inhibiting activity (low IC50) while KKU-M213 cells showed the least sensitivity (high IC50). We found no apparent correlation between the response to the treatments of ErbB inhibitors and the expression of ErbB proteins. These suggest that in CCA cells level of ErbB receptor expression per se is not a relevant marker of drug response. Other factors such as the mutation status of ErbB receptors or their activation status, using molecules such as KRAS and TP53 may instead be important. Difference in sensitivity to ErbB targeted drugs may be due to difference in mutation status of the two cell lines. KKU-M213 cells harbor KRAS, ERBB2, and TP53 mutants and showed less sensitive to both specific ErbB inhibitors and chemotherapeutic drugs. This evidence was supported by previous studies that reported that the treatment outcome of KRAS mutation-positive biliary tract cancer patients was significantly worse than that of KRAS wild-type patients [22], and point mutations of KRAS are usually associated with the onset of acquired resistance to anti-EGFR treatment [23]. In addition, TP53 mutation has been reported to be a negative factor for the outcome of patients with TKI therapy [24] and chemotherapeutic drugs including gemcitabine, cisplatin, and 5-FU [25,26]. Unfortunately, there is no data on mutation status of HuCCA-1 cell.
As expected, the sensitivity of these two cell lines to chemotherapeutic drugs was different; HuCCA-1 cells were more sensitive to gemcitabine while KKU-M213 cells were less sensitive to all tested chemotherapeutic drugs. Afatinib is an oral, irreversible ErbB family blocker that covalently binds to the kinase domains of EGFR, HER2, and HER4, resulting in irreversible inhibition of tyrosine kinase autophosphorylation. Afatinib was found to show a superior progression-free survival over gefitinib or erlotinib in non-small cell lung cancer [27]. We therefore evaluated the efficacy on growth inhibition of the concurrent and sequential combination of fixed ratio of gemcitabine with rising concentrations of afatinib compared with single treatment. We found an additive effect over the single treatment of afatinib or gemcitabine (at the respective dose) when cells were sequentially treated by low dose of afatinib (100 nM) in both (G→A) or inverted order (A→G) and these corresponded to a CI value that equates to synergism.
Cell response to a drug comprises a complex sequence of events; some die, some do not proliferate. Here, we examined if the additive effect resulted from alteration of the event in cell cycle. As observed in other cancer cells, the sensitive cells HuCCA-1 treated with gemcitabine (100 nM) alone induced increased subG1 and S and decreased G0/G1 cell population. This event was associated with upregulating of cyclin E, a regulator of cyclin-dependent protein kinases, which mediates the cell cycle transition from G1 to S phase [28]. Similar to other reports, afatinib alone inhibited growth of HuCCA-1 through G1 arrest and apoptotic cell death, which was associated with a decrease in cyclin D1 expression. The cell cycle events in concurrent treatment G+A in HuCCA-1 were similar to that of gemcitabine treatment alone. Along with a slight decrease in cell viability, it suggests that 100 nM afatinib concurrently treated with gemcitabine did not provide an additional effect to gemcitabine. These results are not inconsistent with a recent clinical trial by Moehler et al. [8], in which afatinib failed to show survival benefits in combination with continuing gemcitabine/cisplatin in nine patients who had progressed on gemcitabine/cisplatin with advanced CCA in a phase I trial. They suggested that chemotherapy drugs mainly act on cells in the proliferating and division phase; therefore, concurrent application of small molecule inhibitors and chemotherapy drugs might not be an appropriate treatment schedule to achieve synergism efficiency. This evidence suggests an important of timeframe schedule of the combined treatments.
In sequential treatment (G→A), more cells died (increased SubG1) and cells arrested in S phase. The low concentration of gemcitabine could allow viable cells in S phase to be responsive to afatinib. Thus, potentiation of the effects on cells traversing S phase may lead to the synergism. Similar results were found in a sequential administration of pemetrexed followed by erlotinib for non-small cell lung cancer [29]. In the inverted order (A→G) however, the cell cycle measurements suggest that this treatment sequence enabled some cells to overcome the G1 block by afatinib, but then become sensitized to gemcitabine resulting in an additive outcome in HuCCA-1 cells. These results are in agreement with the previous studies which reported that pre-treatment with low doses of kinase inhibitors can sensitize cancer cells to chemotherapy and simultaneously arrest the growth in normal cells, protecting them from subsequent chemotherapy [30]. KKU-M213 cells were resistant to afatinib treatment, possible due to the cells harboring TP53 mutation since the wild-type p53 is known to promote G0/G1 arrest [31]. However, when cells treated with the sequential G→A and A→G treatments, more cells died, and cells were reinforced to S phase arrest. Interestingly, cyclin D1 was only downregulated by the combination of afatinib and gemcitabine. This indicates that this combination can reduce progression through G1 phase of the cell cycle. Cyclin D1 is a regulatory subunit of CDK4 and CDK6, which have recently been shown to be required for CCA progression, through a transcriptional activator PTH/HHEX [32]. The results described here suggest that afatinib in combination with gemcitabine could add in additional therapeutic options for CDK4/6 resistant cancers. Overall, these results indicated that sequential treatments of gemcitabine and afatinib in either order produced additive growth inhibition effect to gemcitabine and afatinib in both gemcitabine sensitive and insensitive CCA cells. The mechanism of the synergism is still unknown, and genomic profiling of these cells could help to understand that.
We also show that the combined treatment of gemcitabine with 5-FU had a growth inhibition effect over either combination gemcitabine/cisplatin or each drug monotherapy in both HuCCA-1 and KKU-M213 cells. This finding provides a rationale for further clinical studies of chemotherapy treatment of the gemcitabine and 5-FU combination in Thai CCA patients.
Finally, we showed that in 3D culture, the presence of fibroblasts has a significant impact on the sensitivity to standard chemotherapies, but insufficient effect on erlotinib to suggest likely efficacy in vivo (as previously shown where erlotinib did not inhibit tumor growth in mice [33]). The use of close-to-patient models (primary derived cells) in combination with CAFs or their equivalent provides a more clinically relevant test of drug efficacy than using immortalized cell lines that have been grown for years on plastic and will have drifted substantially from their parental origin. It has been clearly shown that cancer cells directly derived from patients are more closely phenotypically and genotypically related than cell lines and that their behaviour in the presence of CAFs reflects more closely what happens in the tumor microenvironment [17]. Interestingly, the presence of CAFs in 3D culture enhanced the afatinib response effect suggesting that this could have an effect in mice or potentially in humans. It is noted that these primary human CCA-derived cancer cells were taken from UK patients, which may have a different response to Thai CCA cells. Thus, a comparison of 3D tumor growth assays on Thai patients’ cells would be of interest if such primary cell cultures could be initiated. There is evidence that primary cancer cells co-cultured with primary CAFs/MSCs have more likelihood of translation through to in vivo mouse and human studies than primary cancer cells themselves. It is interesting that in spite that almost all evidence published up to date indicating that fibroblast, and more specifically CAFs, contribute to the chemoresistance of tumor cells in many types of cancer, including CCA, our finding showed the complete opposite effect for afatinib. This might be consistent with recent observations in genetically engineered mouse models and clinical studies that have suggested that CAFs are not one entity but rather contain heterogeneous functional subpopulations. There may exist at least two functionally different populations of CAFs, including cancer-promoting CAFs, cancer-restraining CAFs.
In conclusion, we demonstrated the potential therapeutic benefits of afatinib in combination with gemcitabine which exerted anti-tumor activity superior to each drug monotherapy particularly in the KRAS-mutated CCA cells. Our results strengthen the concept that a sequential treatment schedule combining afatinib and gemcitabine may be important for improving outcome against CCA.

Electronic Supplementary Material

Supplementary materials are available at Cancer Research and Treatment website (https://www.e-crt.org).

Notes

Ethical Statement

Fresh surgical material from tumor resections at Nottingham University NHS Trust, were collected with informed patient consent and National Research Ethics Service approval (NRES REC 10/H0405/6). Samples were used in accordance with NRES approval (NRES REC 08/H0403/37). The study protocol in Thailand was approved by the ethical clearance committee on human rights related to research involving human subjects, Faculty of Medicine Ramathibodi Hospital, Mahidol University (protocol no. 12-58-41) and Rajavithi Hospital (protocol no. 61042).

Author Contributions

Conceived and designed the analysis: Wongprasert K, Bates DO, Tohtong R, Janvilisri T, Kumkate S, Grabowska AM, Larbcharoensub N.

Collected the data: Boonsri B, Yacqub-Usman K, Thintharua P, Myint KZ, Sae-Lao T, Collier P, Suriyonplengsaeng C, Egbuniwe IU.

Contributed data or analysis tools: Suriyonplengsaeng C, Kumkate S, Gomez D, Egbuniwe IU, Mukherjee A, Zaitoun AM, Kuakpaetoon T.

Performed the analysis: Boonsri B, Yacqub-Usman K, Balasubramanian B, Venkatraman S, Myint KZ, Thintharua P, Bates DO.

Wrote the paper: Boonsri B, Wongprasert K, Bates DO, Tohtong R, Yacqub-Usman K, Myint KZ, Venkatraman S, Balasubramanian B, Grabowska AM.

Conflicts of Interest

Conflicts of interest relevant to this article was not reported.

ACKNOWLEDGMENTS

This work is supported by the Thailand Research Fund and the Medical Research Council (UK), Newton Fund MR/N01247X/1, Project Nos. DBG 5980006, Rajavithi Hospital Research Fund, “Young Researcher Development Program 2018” from National Research Council of Thailand (NRCT), and Research Assistantship, Faculty of Graduate Studies, Mahidol University. We would like to thank John Gordan for sharing cell lines.

References

1. Konfortion J, Jack RH, Davies EA. Coverage of common cancer types in UK national newspapers: a content analysis. BMJ Open. 2014; 4:e004677.
crossref
2. Maroni L, Pierantonelli I, Banales JM, Benedetti A, Marzioni M. The significance of genetics for cholangiocarcinoma development. Ann Transl Med. 2013; 1:28.
3. Sahu S, Sun W. Targeted therapy in biliary tract cancers-current limitations and potentials in the future. J Gastrointest Oncol. 2017; 8:324–36.
crossref
4. Hyung J, Kim B, Yoo C, Kim KP, Jeong JH, Chang HM, et al. Clinical benefit of maintenance therapy for advanced biliary tract cancer patients showing no progression after first-line gemcitabine plus cisplatin. Cancer Res Treat. 2019; 51:901–9.
crossref
5. Ritter CA, Arteaga CL. The epidermal growth factor receptor-tyrosine kinase: a promising therapeutic target in solid tumors. Semin Oncol. 2003; 30(1 Suppl 1):3–11.
crossref
6. Ciardiello F, Tortora G. A novel approach in the treatment of cancer: targeting the epidermal growth factor receptor. Clin Cancer Res. 2001; 7:2958–70.
7. Roskoski R Jr. ErbB/HER protein-tyrosine kinases: Structures and small molecule inhibitors. Pharmacol Res. 2014; 87:42–59.
crossref
8. Moehler M, Maderer A, Ehrlich A, Foerster F, Schad A, Nickolay T, et al. Safety and efficacy of afatinib as add-on to standard therapy of gemcitabine/cisplatin in chemotherapy-naive patients with advanced biliary tract cancer: an open-label, phase I trial with an extensive biomarker program. BMC Cancer. 2019; 19:55.
crossref
9. Peck J, Wei L, Zalupski M, O’Neil B, Villalona Calero M, Bekaii-Saab T. HER2/neu may not be an interesting target in biliary cancers: results of an early phase II study with lapatinib. Oncology. 2012; 82:175–9.
crossref
10. Pellat A, Vaquero J, Fouassier L. Role of ErbB/HER family of receptor tyrosine kinases in cholangiocyte biology. Hepatology. 2018; 67:762–73.
crossref
11. Hirsch FR, Varella-Garcia M, Bunn PA Jr, Di Maria MV, Veve R, Bremmes RM, et al. Epidermal growth factor receptor in non-small-cell lung carcinomas: correlation between gene copy number and protein expression and impact on prognosis. J Clin Oncol. 2003; 21:3798–807.
crossref
12. Ruschoff J, Hanna W, Bilous M, Hofmann M, Osamura RY, Penault-Llorca F, et al. HER2 testing in gastric cancer: a practical approach. Mod Pathol. 2012; 25:637–50.
crossref
13. Bartley AN, Washington MK, Ventura CB, Ismaila N, Colasacco C, Benson AB 3rd, et al. HER2 testing and clinical decision making in gastroesophageal adenocarcinoma: guideline from the College of American Pathologists, American Society for Clinical Pathology, and American Society of Clinical Oncology. Am J Clin Pathol. 2016; 146:647–69.
crossref
14. Sirisinha S, Tengchaisri T, Boonpucknavig S, Prempracha N, Ratanarapee S, Pausawasdi A. Establishment and characterization of a cholangiocarcinoma cell line from a Thai patient with intrahepatic bile duct cancer. Asian Pac J Allergy Immunol. 1991; 9:153–7.
15. Sripa B, Leungwattanawanit S, Nitta T, Wongkham C, Bhudhisawasdi V, Puapairoj A, et al. Establishment and characterization of an opisthorchiasis-associated cholangiocarcinoma cell line (KKU-100). World J Gastroenterol. 2005; 11:3392–7.
crossref
16. Liu X, Ory V, Chapman S, Yuan H, Albanese C, Kallakury B, et al. ROCK inhibitor and feeder cells induce the conditional reprogramming of epithelial cells. Am J Pathol. 2012; 180:599–607.
crossref
17. Saunders JH, Onion D, Collier P, Dorrington MS, Argent RH, Clarke PA, et al. Individual patient oesophageal cancer 3D models for tailored treatment. Oncotarget. 2017; 8:24224–36.
crossref
18. Chou TC. Drug combination studies and their synergy quantification using the Chou-Talalay method. Cancer Res. 2010; 70:440–6.
crossref
19. Zografos GN, Farfaras A, Zagouri F, Chrysikos D, Karaliotas K. Cholangiocarcinoma: principles and current trends. Hepatobiliary Pancreat Dis Int. 2011; 10:10–20.
crossref
20. Yang X, Wang W, Wang C, Wang L, Yang M, Qi M, et al. Characterization of EGFR family gene aberrations in cholangiocarcinoma. Oncol Rep. 2014; 32:700–8.
crossref
21. Komoto M, Nakata B, Nishii T, Kawajiri H, Shinto O, Amano R, et al. In vitro and in vivo evidence that a combination of lapatinib plus S-1 is a promising treatment for pancreatic cancer. Cancer Sci. 2010; 101:468–73.
22. Yokoyama M, Ohnishi H, Ohtsuka K, Matsushima S, Ohkura Y, Furuse J, et al. KRAS mutation as a potential prognostic biomarker of biliary tract cancers. Jpn Clin Med. 2016; 7:33–9.
crossref
23. Misale S, Yaeger R, Hobor S, Scala E, Janakiraman M, Liska D, et al. Emergence of KRAS mutations and acquired resistance to anti-EGFR therapy in colorectal cancer. Nature. 2012; 486:532–6.
crossref
24. Canale M, Petracci E, Delmonte A, Chiadini E, Dazzi C, Papi M, et al. Impact of TP53 mutations on outcome in EGFR-mutated patients treated with first-line tyrosine kinase inhibitors. Clin Cancer Res. 2017; 23:2195–202.
crossref
25. Royds JA, Iacopetta B. p53 and disease: when the guardian angel fails. Cell Death Differ. 2006; 13:1017–26.
crossref
26. Hientz K, Mohr A, Bhakta-Guha D, Efferth T. The role of p53 in cancer drug resistance and targeted chemotherapy. Oncotarget. 2017; 8:8921–46.
crossref
27. Kim Y, Lee SH, Ahn JS, Ahn MJ, Park K, Sun JM. Efficacy and safety of afatinib for EGFR-mutant non-small cell lung cancer, compared with gefitinib or erlotinib. Cancer Res Treat. 2019; 51:502–9.
crossref
28. Lu X, Liu J, Legerski RJ. Cyclin E is stabilized in response to replication fork barriers leading to prolonged S phase arrest. J Biol Chem. 2009; 284:35325–37.
crossref
29. Li T, Ling YH, Goldman ID, Perez-Soler R. Schedule-dependent cytotoxic synergism of pemetrexed and erlotinib in human non-small cell lung cancer cells. Clin Cancer Res. 2007; 13:3413–22.
crossref
30. Ubezio P, Falcetta F, Carrassa L, Lupi M. Integrated experimental and simulation study of the response to sequential treatment with erlotinib and gemcitabine in pancreatic cancer. Oncotarget. 2016; 7:15492–506.
crossref
31. Xiang T, Li L, Yin X, Yuan C, Tan C, Su X, et al. The ubiquitin peptidase UCHL1 induces G0/G1 cell cycle arrest and apoptosis through stabilizing p53 and is frequently silenced in breast cancer. PLoS One. 2012; 7:e29783.
crossref
32. Kitchen P, Lee KY, Clark D, Lau N, Lertsuwan J, Sawasdichai A, et al. A runaway PRH/HHEX-Notch3-positive feedback loop drives cholangiocarcinoma and determines response to CDK4/6 inhibition. Cancer Res. 2020; 80:757–70.
crossref
33. Hynes NE, MacDonald G. ErbB receptors and signaling pathways in cancer. Curr Opin Cell Biol. 2009; 21:177–84.
crossref

Fig. 1
Expression of ErbB receptors in surgically resected patient cholangiocarcinoma (CCA) tissue. (A) Absolute RNA expression of epidermal growth factor receptor (EGFR), human epidermal growth factor receptor (HER) 2, HER3, and HER4 transcript levels in paired CCA patient resected tissue and adjacent margin, detected by droplet digital polymerase chain reaction (ddPCR). Significant difference was determined by paired t test. (B) Absolute expression of EGFR, HER2, HER3, and HER4 transcript levels in primary CCA cells isolated from the tumor tissue and primary cells from normal tissue margins, detected by ddPCR. Significant difference was determined by Welch’s t test. *p < 0.05, **p < 0.01, ***p < 0.001 compared with margin. (C) Immunohistochemistry for ErbB proteins in CCA tissues. EGFR: placenta (positive control EGFR); breast cancer (positive control HER2 and HER3) and normal liver (positive control HER4). Immunopositive cells stained with 3,3′-diaminobenzidine (brown) and counterstained with hematoxylin (blue). Asterisks indicate tumor margin. Scale bars=50 μm.
crt-2020-585f1.gif
Fig. 2
The percentage of cell survival of different four cholangiocarcinoma cell lines treated with various concentrations of ErbB inhibitors at 48 hours by MTT assay. Afatinib (A), lapatinib (B), and erlotinib (C). The percentage cell survival of the combined treatments of fixed concentration of gemcitabine (0.1 μM) with afatinib, lapatinib, and erlotinib (0.1, 1, and 10 μM) in HuCCA-1 cells (D) and KKU-M213 (E). *p < 0.05 compared with untreated control group, #p < 0.05 compared with the gemcitabine-treated group The combination effect is described as synergism (blue), or antagonism (red) according to the combination index value.
crt-2020-585f2.gif
Fig. 3
The percentage cell survival of HuCCA-1 (A) and KKU-M213 (B) cells treatment with gemcitabine (0.1 μM), afatinib (0.1 μM blue, 1 μM red, 10 μM green), concurrent treatment of gemcitabine (0.1 μM) and afatinib (0.1, 1, and 10 μM), sequential treatment of gemcitabine (0.1 μM) (6 hours) followed with afatinib (0.1, 1, and 10 μM) (18 hours) and sequential treatment of afatinib (0.1, 1, and 10 μM) (6 hours) followed with gemcitabine (0.1 μM) (18 hours) of survival. *p < 0.05 compared with untreated control group, #p < 0.05 compared with the gemcitabine-treated group, p < 0.05 compared with afatinib treated group at respective dose of drug.
crt-2020-585f3.gif
Fig. 4
Effect of gemcitabine and afatinib combination on cell cycle distribution in HuCCA-1 (A) and KKU-M213 (B) cells. Representative Western blotting showing the expression of cyclin D1 and cyclin E proteins in HuCCA-1 (C) and KKU-M213 (F) cells treated with gemcitabine (0.1 μM), afatinib (0.1 μM), concurrent treatment of gemcitabine and afatinib (G+A), sequential treatment of gemcitabine (6 hours) followed with afatinib (18 hours) (G→A) and sequential treatment of afatinib (6 hours) followed with gemcitabine (18 hours) (A→G). Corresponded densitometric analysis of cyclin D1 (D, G) and cyclin E (E, H) proteins expression normalized with α-tubulin in HuCCA-1 and KKU-M213 cells, respectively. Expression value is expressed as fold of control (mean±standard error of mean) from three independent experiment. *p < 0.05 compared with untreated control group, #p < 0.05 compared with the gemcitabine-treated group.
crt-2020-585f4.gif
Fig. 5
Effect of ErbB inhibitors on primary cholangiocarcinoma (CCA) lines in 3D-tumor growth assay (TGA). (A) Four primary cells were derived from surgically resected CCA tissue samples; CCA-UK5, CCA-UK6, CCA-UK7, and CCA-UK9. Primary cells (dashed), matched cancer associated fibroblasts (CAFs) also derived from the same tissue samples (solid), a human mesenchymal cell line (mesenchymal stem cell [MSC] not shown) or a mixture (CAF+cancer cells shown as dotted line) were employed for the 3D-TGA. (B) Growth of cells, CAFs, and primary cells and CAF (red line) or MSC (green line) mixed with the primary cells was measured using AlamarBlue. Percent cell survival of CCA1 and CCA2 treated with gemcitabine/cisplatin (Gem/Cis) (C), erlotinib (D), or afatinib (E). The mean±20% peak serum concentration for patients is given as the dotted and shaded lines (grey).
crt-2020-585f5.gif
Table 1
Percentage of ErbB stained tumor from the UK and Thai patients
EGFR family Origin Immunohistochemistry p-value
Weak Moderate Strong
EGFR UK 13.3 53.3 33.3 0.430
Thai 26.7 46.7 26.7
HER2 UK 60 40 0 0.027
Thai 40 40 20
HER3 UK 80 20 0 0.206
Thai 80 13.3 6.7
HER4 UK 0 20 80 0.061
Thai 6.7 40 53.3

Values are presented as percentage. EGFR, epidermal growth factor receptor; HER2, human epidermal growth factor receptor.

Table 2
IC50 value (μM) of the specific ErbB inhibitors at 48 hours
CCA cell line IC50 at 48 hr (μM)
Afatinib Erlotinib Lapatinib
KKU-M213 (JCRB1557) 4.305 8.058 11.140
HuCCA-1 (JCRB1657) 0.729 4.519 0.3237
KKU-100 (JCRB1568) 1.609 7.948 0.3074
KKU-M055 (JCRB1551) 3.823 23.65 3.892

CCA, cholangiocarcinoma.

TOOLS
Similar articles